Assignment 2: Single-View to 3D
1. Exploring loss functions
1.1Fitting a voxel grid

1.2Fitting a point cloud
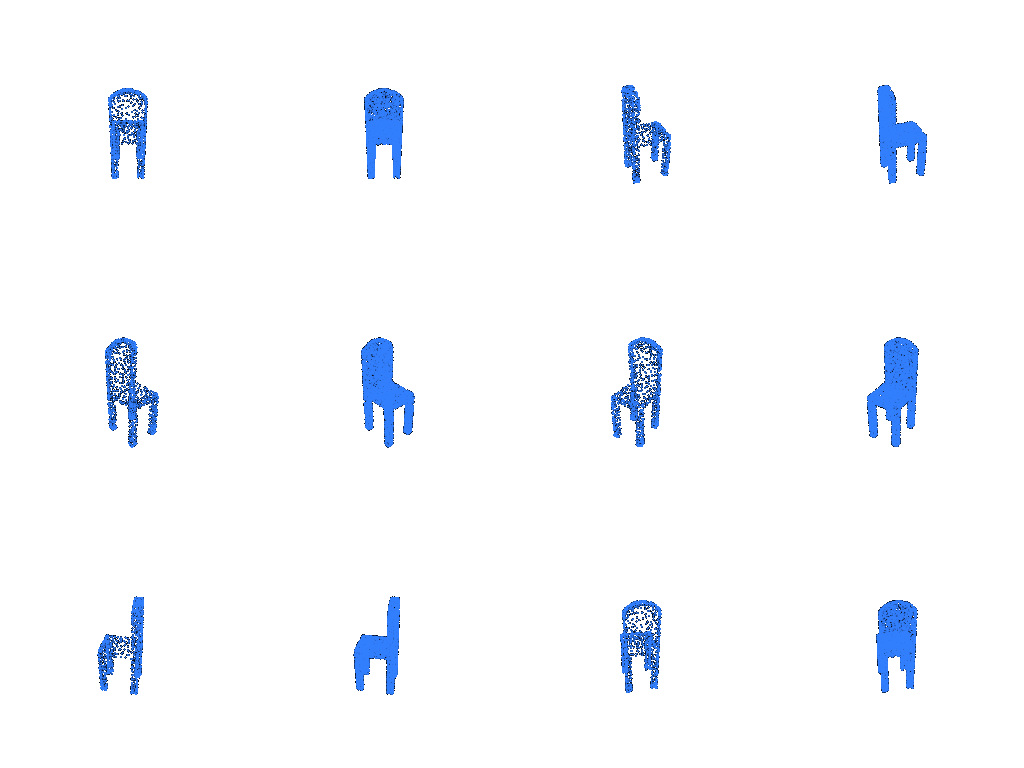
1.3Fitting a mesh

2. Reconstructing 3D from single view
2.1Image to voxel grid


2.2Image to point cloud
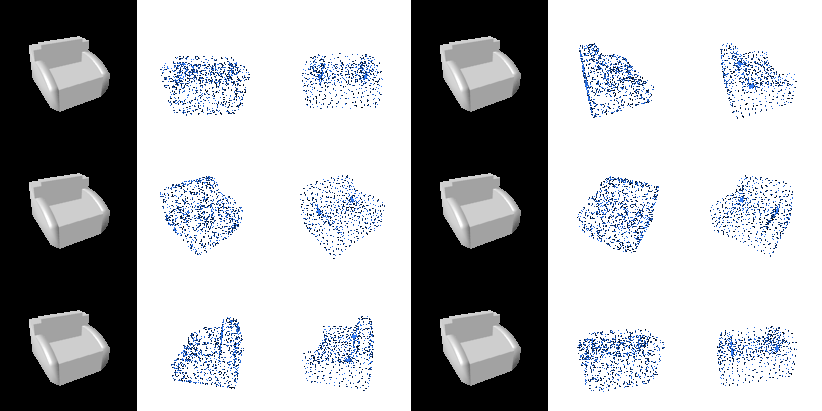

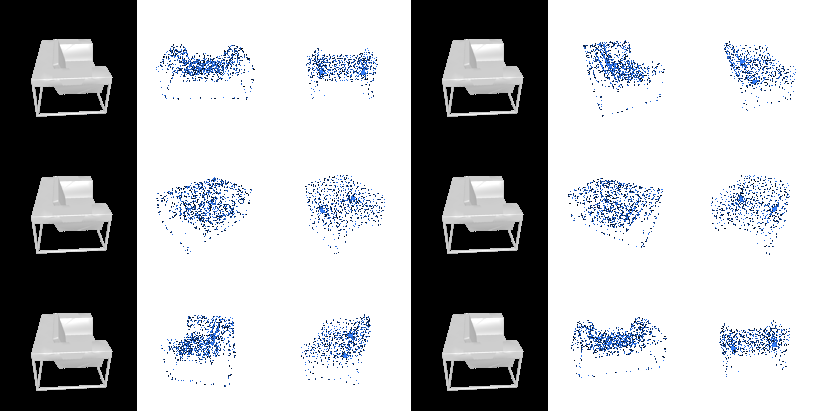
2.3Image to mesh
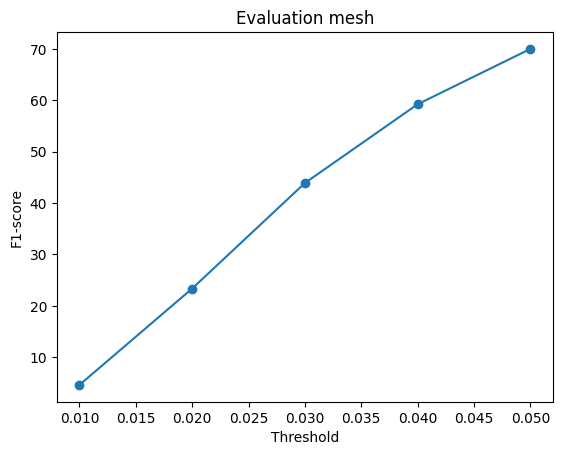

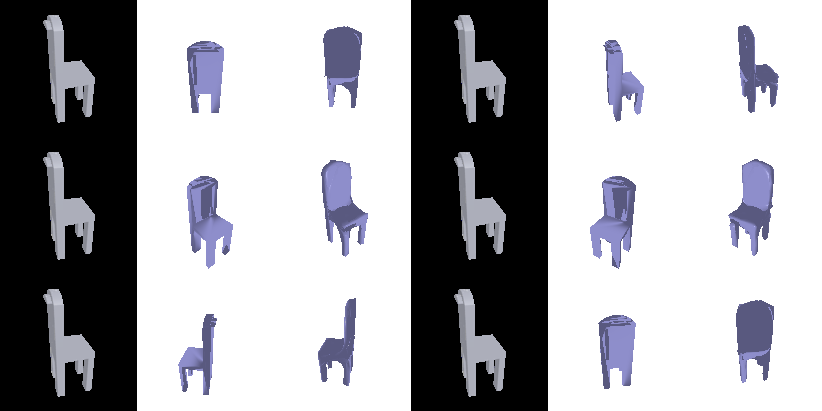
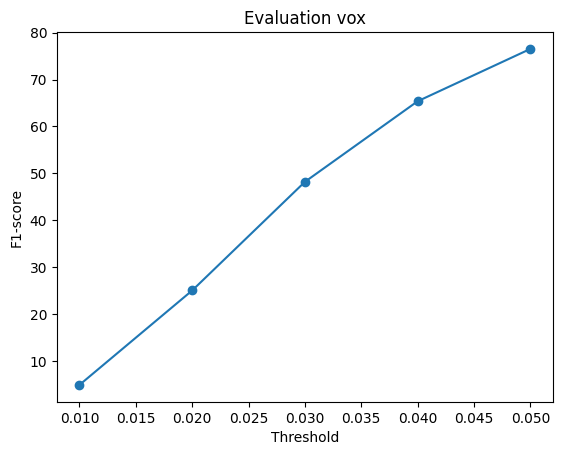
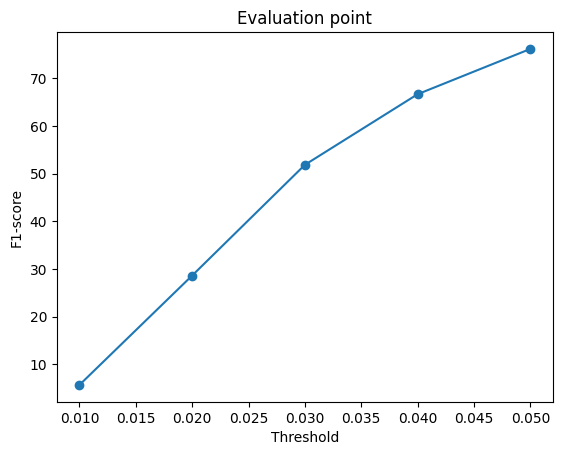
From the results, it can be concluded that point cloud has the highest F1@0.05 score. This is because the point clouds has no ties, they are separated in the 3D space, and we only need to consider the chamfer loss which is how close it is from each point to the closest ground truth surface, therefore, leaving a gap has nearly no effect on the F1 score of the point cloud predcitions. Voxels has a slight lower F1@score compared to point cloud, depending on the resolution of the 3D space, this score can be different. Because the training set and the testing set involves a lot of chairs, with chair legs so thin that they are hardly represented by voxels, resulting the reduce of the F1 score. Mesh has the lowest F1 score, this is because we are stretching a ico-sphere into a chair-like shape, and the loss function (laplacian smoothing loss) penalizes unsmooth structures, but chairs has sharp edges. That results the lowest F1 score for meshes.
2.4Analyse effects of hyperparams variations
In train_model.py, I noticed this loss function for mesh:
loss = args.w_chamfer * loss_reg + args.w_smooth * loss_smoothIn my analysis of the F1 score in the previous section, I mentioned that smoothness is a factor that reduce F1 score for meshes because chairs has shape edges. I wonder if I can change w_smooth so I can visualize the F1 score change specifically for meshes, therefore, I explored w_smooth = [0.01, 0.1, 1.0, 10.0] to see what will it effect. By training and evaluating for 4 different times, I obtained the result below:
| w_smooth | Average F1@0.05 |
|---|---|
| 0.01 | 74.22 |
| 0.1 | 73.96 |
| 1.0 | 72.50 |
| 10.0 | 64.03 |
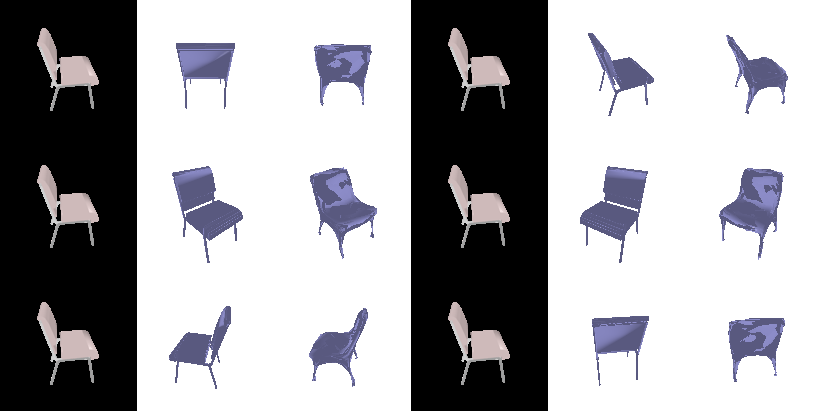


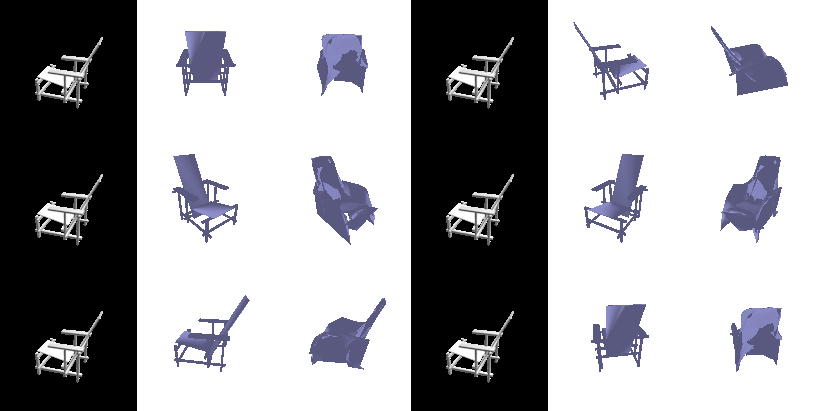
The result does show my hypothesis, the predicted 3D meshes all became smoother with less sharp edges, but the corresponding F1 score also decreases as w_smooth increase.
2.5Interpret your model
2.5.1 F1 score investigation
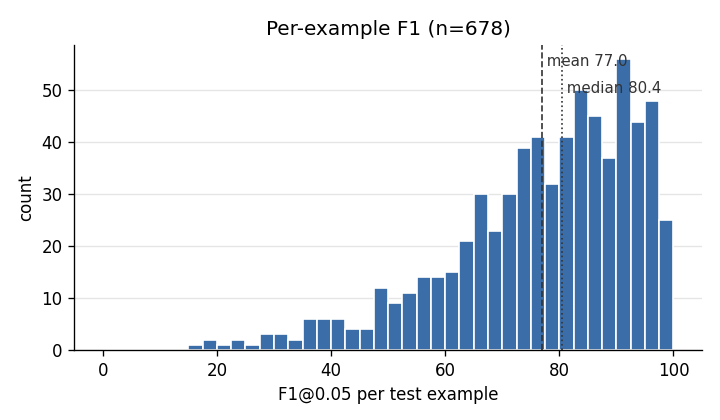
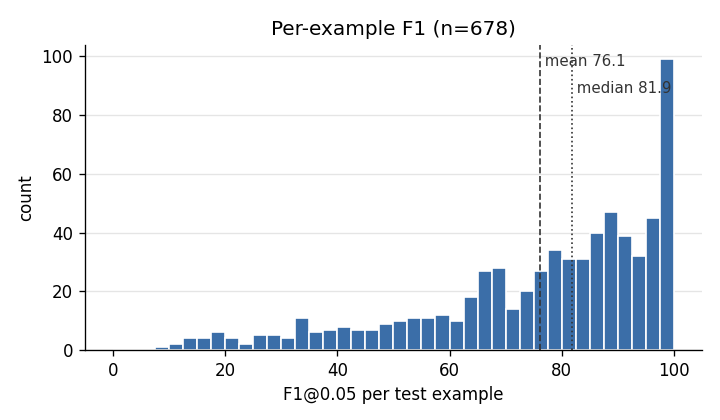
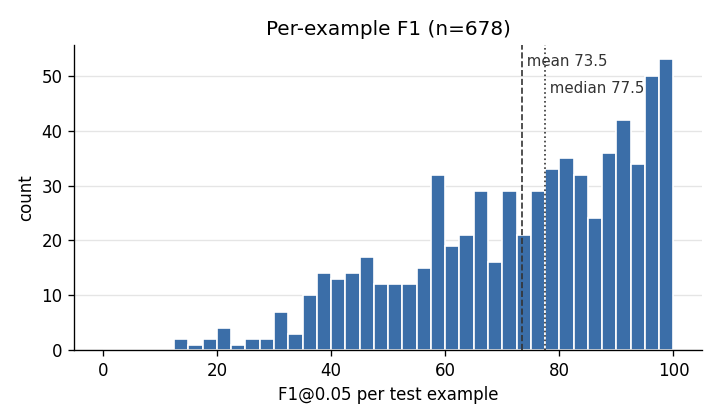
The first visualization I want to create is an overall F1 score analysis of the evaluation process, because in the code we were provided we can only see the average F1 score, and I want to gain more information from the distribution of the F1 scores for the testing set. Therefore, I plotted 3 histograms for showing the distribuition.
And I also wanted to see the results with the best F1 score, the result with the lowest F1 score and the result with median F1 score, so I extracted 5 top-scored prediction results, 5 closest-to-median scored prediction results, and 5 bottom-scored prediction results. Doing so helped me understand if the F1 score is affected by the shape of 2D object.
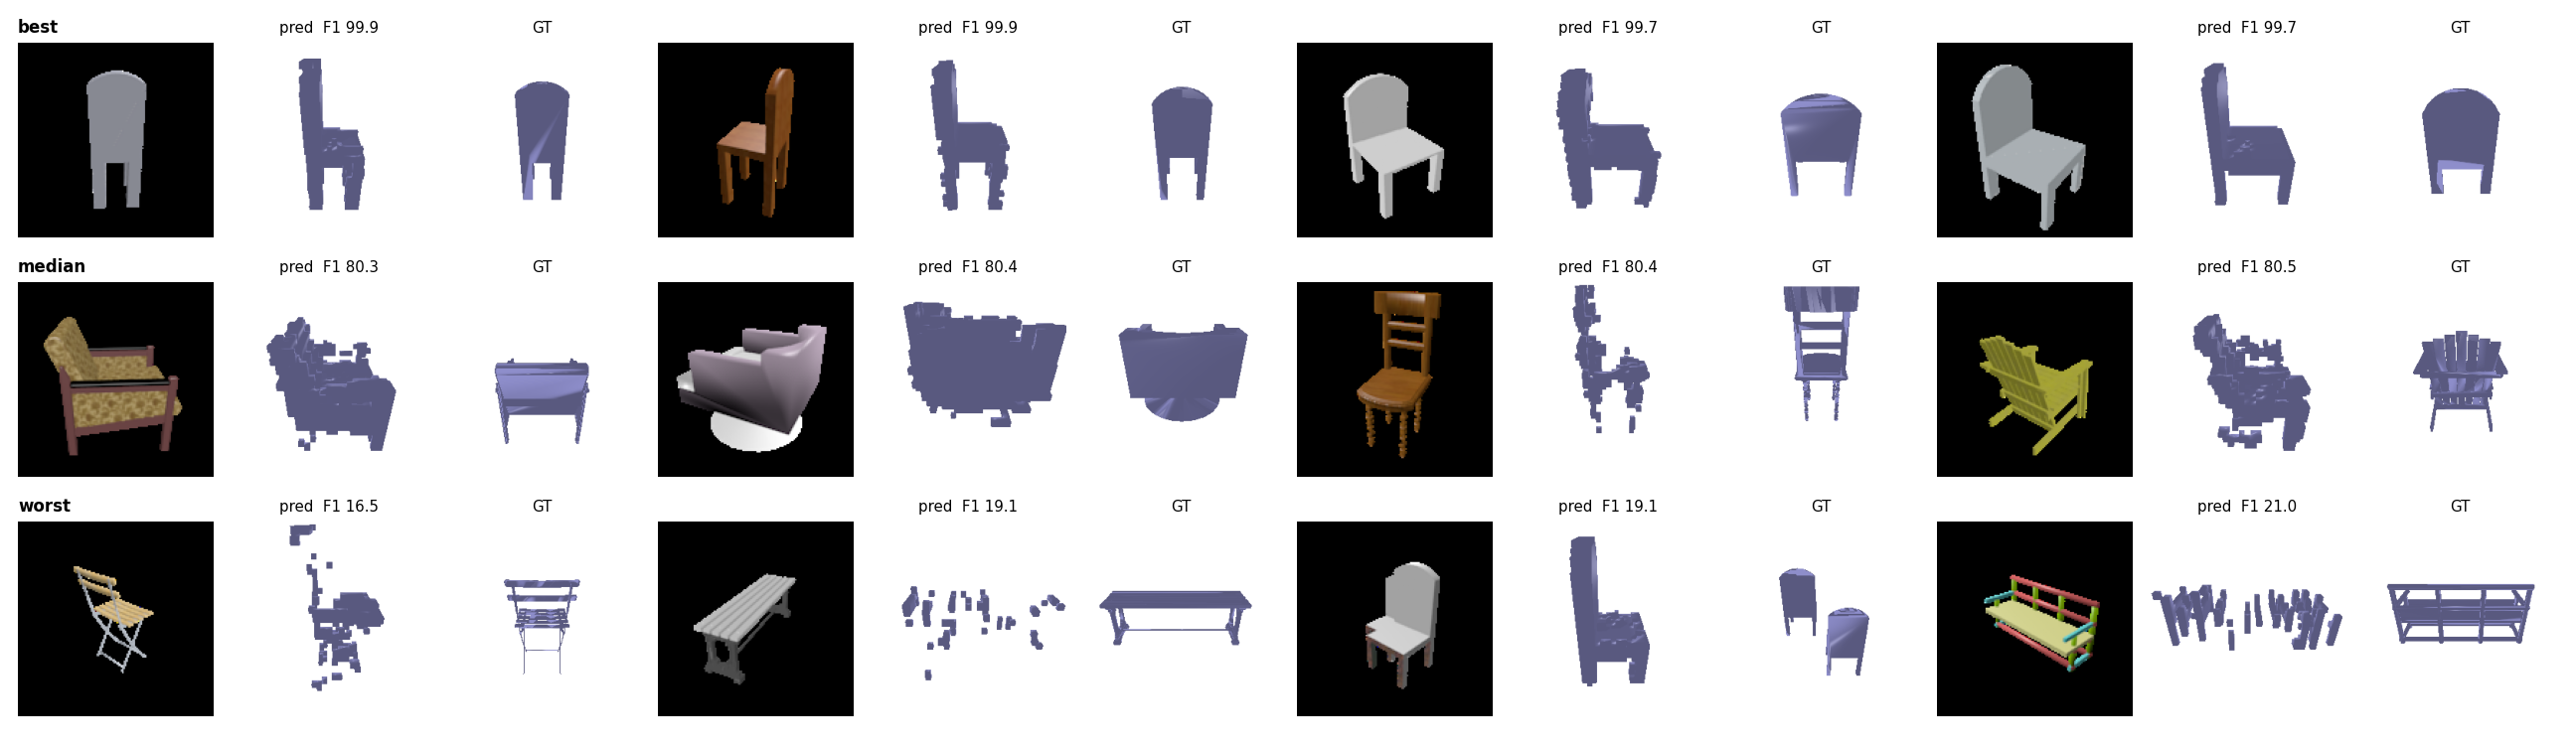
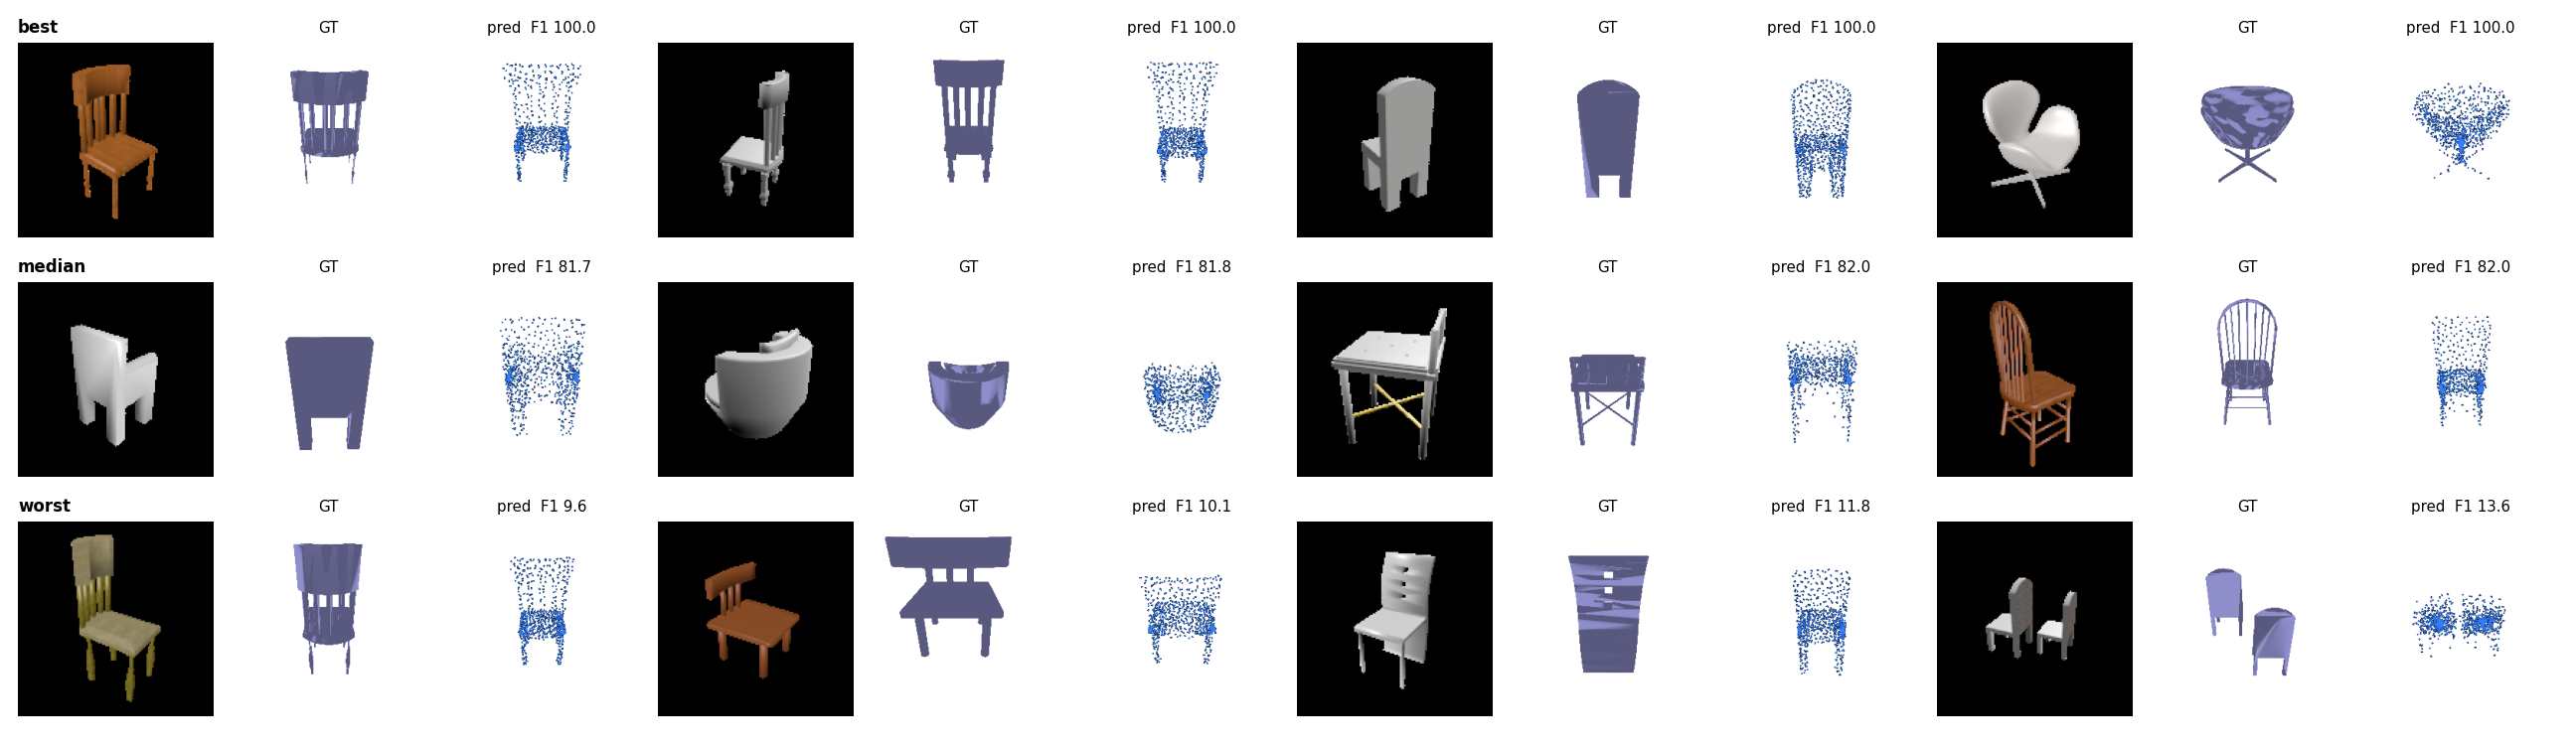
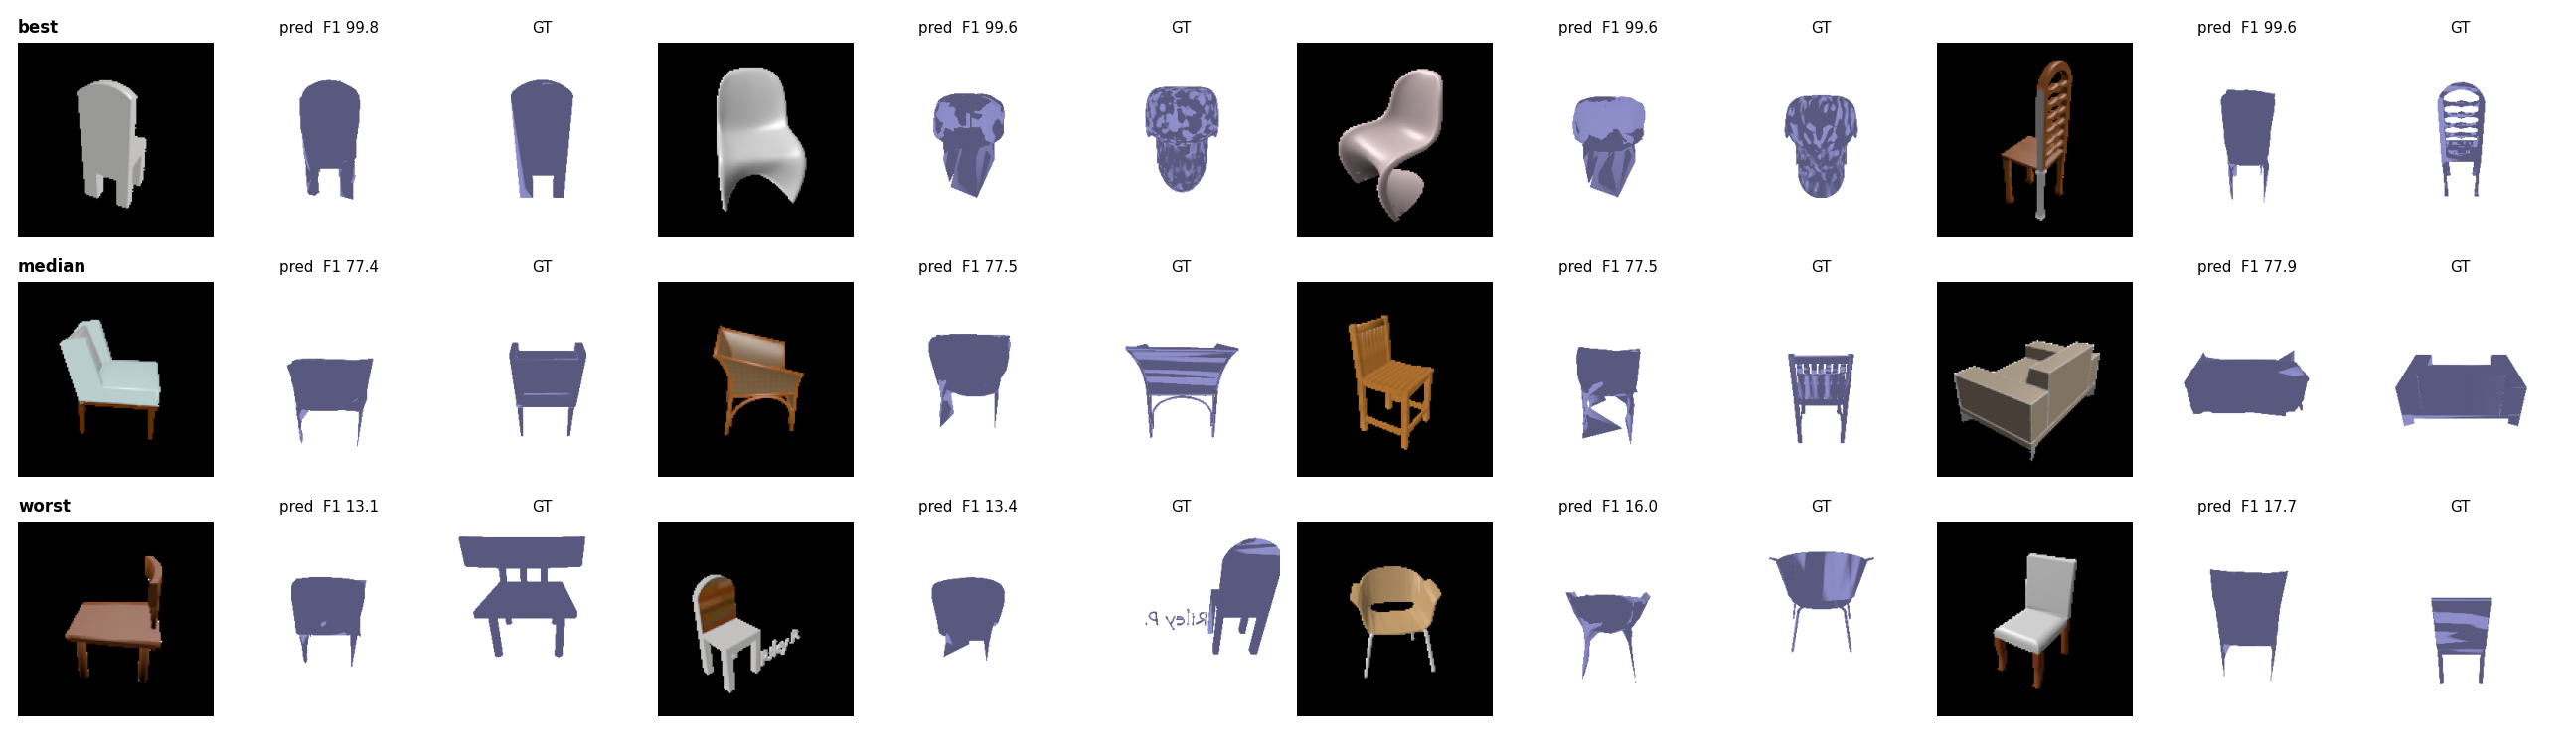
From the result above, there are several takeaways:
- Point cloud does yield the best F1 score over the dataset provided, as nearly 100 samples from the testing set achieves nearly full F1 score. Even though voxels has a overall higher F1 score compared to mesh, it has fewer high-score predicted results.
- Vox tend to have a better F1 score on an object that has no holes, where point cloud is good at predicting objects with holes and fine details. Some of the result doesn't make too much sense for me as I think the predicted result is actually simliar to the GT result but still receives a low score.
2.5.2 Azimuth investigation
From my understanding of the dataset, each object in the test set comes with 10 rendered views, taken from different, randomly chosen camera azimuths, but the evaluation only uses one randomly selected view per object. I wondered whether the input viewpoint affects the prediction. To test this, I took one test object (chair #85) and predicted it from all 10 of its views using the voxel, point cloud and mesh models. Below are the results I obtained:

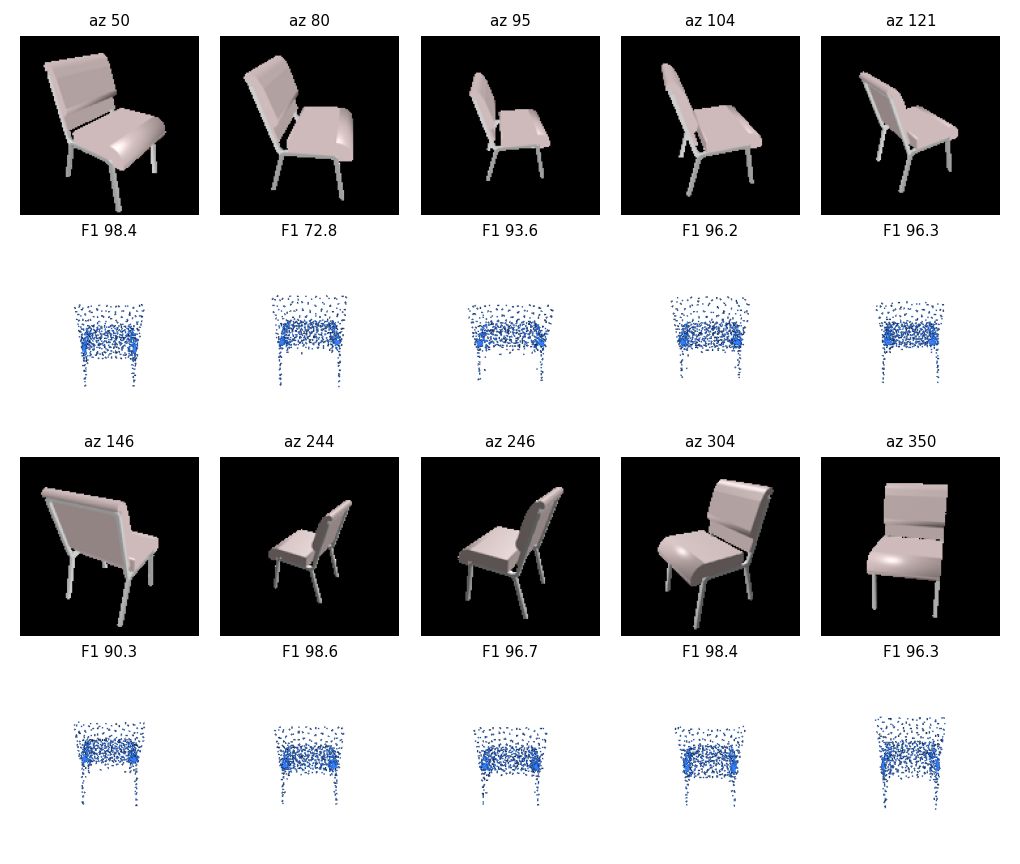
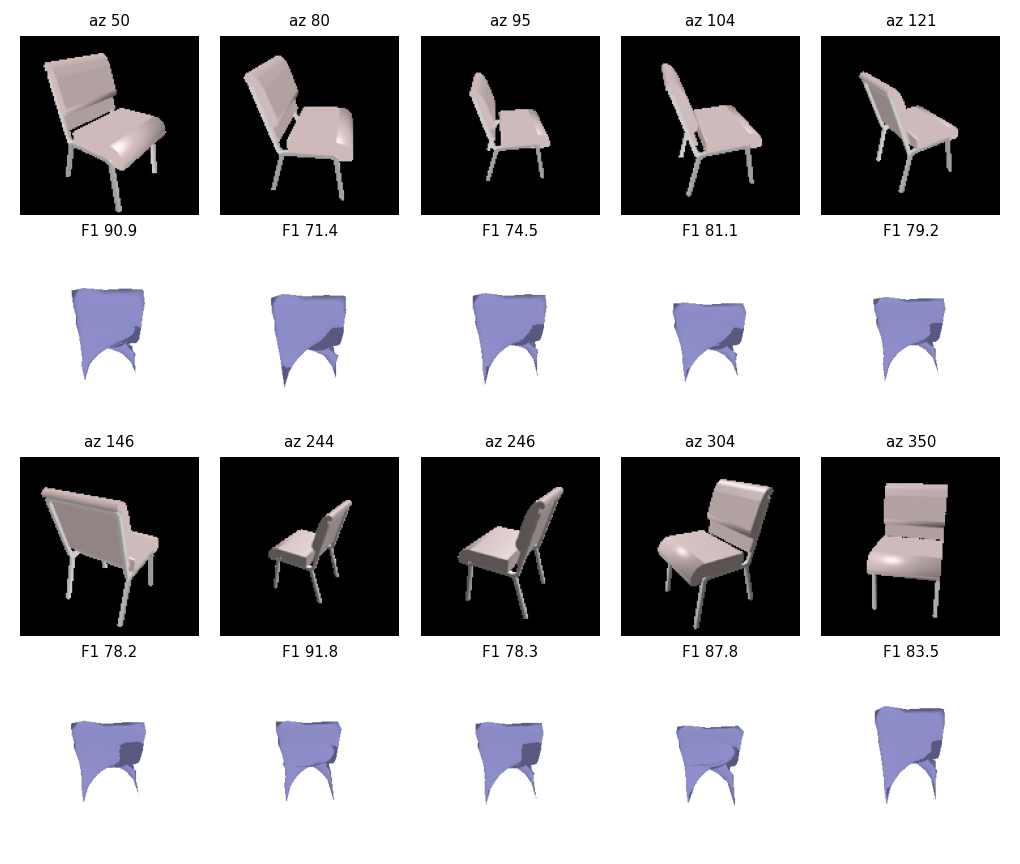
The result shows that different camera azimuth do have an effect on the predicted result F1 scores. My hypothesis is that if the image shows fine details about the object, the predicted result should have a higher F1 score, but it seems like for camera azimuth 244 all 3 predicted result has the nearly highest F1 score, which doesn't agree with my hypothesis.
3. Exploring other architectures / datasets
3.1Implicit network
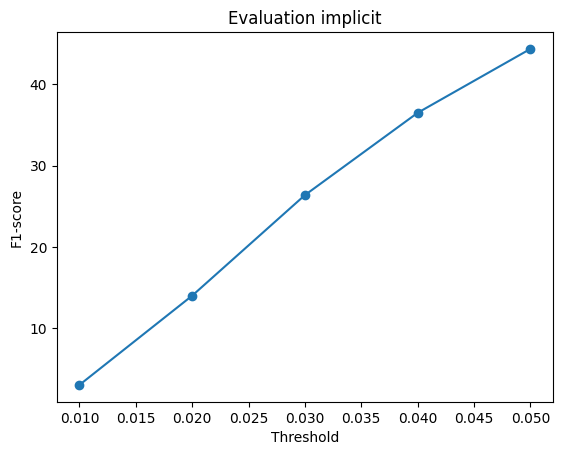
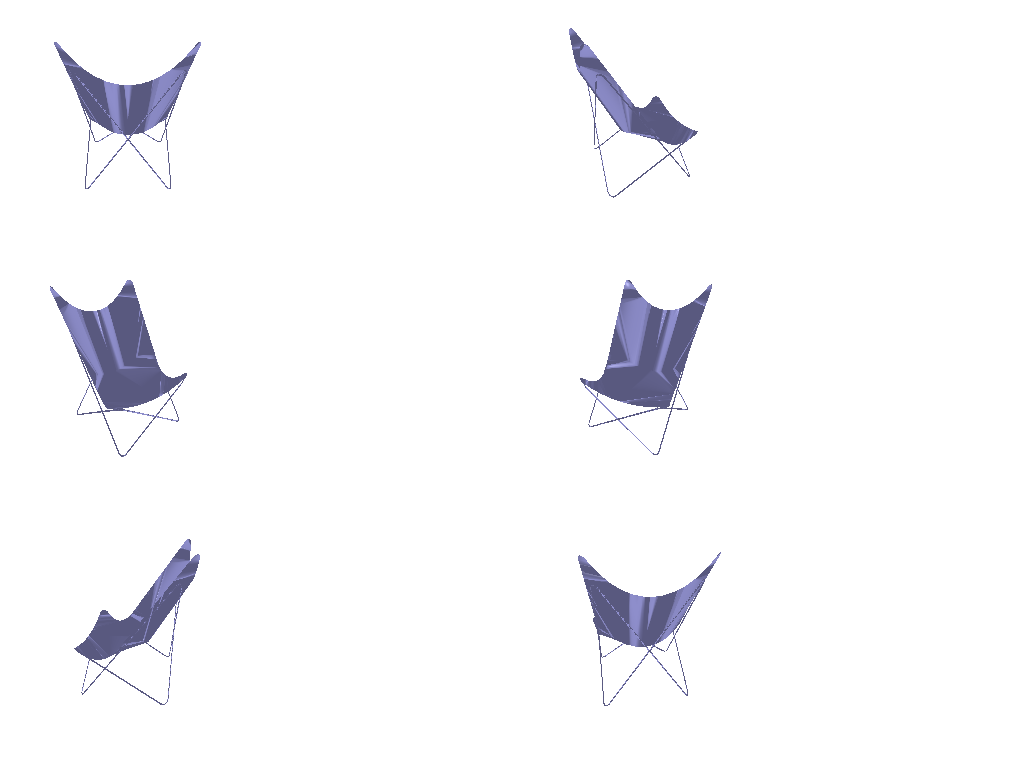
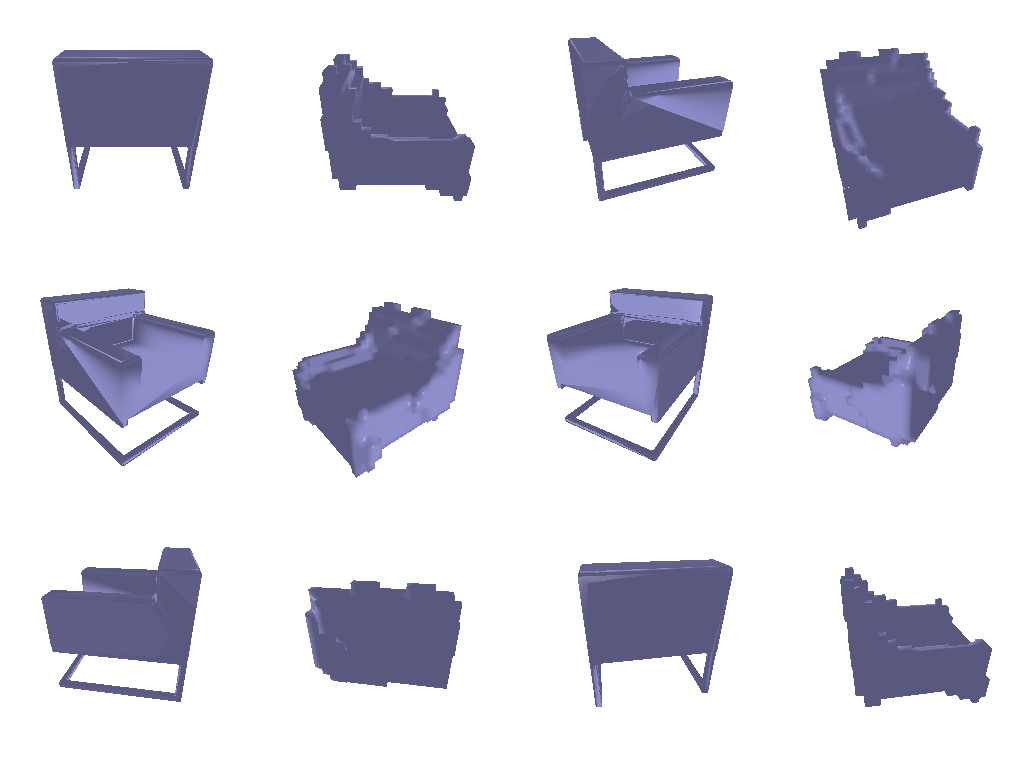
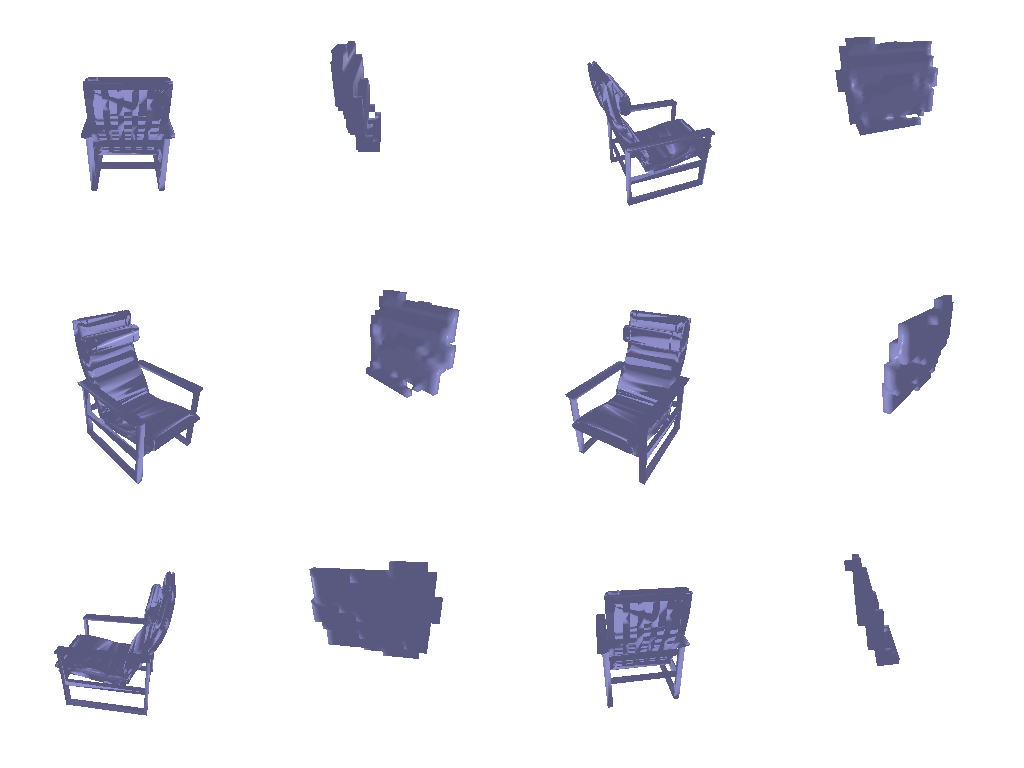
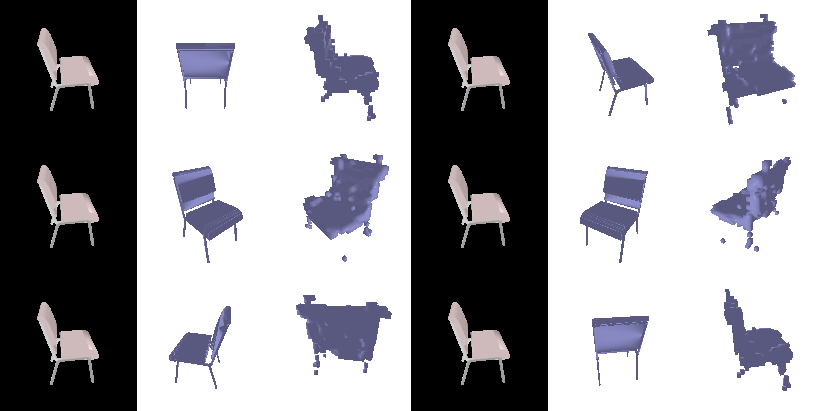
The result has a worse F1 score and a worse result compared to the methods I tried in part 2, I think 2 main factors caused this result:
- I trained the implicit network with
--load_feat, while the other models were trained without. Because of this, only implicit network was trained with frozen ImageNet features that doesn't describe 3D shape well. - The same as the voxel problem, a result of a meshgrid sized 32x32x32 cannot describe thin features like chair legs well. For the implicit network, the leg positions become more uncertain so that it can lead to empty result being produced (refer to the first example shown above).