
In this view, the chair appears as several low, flattened layers. The point cloud has a less distinct seat and leg silhouette than the correctly classified chairs above, which may contribute to the lamp prediction.
16-825 Learning for 3D Vision · Assignment 5
Test accuracy 97.59% across 953 objects, with 1,024 points per object. Shared pointwise layers encode XYZ coordinates, and max pooling combines them into a single descriptor for classification. Training used Adam at 0.001 with batch size 16 for 250 epochs. The training script selects checkpoints using the highest recorded test accuracy.


In this view, the chair appears as several low, flattened layers. The point cloud has a less distinct seat and leg silhouette than the correctly classified chairs above, which may contribute to the lamp prediction.

The vase has a broad body that narrows into a smaller rounded section. That profile can resemble a lamp with a shade and base, which offers one explanation for the confusion.

A large round volume and a smaller rounded base dominate the lamp silhouette. Where the connection is sparse, the rounded surfaces can resemble the profile of a vase.
The confusion matrix shows 11 vase-to-lamp and 11 lamp-to-vase mistakes, accounting for 22 of the 23 errors.

Test point accuracy 90.57% across 617 chairs with 1,024 points each. PointNet combines each point's features with the global max-pooled descriptor, then predicts one of six labels per point. Training used 250 epochs with the same Adam settings as Q1. Gray, magenta, cyan, yellow, blue, and red correspond to label IDs 0 through 5.

The prediction assigns blue to a large region on the left that is yellow in the ground truth. The lower cyan region remains partly aligned, but the large changed region drives down point accuracy.
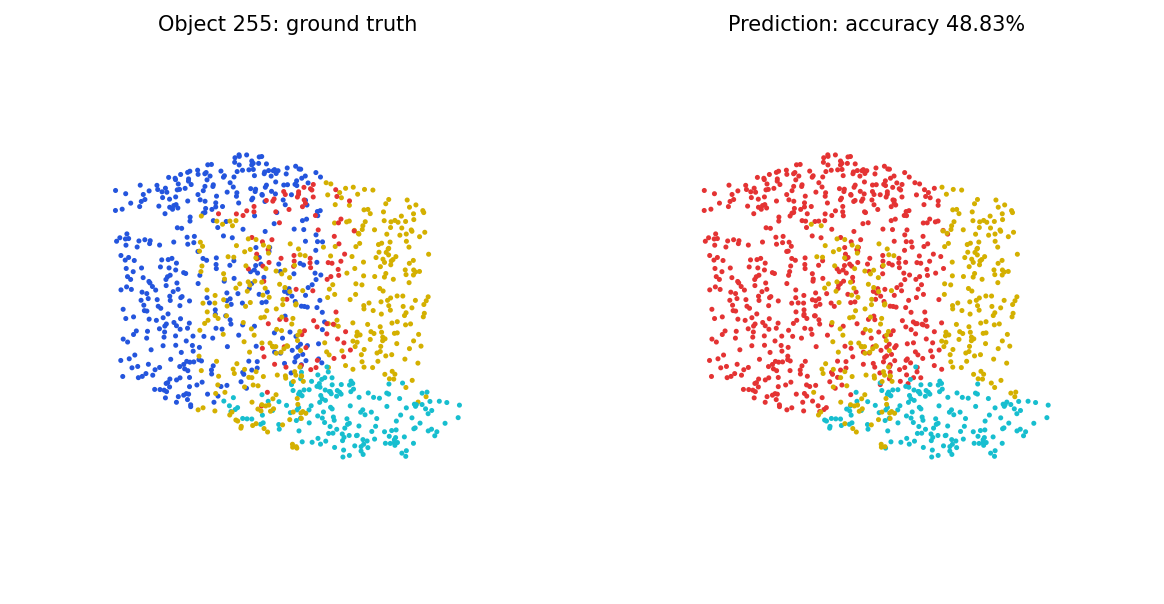
Much of the blue region on the left is predicted as red. The cyan lower section and parts of the yellow right section remain recognizable, so the largest disagreement is concentrated on one side.

The cyan lower region and much of the red center agree with the ground truth. Visible disagreements remain where the blue, red, and yellow regions meet, particularly along the left edge.

The blue extended structures, red center, and cyan base closely match the ground truth. The small remaining differences appear near the boundaries between these regions.
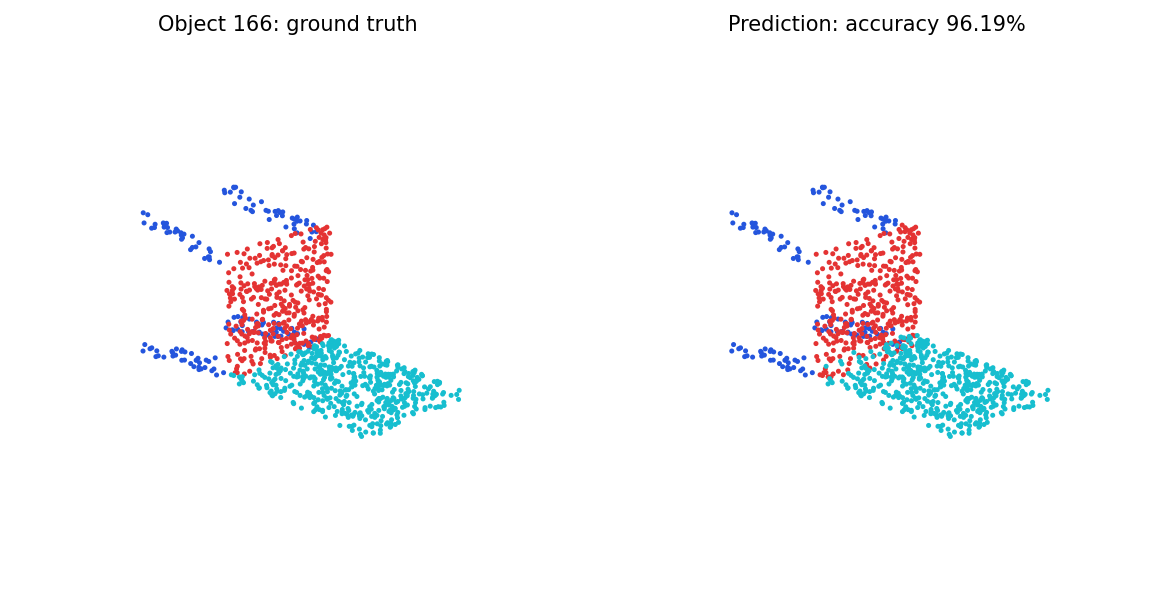
The extended blue structures and the cyan lower region are largely recovered. The most visible differences occur around the transition from red to cyan near the center.
The Q1 and Q2 checkpoints are reused without retraining. Each condition is evaluated using three point subsets with seeds 0, 1, and 2. The tables report mean accuracy, standard deviation, and the change from the three-run baseline in percentage points (pp). Q1 and Q2 report the seed-0 baseline, which explains the small differences from the Q3 baseline means.
Rotate the same 1,024 sampled points about y at 0, 30, 60, 90, and 180 degrees. Preserve each point-to-label correspondence.
| Angle | Classification | Change (pp) | Segmentation | Change (pp) |
|---|---|---|---|---|
| 0° | 97.13% ± 0.35 pp | +0.00 | 90.54% ± 0.02 pp | +0.00 |
| 30° | 88.74% ± 0.18 pp | -8.39 | 79.88% ± 0.04 pp | -10.67 |
| 60° | 75.69% ± 0.50 pp | -21.44 | 66.64% ± 0.01 pp | -23.90 |
| 90° | 68.63% ± 0.31 pp | -28.51 | 58.19% ± 0.10 pp | -32.35 |
| 180° | 31.34% ± 0.18 pp | -65.79 | 63.96% ± 0.05 pp | -26.58 |
Classification accuracy falls by 65.79 pp at 180 degrees. Segmentation drops most at 90 degrees (32.35 pp) and partially recovers at 180 degrees. The results suggest the models use orientation cues in the XYZ coordinates. At 90 degrees, chair 487 changes from a correct prediction to lamp, while chair 606 remains correctly classified. All three illustrated segmentation examples lose accuracy.


Subsample 128, 256, 512, or 1,024 points without replacement from each unrotated cloud. Within a seed, smaller subsets are nested inside larger ones. Score segmentation using labels of the selected points.
| Points | Classification | Change (pp) | Segmentation | Change (pp) |
|---|---|---|---|---|
| 128 | 95.98% ± 0.32 pp | -1.15 | 87.10% ± 0.15 pp | -3.45 |
| 256 | 96.40% ± 0.35 pp | -0.73 | 89.43% ± 0.14 pp | -1.12 |
| 512 | 97.31% ± 0.26 pp | +0.17 | 90.40% ± 0.04 pp | -0.15 |
| 1,024 | 97.13% ± 0.35 pp | +0.00 | 90.54% ± 0.02 pp | +0.00 |
At 128 points, classification loses 1.15 pp and segmentation loses 3.45 pp. All three illustrated classification examples retain their original class even at 128 points. The aggregate segmentation drop is consistent with thin structures and boundaries receiving fewer samples. A particular object can still score higher because the smaller sample changes which points are scored.


PointNet++ uses single-scale grouping. Farthest-point sampling selects 256 centers at the first level and 64 at the second. Each level groups up to 32 neighbors within radii of 0.2 and 0.4 coordinate units, respectively. Shared layers encode features from center-relative coordinates and max pooling summarizes the neighborhood. Classification uses the final global feature. Segmentation uses inverse-distance interpolation and skip features to recover predictions at the input points.
PointNet++ was trained for 150 epochs per task with Adam at 0.001 and batch size 16. The two architectures were evaluated on identical sets of 1,024 points per object. The baseline used 250 epochs, so the measured differences reflect both architecture and training schedule.
| Task | PointNet | PointNet++ SSG | Change (pp) |
|---|---|---|---|
| Classification | 97.59% | 98.22% | +0.63 |
| Segmentation | 90.57% | 91.13% | +0.55 |
PointNet++ improves both aggregate scores. Object 290 switches from correct to incorrect in classification. For segmentation, chair 238 drops from 63.18% to 35.55%, while chairs 391 and 166 improve. The examples show how the modest average gains vary by object.


