Assignment 4: Multi-View Transformers
1. Multi-View Data Preprocessing
1.2 Unprojection (original world frame, meters)
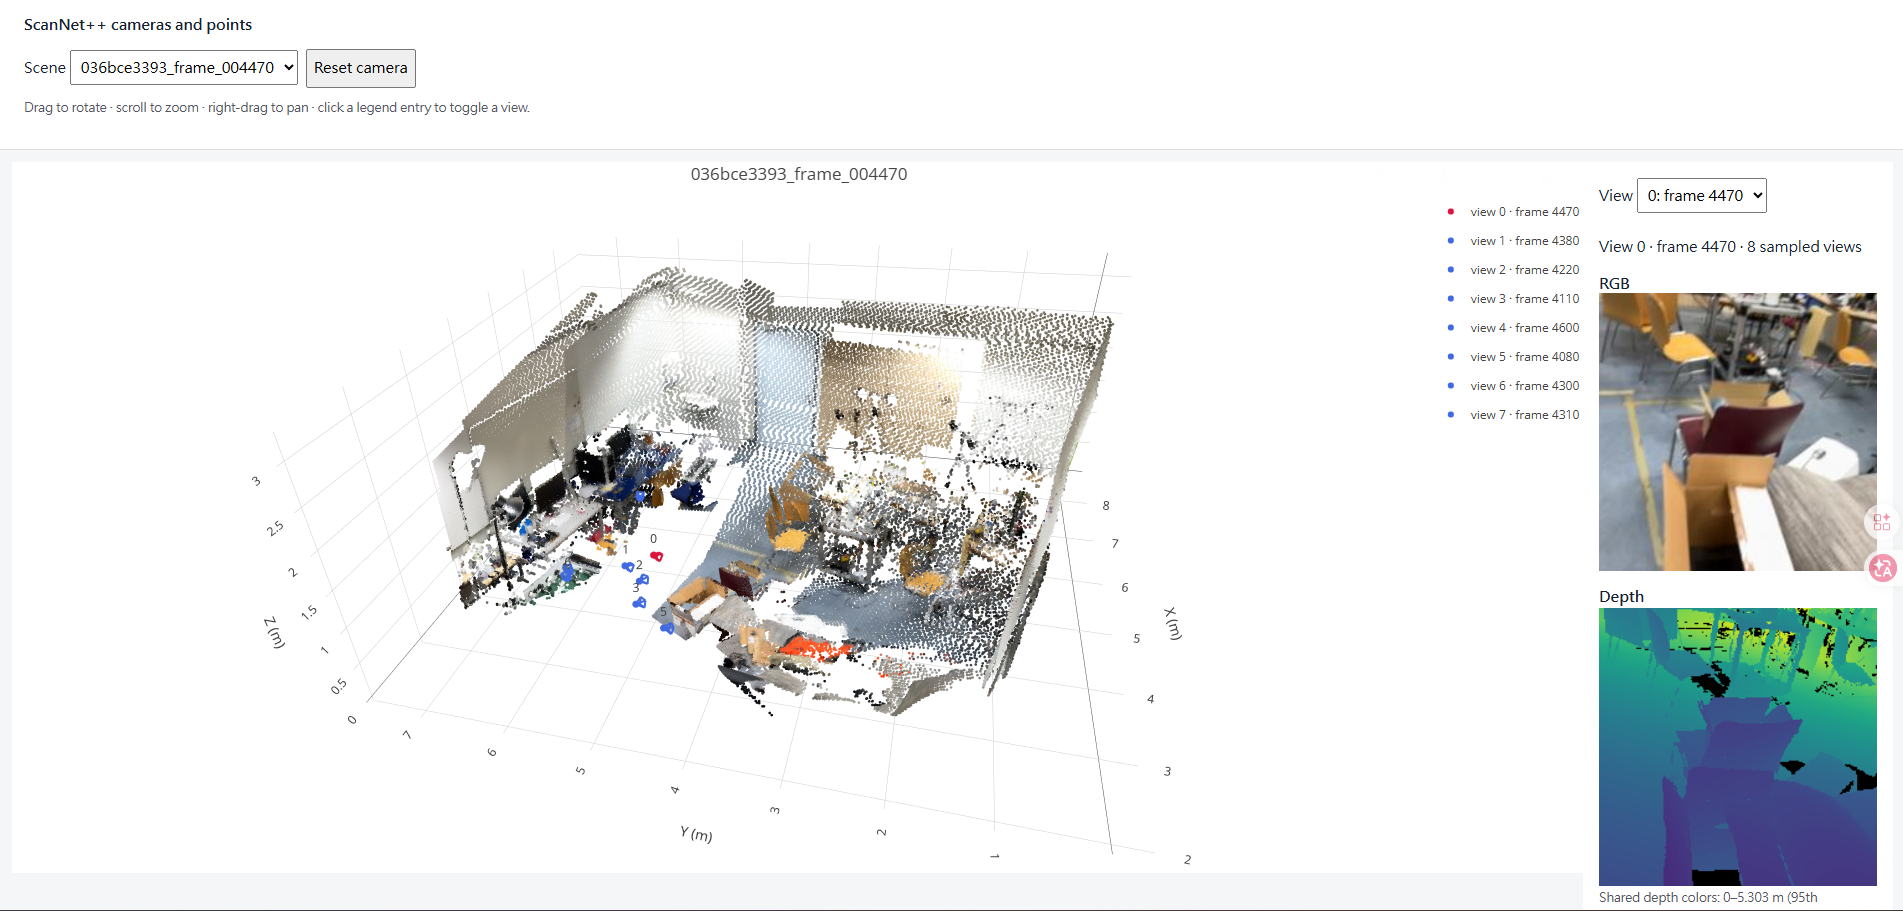
1.3 Canonicalization
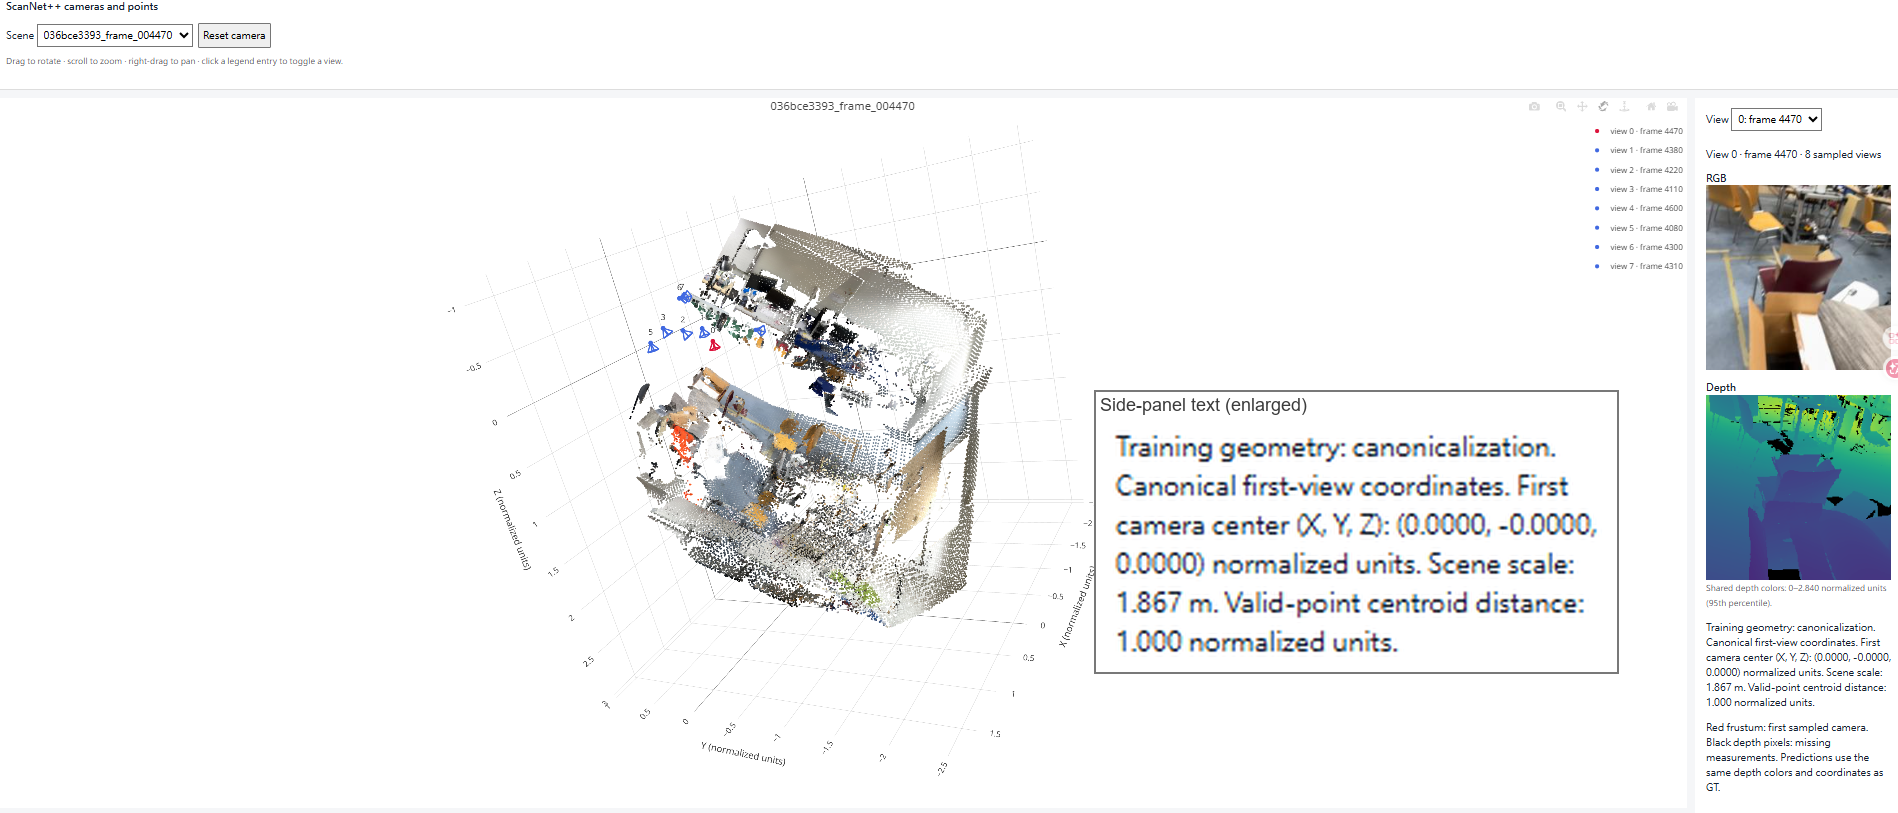
1.7 check_data.py output
| Sample | Views | Res. | Valid depth | Max point reproj. (px) | Max ray reproj. (px) | Centroid dist. |
|---|---|---|---|---|---|---|
| e050c15a8d_frame_007080 | 8 | 224 | 0.978 | 1.13e-4 | 1.09e-4 | 1.0000 |
| 5f99900f09_frame_002820 | 8 | 224 | 0.990 | 1.23e-4 | 1.11e-4 | 1.0000 |
| 47b37eb6f9_frame_002720 | 8 | 224 | 0.961 | 9.88e-5 | 8.90e-5 | 1.0000 |
| 4c5c60fa76_frame_006690 | 8 | 224 | 0.752 | 1.16e-4 | 1.07e-4 | 1.0000 |
Batch shapes (B=2, V=8): rgb (2,8,3,224,224), depth (2,8,1,224,224),
K (2,8,3,3), T_world_from_camera (2,8,4,4), points_world (2,8,3,224,224),
ray_origins/ray_directions (2,8,3,224,224), plucker (2,8,6,224,224),
scene_scale (2). Reprojection errors are about 1e-4 px (threshold 0.01 px) and the centroid distance is 1.
Explanations
Canonicalization. Every training sample is re-expressed in the coordinate frame of its first camera:
each pose becomes T_i' = T_0-1 T_i, so camera 0 is the identity. The scene is then divided by one
shared scale, the distance from the origin to the centroid of all valid points, applied to translations, depth and points
(rotations are unchanged and the centroid is not subtracted). This removes the arbitrary world origin, orientation and metric
unit of each scan, so every sample has the same conventions and a similar size, and the model only has to
predict geometry relative to the first view.
World-space ray directions. For pixel (u,v) the camera-space direction is
K-1[u,v,1]T (the point at z = 1). Rotating it by the camera-to-world rotation
R and normalizing gives a unit direction in the canonical world frame; the ray origin is the camera center
(the pose translation). Unlike unprojection, no depth is used, so a ray describes only where a pixel looks, which is why
it is available for a target view whose depth is unknown.
Plücker moment. A ray is encoded as [d, m] with m = o × d. Because d is a unit
vector, |m| is the distance from the world origin to the line, and m is the same for any point
o chosen on the ray (moving o by t d adds t (d × d) = 0). The six numbers
therefore identify a 3D line uniquely and vary smoothly, which makes them a convenient per-pixel camera encoding.
2. Novel-View Synthesis with Mini-LVSM
2.1 Overfitting
| Final overfit result | PSNR (dB) | SSIM |
|---|---|---|
| Validation on the fixed batch | 30.98 | 0.872 |
The training PSNR of 25.40 dB is the average over all 2000 steps, which includes the early steps from random initialization.

val_epoch000.png: source views, ground truth, prediction (left to right).2.2 Training and evaluation
Training settings. Mini-LVSM, 14.6M parameters: patch size 8, width 384, 8 transformer layers, head dim 64, MLP ratio 4, QK-norm. 8 views per sample at 224×224, of which 2 are sources and 6 are targets; batch size 4 scenes, 56 steps per epoch, 100 epochs (5,600 steps). AdamW, lr 2e-4, weight decay 0.05, betas (0.9, 0.95), 200 warmup steps then cosine decay to 10%, gradient clipping 1.0, bfloat16 autocast, MSE loss, seed 825. About 28 s per epoch (≈47 min).
Ablation: number of source views × target-ray conditioning (validation)
| Source views | Conditioning | PSNR (dB) | SSIM | #target images |
|---|---|---|---|---|
| 1 | correct | 15.20 | 0.558 | 196 |
| 1 | shuffled | 11.79 | 0.487 | 196 |
| 1 | none | 12.46 | 0.530 | 196 |
| 2 | correct | 16.15 | 0.560 | 168 |
| 2 | shuffled | 11.48 | 0.472 | 168 |
| 2 | none | 12.43 | 0.528 | 168 |
| 4 | correct | 16.90 | 0.575 | 112 |
| 4 | shuffled | 11.58 | 0.472 | 112 |
| 4 | none | 12.46 | 0.538 | 112 |
correct: true target rays; shuffled: rays of a different target view; none: all-zero rays.
With a fixed 8 views per sample, more source views leave fewer target images, so the three source settings are averaged over different target sets.
Visualizations
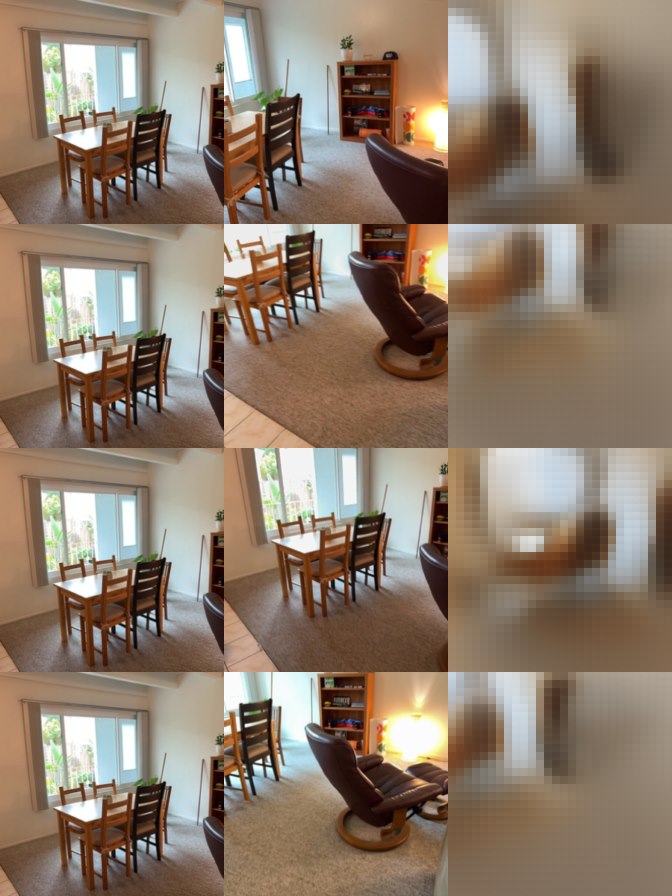
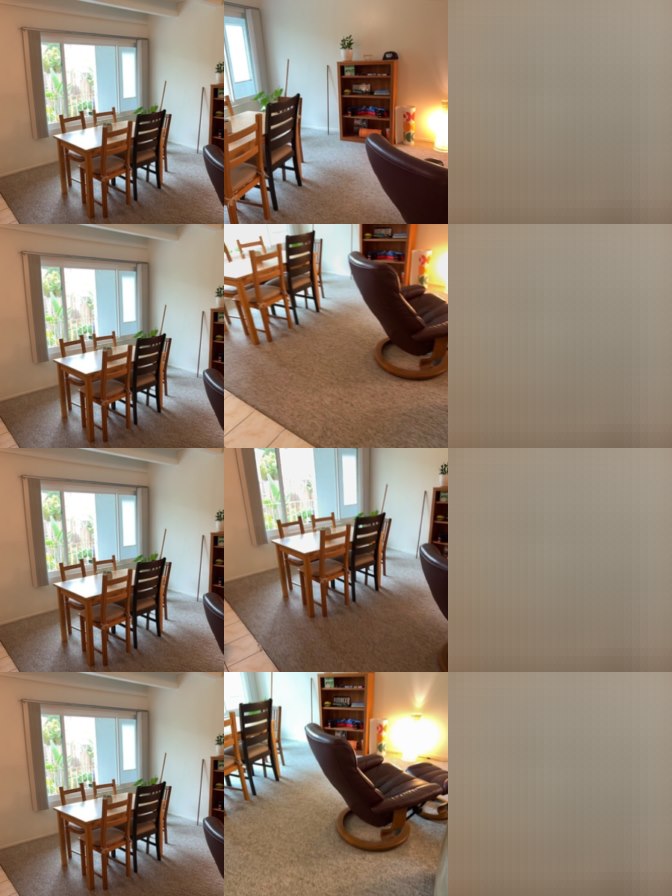
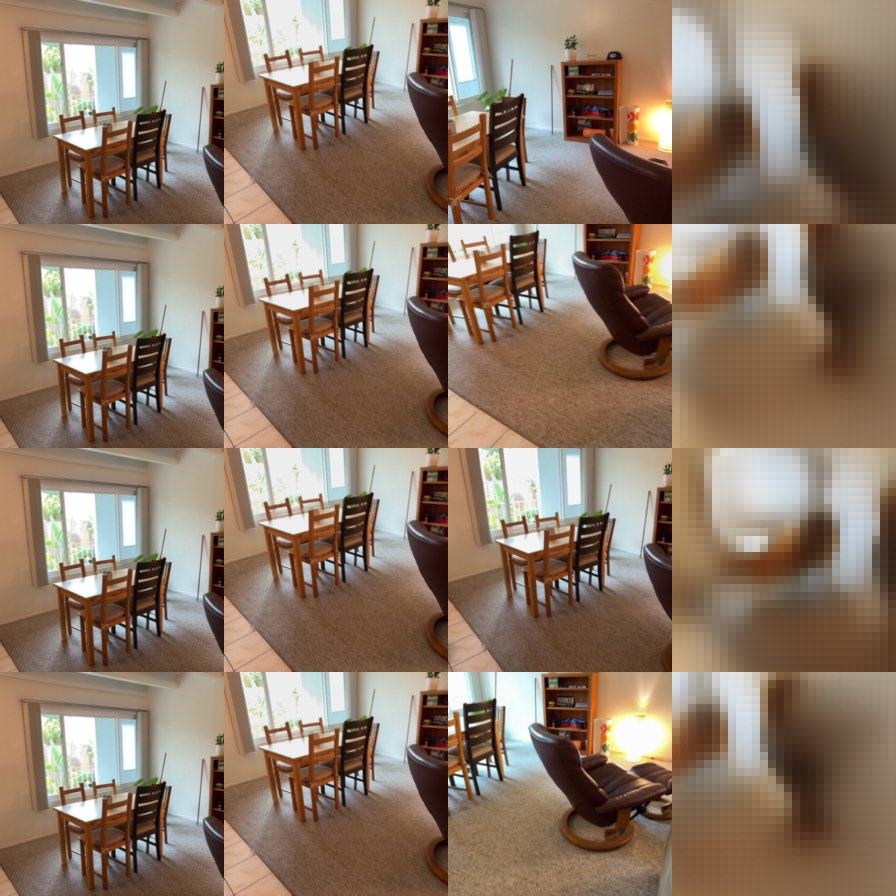
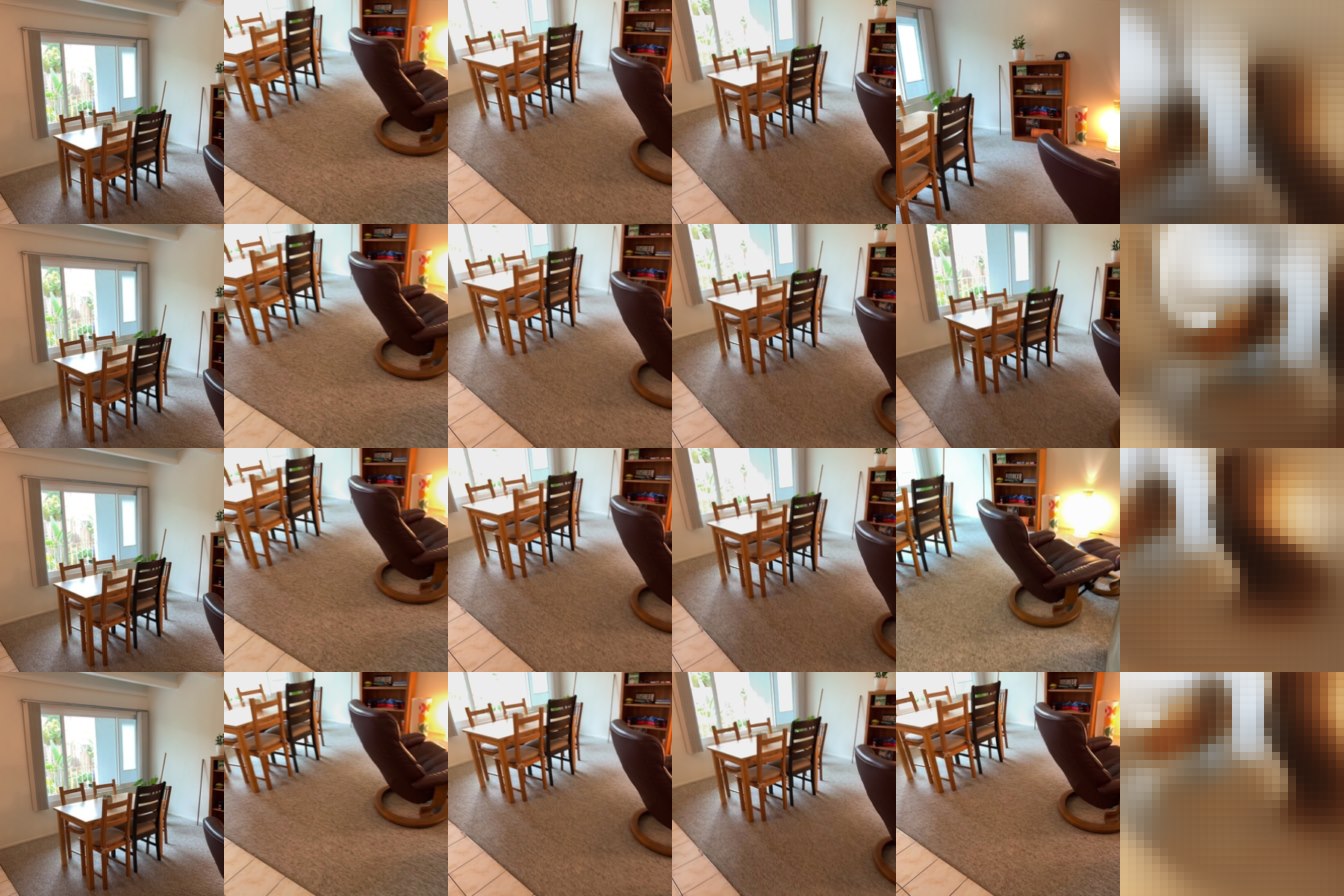
Training visualizations on validation data. Each row is one target view; columns are the source views, the ground truth, then the prediction.


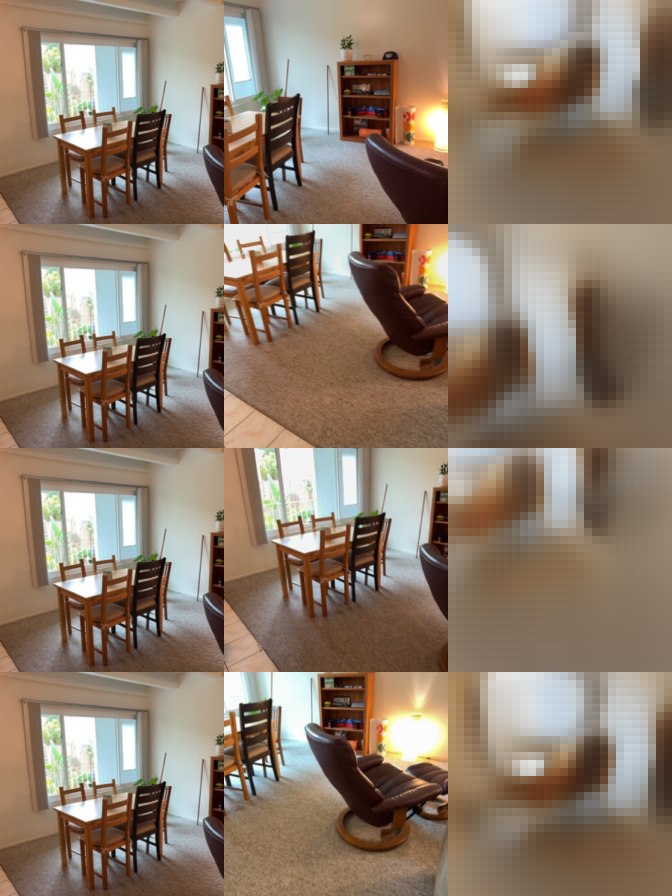
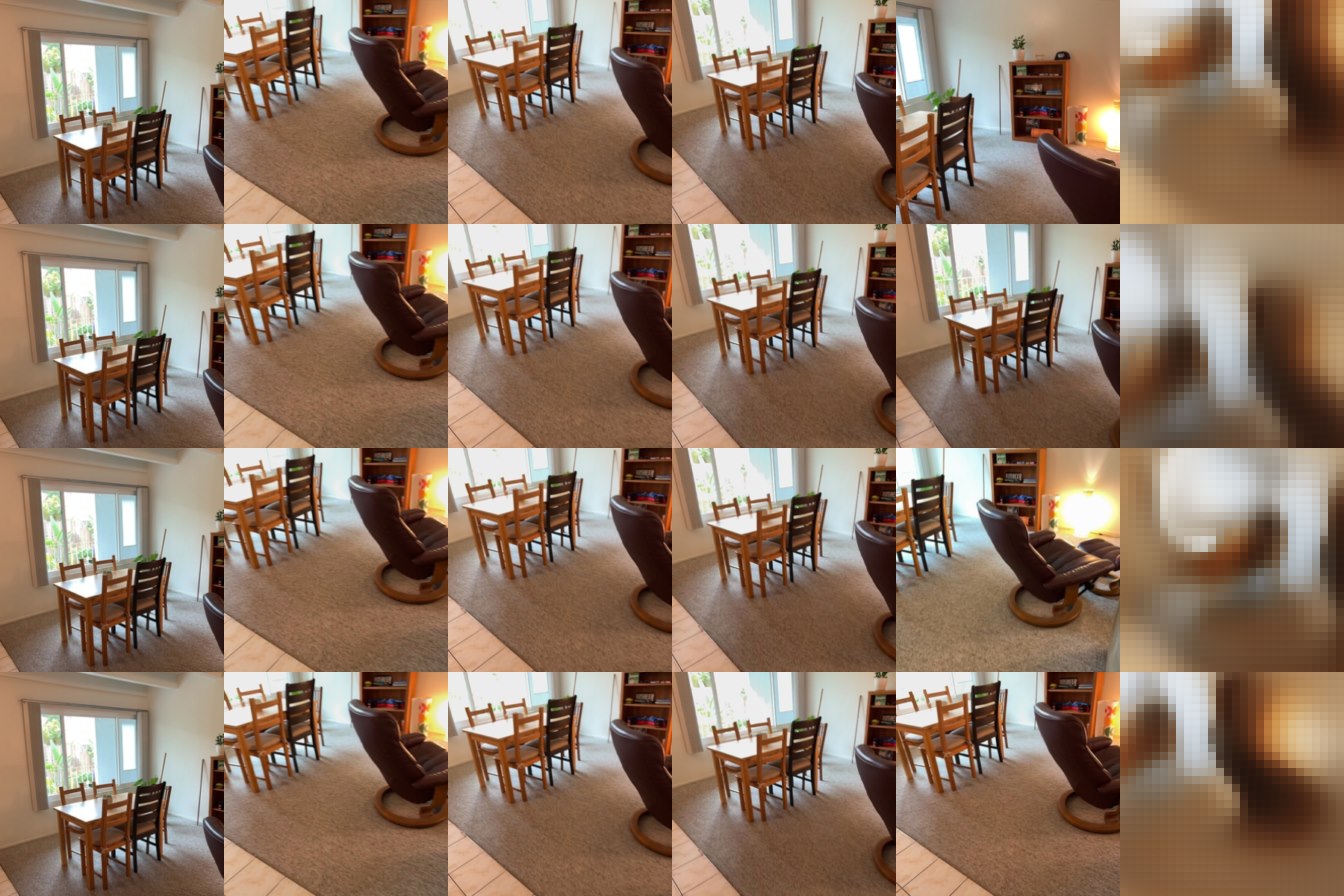
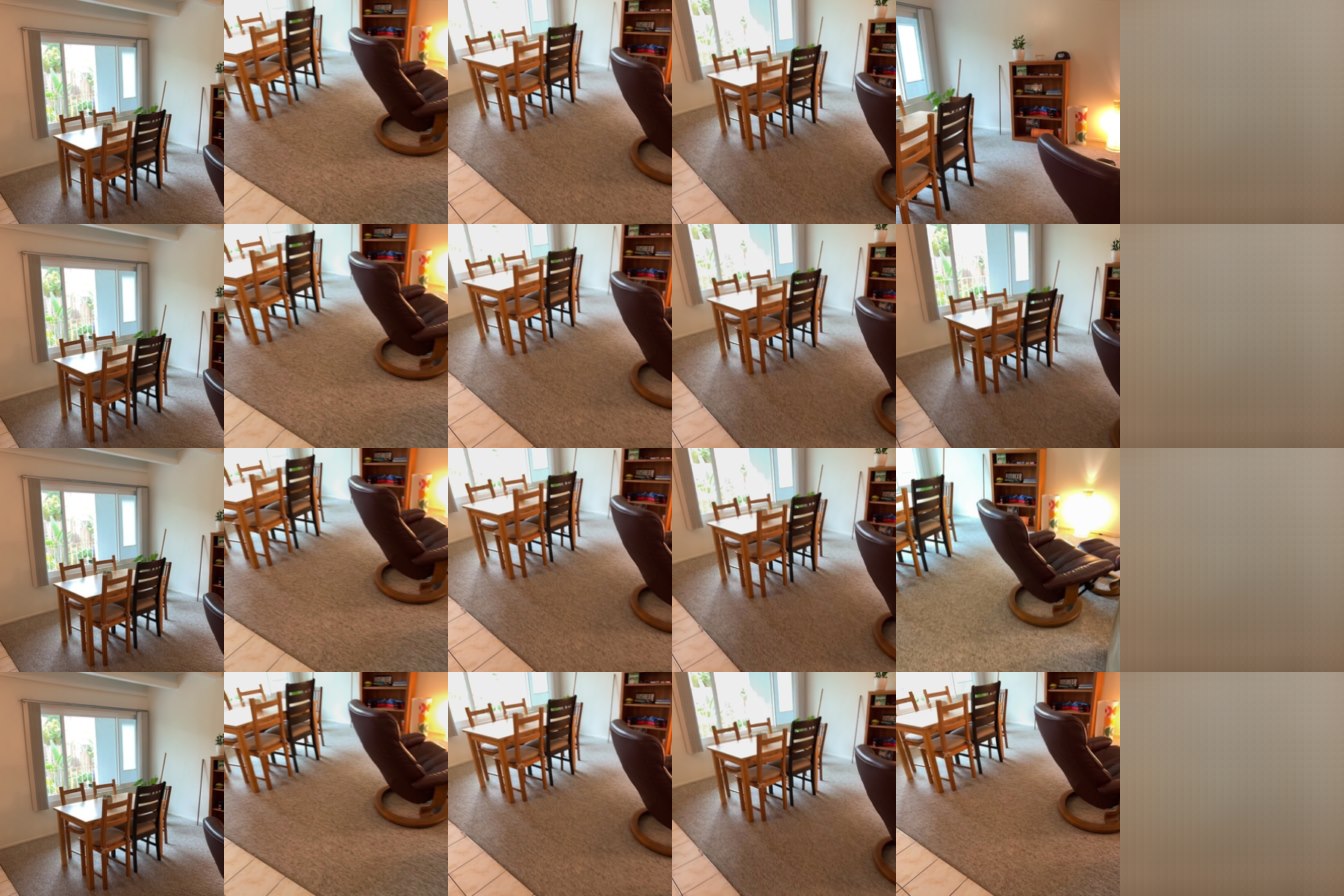
Evaluation visualizations of the best checkpoint (rows: targets; columns: sources, ground truth, prediction).
Discussion
- Number of source views. With correct rays, PSNR rises from 15.20 dB (1 source) to 16.15 dB (2) and 16.90 dB (4), and SSIM from 0.558 to 0.575. The gain is steady but modest, and it appears for 1 and 4 sources even though training always used 2, so the model can use whatever number of sources it is given. More sources cover more of the scene that a target may see. The set of target images differs between settings (196/168/112), so these differences are indicative rather than strictly paired.
- Ray conditioning. Correct rays are clearly best (16.15 dB at 2 sources) against 12.43 dB with no rays and 11.48 dB with shuffled rays. The target rays are the only information about which viewpoint to render, so the model relies on them. Shuffled rays are worse than no rays because they point to a wrong, but confident, viewpoint, while zero rays only remove information. The SSIM gap is smaller (0.560 vs 0.528 for no rays), which suggests that predictions have limited structure even with correct rays.
- Quality and limitations. In the visualizations the predictions are blurry and show the 8×8 patch grid; they capture the coarse colors and layout (window, carpet, furniture) but not fine detail. The overfit run reaches 31 dB on one fixed batch while held-out validation reaches 16–17 dB, so the model is far from its capacity on training data but generalizes weakly. Likely reasons are the small training set (224 scenes), the short schedule (5,600 steps), a deterministic MSE objective that favors blurry averages, and a small 14.6M-parameter model. We did not run experiments isolating these factors.
2.3 Bonus: Analysis and Exploration
Question. Does adding an SSIM term to the MSE loss improve SSIM, PSNR and visual sharpness of the synthesized views?
Setup. Same model, data, schedule and seed as the Q2.2 baseline; only the loss changes from MSE to
MSE + 0.1 · (1 − SSIM) (SSIM averaged over all target images, enabled with LVSM_LOSS=mse_ssim).
Both runs are evaluated on the validation split (28 scenes) at the checkpoint with the highest validation PSNR (the selection rule of the training script), with the same source-view and ray-conditioning ablation as in Q2.2.
The first table is the training configuration (2 source views, correct rays). Each setting was trained once.
| Loss | Val PSNR (dB) | Val SSIM | Best epoch | Seconds / epoch |
|---|---|---|---|---|
| MSE (baseline) | 16.15 | 0.560 | 99 | 27.9 |
| MSE + 0.1 · (1 − SSIM) | 15.53 | 0.577 | 96 | 28.4 |
| Difference | −0.62 | +0.017 | +0.5 |
Epochs are counted from 0. Because the best checkpoint is chosen by validation PSNR, the PSNR of the SSIM run is not penalized by the selection; the validation loss of the two runs is not comparable because it includes the SSIM term in one run.
| Source views | Conditioning | MSE PSNR | MSE SSIM | MSE+SSIM PSNR | MSE+SSIM SSIM | Δ PSNR | Δ SSIM |
|---|---|---|---|---|---|---|---|
| 1 | correct | 15.20 | 0.558 | 14.87 | 0.575 | −0.34 | +0.017 |
| 1 | shuffled | 11.79 | 0.487 | 11.87 | 0.513 | +0.07 | +0.027 |
| 1 | none | 12.46 | 0.530 | 12.41 | 0.544 | −0.05 | +0.014 |
| 2 | correct | 16.15 | 0.560 | 15.53 | 0.577 | −0.62 | +0.017 |
| 2 | shuffled | 11.48 | 0.472 | 11.66 | 0.506 | +0.18 | +0.034 |
| 2 | none | 12.43 | 0.528 | 12.39 | 0.540 | −0.05 | +0.012 |
| 4 | correct | 16.90 | 0.575 | 15.94 | 0.591 | −0.95 | +0.016 |
| 4 | shuffled | 11.58 | 0.472 | 11.81 | 0.513 | +0.23 | +0.041 |
| 4 | none | 12.46 | 0.538 | 12.42 | 0.550 | −0.03 | +0.011 |

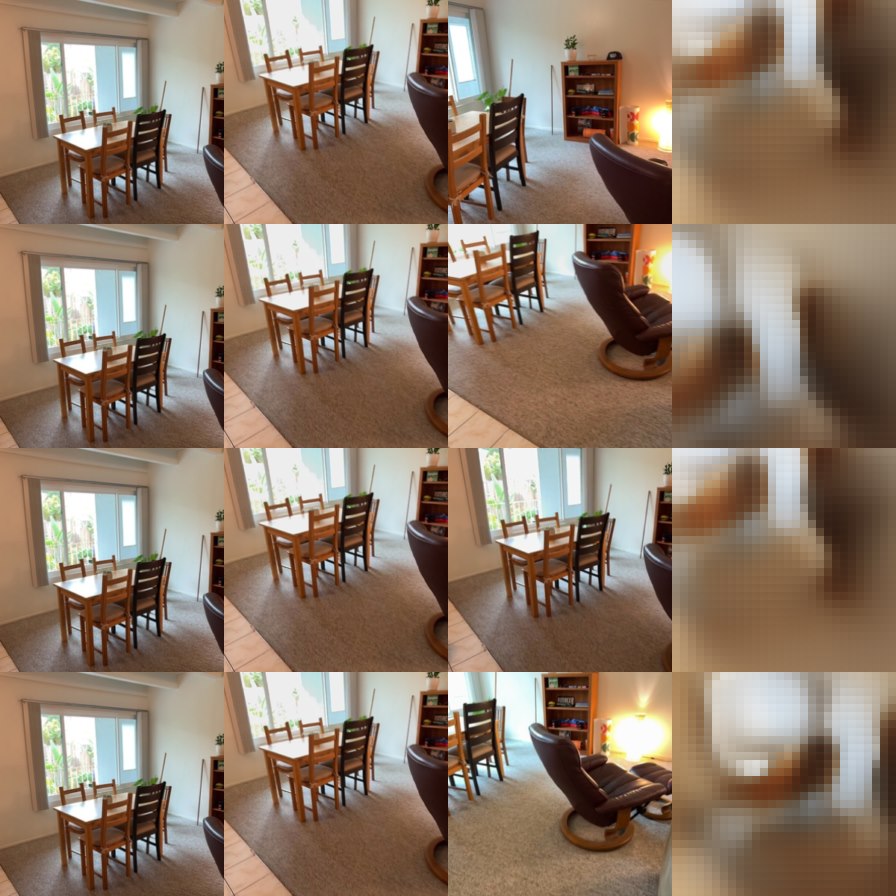
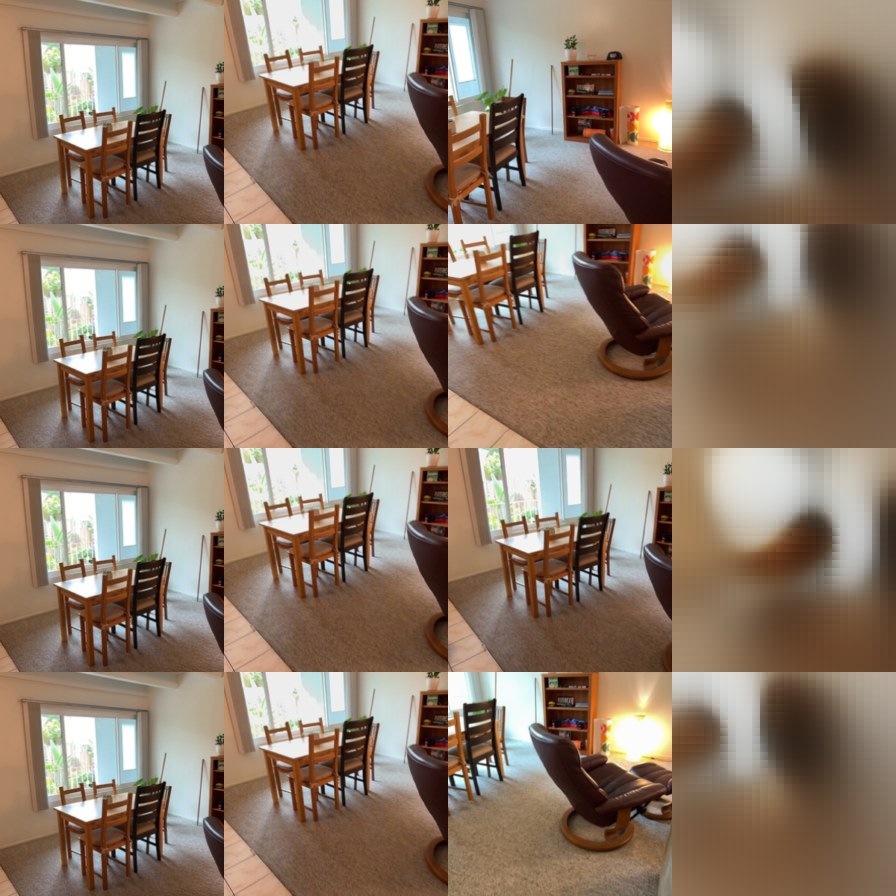
Evaluation visualizations of the best checkpoints (2 source views, correct rays; rows: targets; columns: two sources, ground truth, prediction).
Discussion
- SSIM improves, PSNR drops. Adding the SSIM term raises validation SSIM from 0.560 to 0.577 (+0.017) and lowers PSNR from 16.15 to 15.53 dB (−0.62 dB). This is the expected trade-off: the loss now partly optimizes structural similarity instead of only the pixel-wise squared error that PSNR measures.
- The SSIM gain is consistent, the PSNR loss is not. Across all 9 ablation settings, SSIM is higher with the SSIM term (+0.011 to +0.041). PSNR, however, drops only for correct rays (−0.34, −0.62 and −0.95 dB for 1, 2 and 4 sources) and is almost unchanged without rays (−0.03 to −0.05 dB) or slightly higher with shuffled rays (+0.07 to +0.23 dB). The PSNR cost is therefore concentrated in the setting where the model actually renders the right view.
- Source views and ray conditioning. With the SSIM term, more source views still help (PSNR 14.87 → 15.53 → 15.94 dB, SSIM 0.575 → 0.577 → 0.591 for 1, 2, 4 sources), but the PSNR gain from 1 to 4 sources is smaller than for MSE (+1.07 vs +1.70 dB); the SSIM gain is similar (+0.016 vs +0.017). Correct rays remain clearly best for both losses, so the conclusion of Q2.2 about the importance of target rays is unchanged.
- Early training. The SSIM advantage is largest at the start (0.515 vs 0.384 at epoch 0) and settles to about 0.01–0.02 later. The PSNR gap is small at epoch 0 (0.07 dB), peaks around epoch 25 (about 1.0 dB) and narrows to about 0.6 dB at the end, so the two curves are still converging slowly rather than having crossed.
- Visual quality. In the epoch-95 and evaluation visualizations both predictions are blurry and neither recovers fine detail. The MSE+SSIM prediction looks slightly smoother, with a weaker visible 8×8 patch grid, whereas the MSE prediction shows more blocky patch boundaries; we do not see a clear gain in sharpness. This is a visual impression from the four targets of one validation scene, not a measurement.
- Cost. The SSIM term adds only about 0.5 s per epoch (28.4 vs 27.9 s).
- Limitations. One run per setting and one SSIM weight (0.1), which we did not tune, so the differences, especially the small SSIM gain, may be within run-to-run variation; a smaller weight might keep more of the PSNR. I evaluated only on the validation split. The visual comparison shows one setting (2 source views, correct rays) on a single scene.
3. Multi-View Geometry with Mini-VGGT
3.1 Overfitting

| Epoch 40, fixed clip | Depth AbsRel | Depth δ1 | Rot. error | Trans. error | Pose AUC@5 | Pose AUC@15 |
|---|---|---|---|---|---|---|
| Overfit | 0.036 | 0.956 | 0.26° | 0.54° | 0.957 | 0.983 |
3.2 Training and evaluation
Training settings. Frozen DINOv2 ViT-B/14 encoder, 8 frame/global attention pairs (16 blocks), width 384, 6 heads; camera head with cross-view blocks and a depth head with RGB refinement.
8 views per sample at 224×224, sampling range 32, batch size 16 (14 steps per epoch), 1000 epochs (≈14k steps).
AdamW, lr 6e-4, weight decay 0.01, 10 warmup epochs then cosine decay to 5%, loss weights camera 5.0 and depth 1.0, bfloat16, 4 data workers, seed 825.
About 21 s per epoch (≈6 h on one A10G). best.pt is the checkpoint with the lowest validation loss.

Evaluation: 8 views from the first 32 prepared frames, 224 px, seed 825, full splits (28 scenes each).
| Metric | Validation | Test |
|---|---|---|
| Depth AbsRel (lower is better) | 0.149 | 0.164 |
| Depth δ1 | 0.815 | 0.793 |
| Rotation AUC @5° / 15° / 30° | 0.189 / 0.499 / 0.694 | 0.203 / 0.523 / 0.720 |
| Translation AUC @5° / 15° / 30° | 0.017 / 0.081 / 0.191 | 0.007 / 0.060 / 0.172 |
| Joint pose AUC @5° / 15° / 30° | 0.001 / 0.059 / 0.167 | 0.001 / 0.041 / 0.155 |
| Mean rotation error | 12.2° | 9.8° |
| Mean translation-direction error | 41.8° | 41.0° |
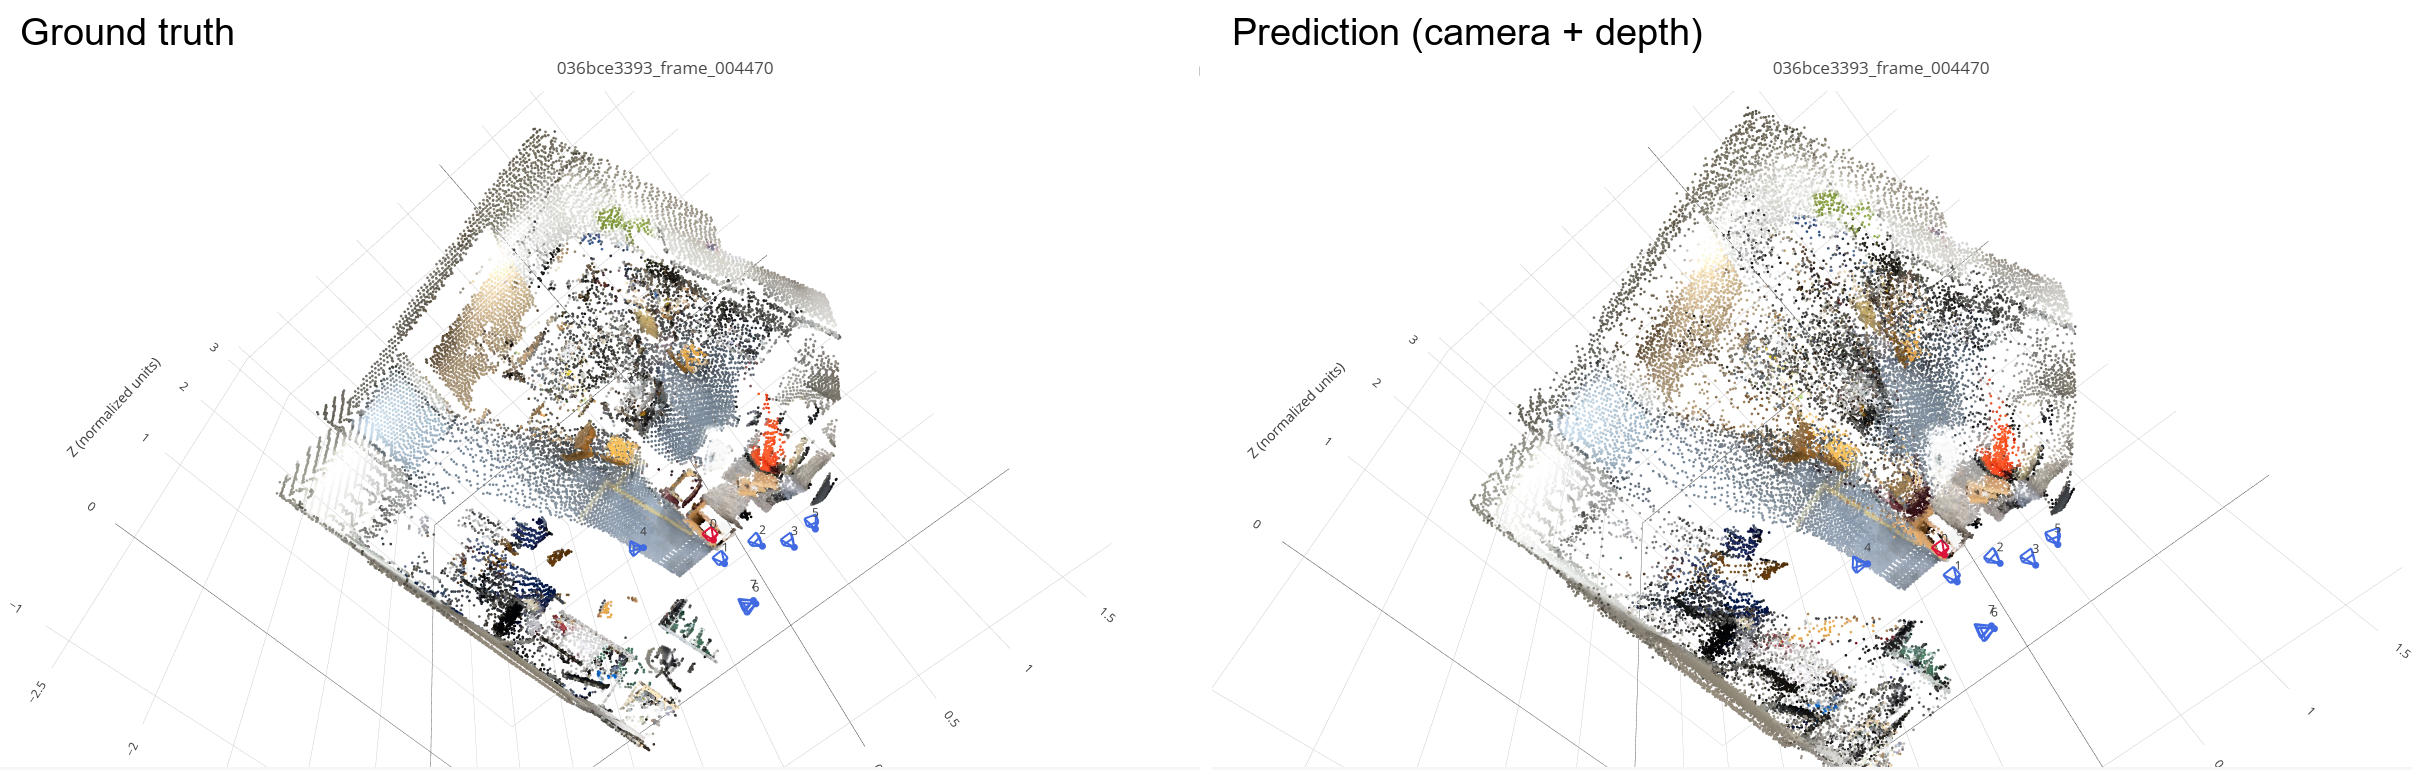
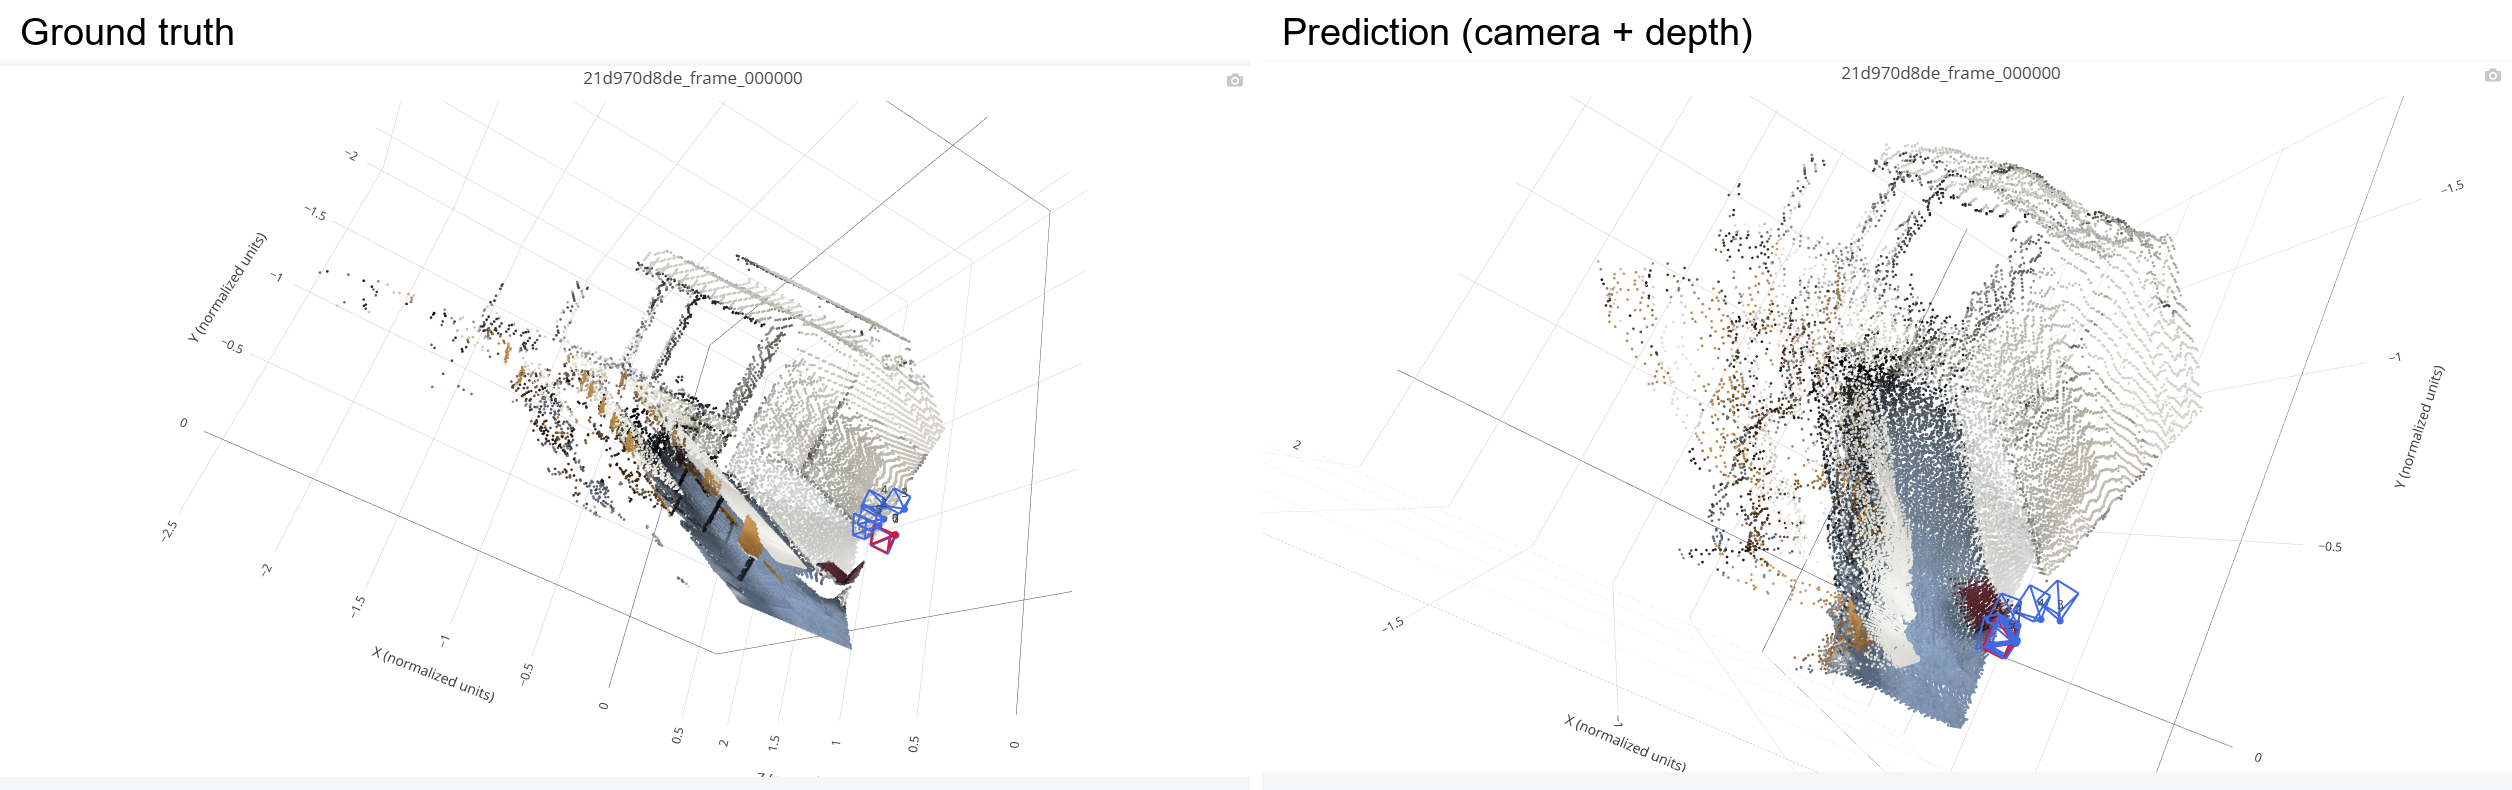
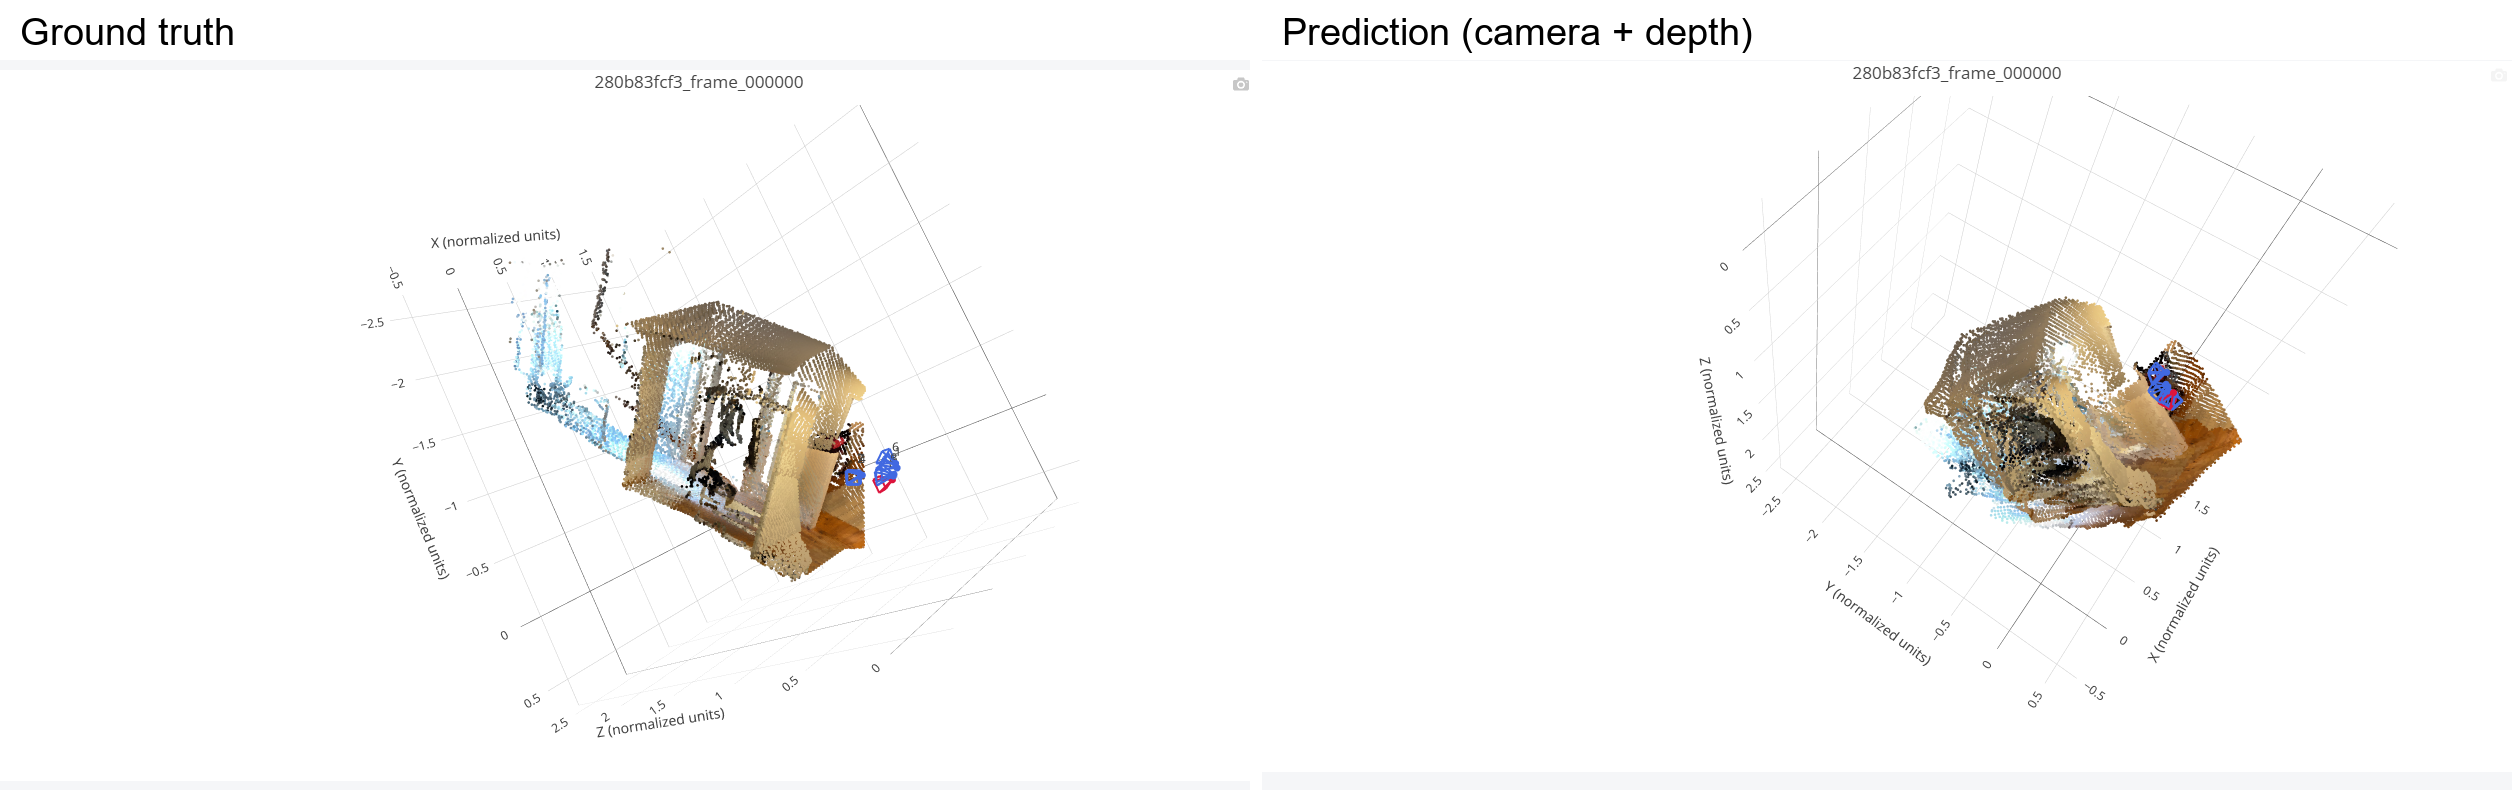
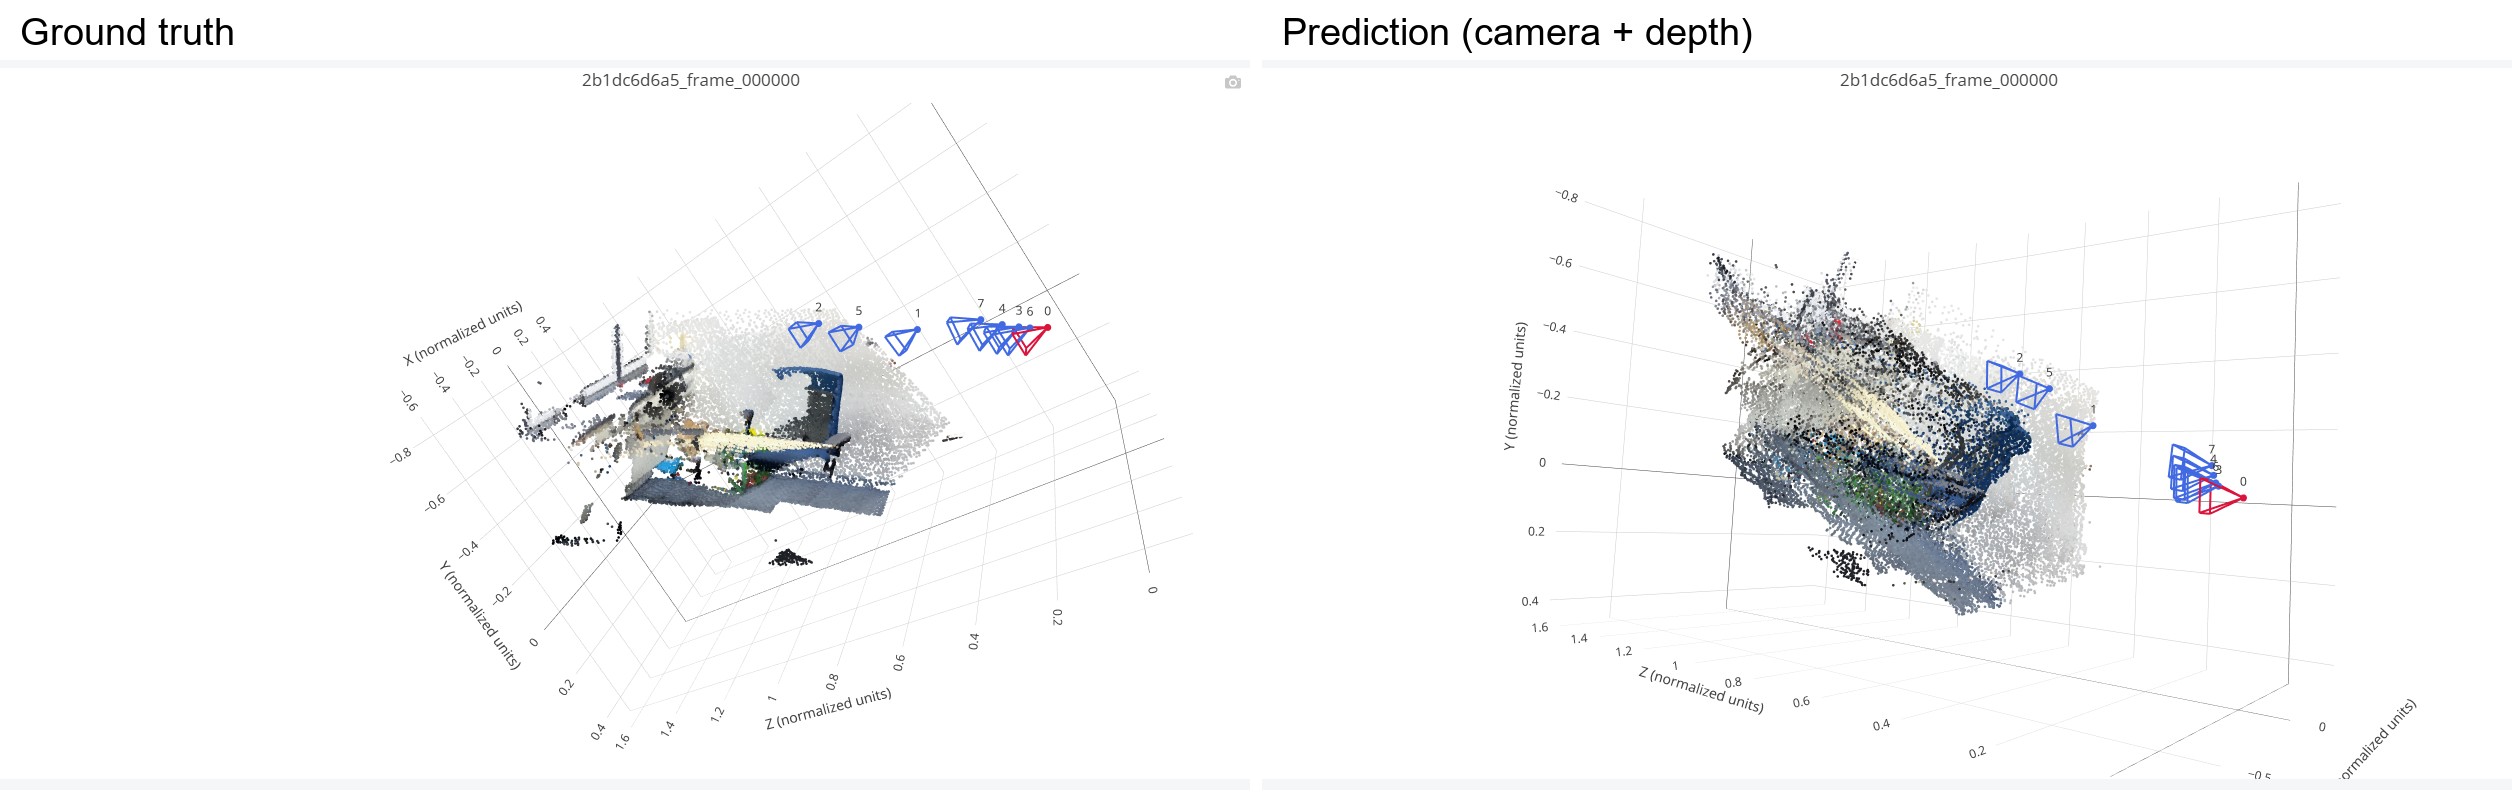
GT vs. predicted geometry (four validation scenes)
Left: ground truth; right: predicted cameras and depth (frozen-DINO baseline, best.pt). Camera 0 is red. The two panels were captured in the interactive viewer and their viewing angles are not identical.

Discussion
- Held-out depth. Depth transfers reasonably: AbsRel 0.149 on validation and 0.164 on test, with δ1 of 0.815 and 0.793. This is clearly worse than the overfit clip (AbsRel 0.036), so the depth head does not reach that accuracy on unseen scenes.
- Held-out cameras. Rotation is much better than translation. Rotation AUC reaches 0.69/0.72 at 30° (mean error 12.2°/9.8°), but translation-direction AUC is only 0.19/0.17 at 30° (mean error about 41°). The joint pose AUC is limited by the weaker translation, giving only 0.167/0.155 at 30° and close to zero at 5°. Camera pose is the main failure on held-out scenes.
- Possible reasons. Frames come from a 32-frame window of a video, so many view pairs have short baselines, for which the translation direction is poorly determined and sensitive to small errors. The training set is also small (224 scenes).
The loss curves have not fully flattened by epoch 1000 (the camera loss is still decreasing), so longer training could help; we did not test this. Test results are close to validation results, so there is no sign that selecting
best.pton validation overfit to it.
3.3 Bonus: Analysis and Exploration
Question. How does the number of input views affect Mini-VGGT's accuracy and cost at evaluation time?
Setup. We evaluate the single baseline checkpoint from Q3.2 (best.pt, trained with 8 views and a frozen DINOv2) on the full test split (28 scenes) with
--num-views set to 2, 4, 8 and 16, and nothing else changed (batch size 4, seed 825, 224 px, one NVIDIA A10G).
Views are the reference frame 0 plus the first V−1 frames of a per-scene seeded random permutation of the first 32 prepared frames, so the sets are nested
(the 2-view set is contained in the 4-view set, and so on). The 8-view row matches the Q3.2 test result up to small numerical differences (at most about 0.002 in the AUC values; this sweep used batch size 4). No model was retrained.
| Views | Pose pairs | Depth AbsRel ↓ | Depth δ1 ↑ | Depth RMSE (norm.) ↓ | Eval time (s) |
|---|---|---|---|---|---|
| 2 | 28 | 0.130 | 0.849 | 0.191 | 6 |
| 4 | 168 | 0.150 | 0.820 | 0.197 | 7 |
| 8 | 784 | 0.164 | 0.793 | 0.207 | 8 |
| 16 | 3360 | 0.175 | 0.769 | 0.230 | 13 |
| Views | Rot. error | Trans. error | Rotation AUC @5°/15°/30° | Translation AUC @5°/15°/30° | Joint AUC @5°/15°/30° |
|---|---|---|---|---|---|
| 2 | 10.2° | 44.2° | 0.279 / 0.545 / 0.729 | 0.007 / 0.110 / 0.229 | 0.000 / 0.052 / 0.161 |
| 4 | 8.9° | 38.2° | 0.236 / 0.576 / 0.757 | 0.006 / 0.071 / 0.192 | 0.005 / 0.050 / 0.165 |
| 8 | 9.8° | 41.0° | 0.202 / 0.523 / 0.719 | 0.007 / 0.060 / 0.172 | 0.002 / 0.041 / 0.154 |
| 16 | 9.7° | 41.5° | 0.192 / 0.523 / 0.720 | 0.010 / 0.067 / 0.180 | 0.001 / 0.043 / 0.156 |
Eval time is the wall-clock time of the whole evaluation command (Python start-up, checkpoint loading, data loading and the forward passes), so it is only a coarse indication of cost; GPU memory was not measured. Pose metrics use all pairs of views, so the number of pairs grows as V(V−1)/2 per scene.
Discussion
- Depth gets worse with more views. AbsRel increases steadily from 0.130 (2 views) to 0.150, 0.164 and 0.175 (16 views), and δ1 drops from 0.849 to 0.769, so the 16-view result is about 35% worse in AbsRel than the 2-view result. The best depth is obtained with fewer views than the model was trained on (8), so the trend is not simply “more input is better”.
- Camera pose shows no clear trend. Mean rotation error stays between 8.9° and 10.2° and rotation AUC@30° between 0.72 and 0.76 with no monotonic change; translation-direction error stays near 38–44° and the joint AUC@30° near 0.15–0.17. Because the 2-view setting has only 28 pose pairs (one per scene) and the 4-view setting 168, and pairs within a scene are not independent, differences of this size, especially the high 2-view AUC@5°, should not be over-interpreted.
- Cost grows with the number of views. The whole evaluation took 6, 7, 8 and 13 s. The jump at 16 views is consistent with global attention operating on all V×N tokens at once, whose cost grows faster than linearly in V, but this timing includes fixed overheads and we did not profile the model separately.
- Possible explanations (not tested). (i) The extra views are random frames from a 32-frame window and can lie farther from the reference view, so the pooled depth error includes harder, less overlapping views. (ii) The model was trained only with 8 views, so a larger number of tokens in global attention is a train/test mismatch; however, 2 and 4 views are also different from training and perform better, so mismatch alone does not explain the monotonic trend. (iii) The scene scale used to normalize depth is recomputed from the chosen views, so the normalization differs slightly between settings.
- Limitations. This is an evaluation-only study of one checkpoint and one seed; we did not retrain with other view counts, so we cannot separate the effect of the training/test mismatch from the difficulty of the extra views, and we did not measure memory. A natural follow-up is to train with a random number of views per step and repeat this sweep.