1.1. Fitting a voxel grid (4 points)

1.2. Fitting a point cloud (3 points)

1.3. Fitting a mesh (3 points)

2.1. Image to voxel grid (20 points)
Visualizations


Results
--load_feat flag was used. F1@0.05 score was 39.67.
2.2. Image to point cloud (20 points)
Visualizations


Results
--load_feat flag was used. F1@0.05 score was 71.5
2.3. Image to mesh (20 points)
Visualizations


Results
--load_feat flag was used. F1@0.05 score was 67.6.
Voxel, Point Cloud, Mesh Comparisons
Point clouds (71.5) > Mesh (67.6) > Voxel (39.7)
My intuition is that the order follows the ease of learning. Point clouds are the most unstructured data, with just x,y,z values for each point, and meshes are harder to learn in comparison because they encode more information. Voxels don’t compare as easily, but looking at some of the prediction, it looks like it was difficult for the model to get over the threshold in the marching cubes algorithm to confidently predict more voxels.
2.4. Analyse effects of hyperparams variations (10 points)
2.4.1 Varying initial mesh
2.4.1.1 Using torus
Visualizations


Results
--load_feat flag was used. Using torus, F1@0.05 score
was 70.6. Which is interesting because the F1@0.05 score is higher, but
the generated mesh looks worse because of the torus hole being carried
over as big gaps in the final chair meshes.
2.4.1.2 Using mesh of chair
The following chair mesh was used as the starting mesh.
Visualizations


Results
--load_feat flag was used. Using chair mesh, F1@0.05
score was 70.2. The F1@0.05 marginally improved, but no visible
qualitative gains in reconstruction quality compared to sphere. It is
worth noting that even when the starting shape is very close to the
starting mesh, as in 600_mesh_chair.gif, the shape
generated was still much more deformed.
2.4.2 Weighted loss
Visualizations


Results
--load_feat flag was used. F1@0.05 score was 55.0.
Penalizing a false negative voxel 3 times more than false positive
voxel. The F1@0.05 score was +15 points higher. The model more
aggressively filled in voxels. There are more false positives, but the
shapes look much more complete.
2.5. Interpret your model (10 points)
I want to see if there is a pattern in where our models fail to predict features. Generating an error heatmap can highlight where the errors are. The heatmap shows that in these samples, common zone of error is in the top and near the feet of the chairs.

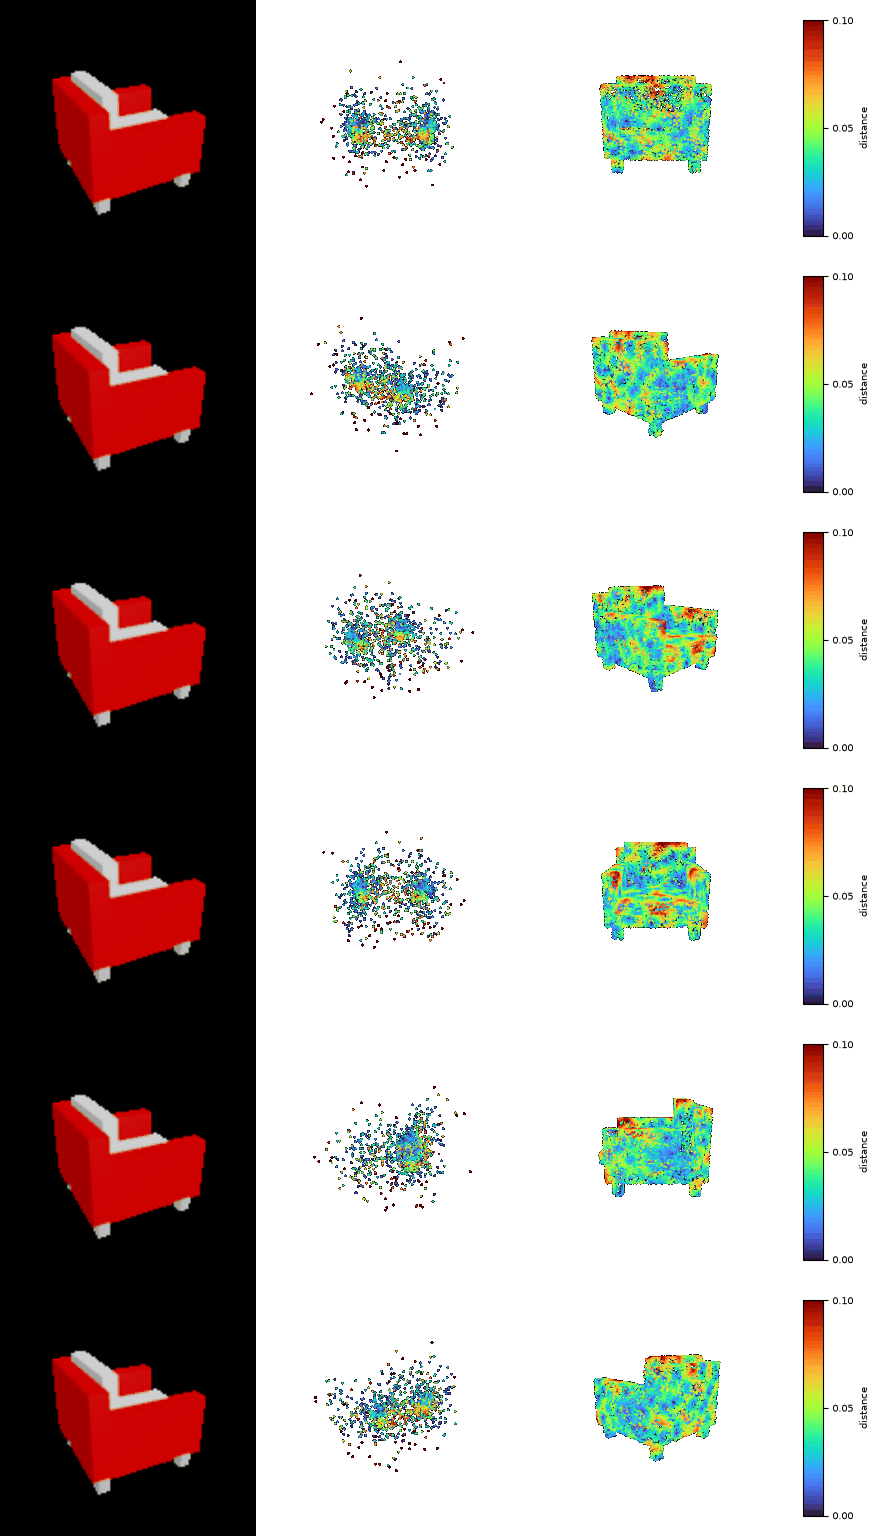
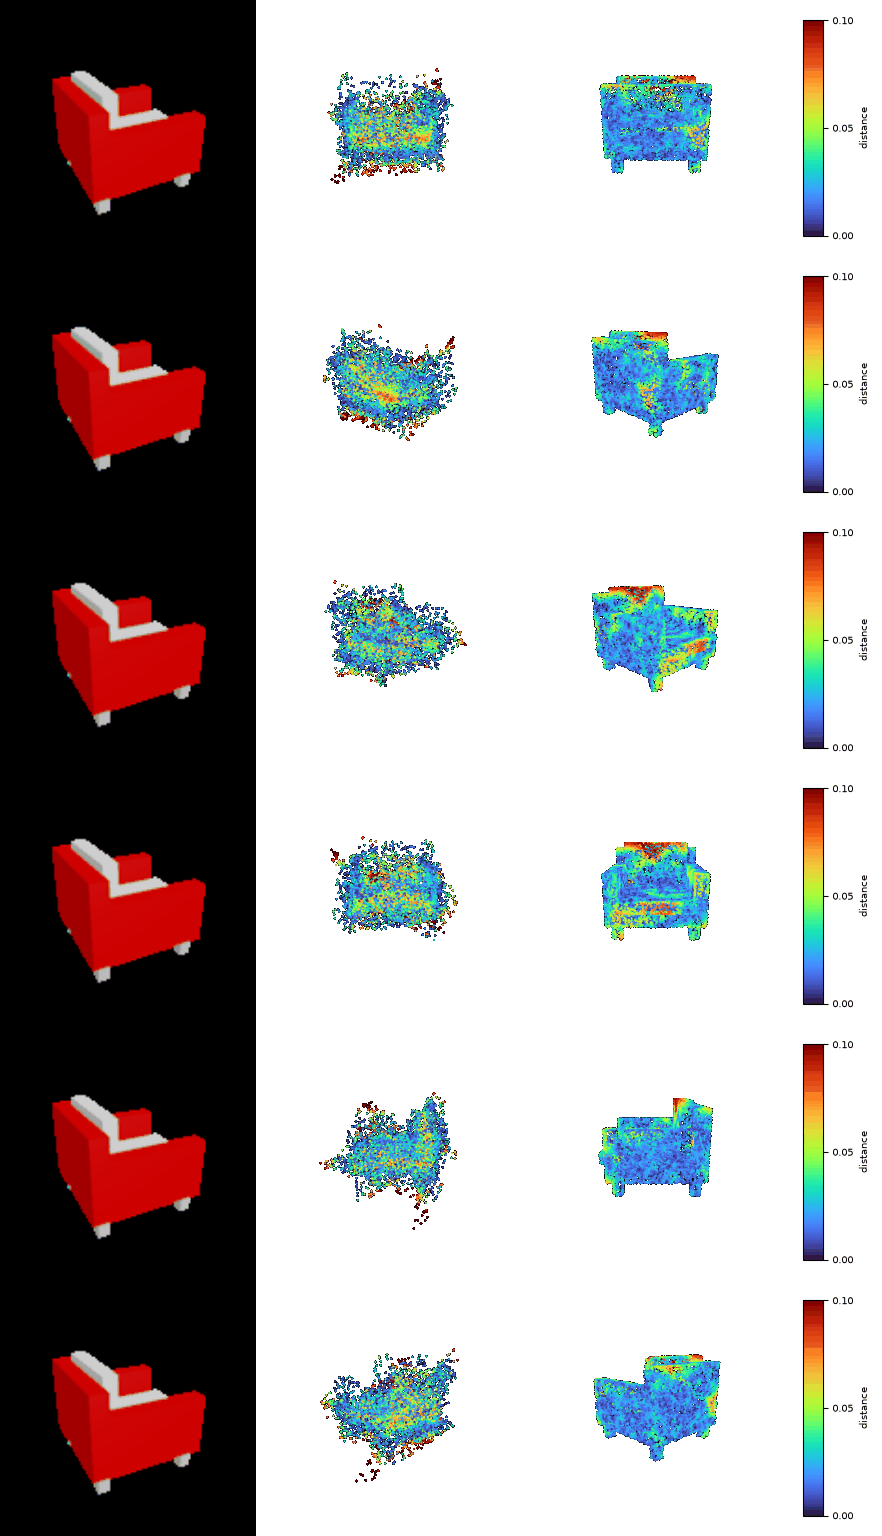
To see if this is true across the different models we’ve learned, I will plot the mean distance of erroneous points and GT over normalized height of chairs.
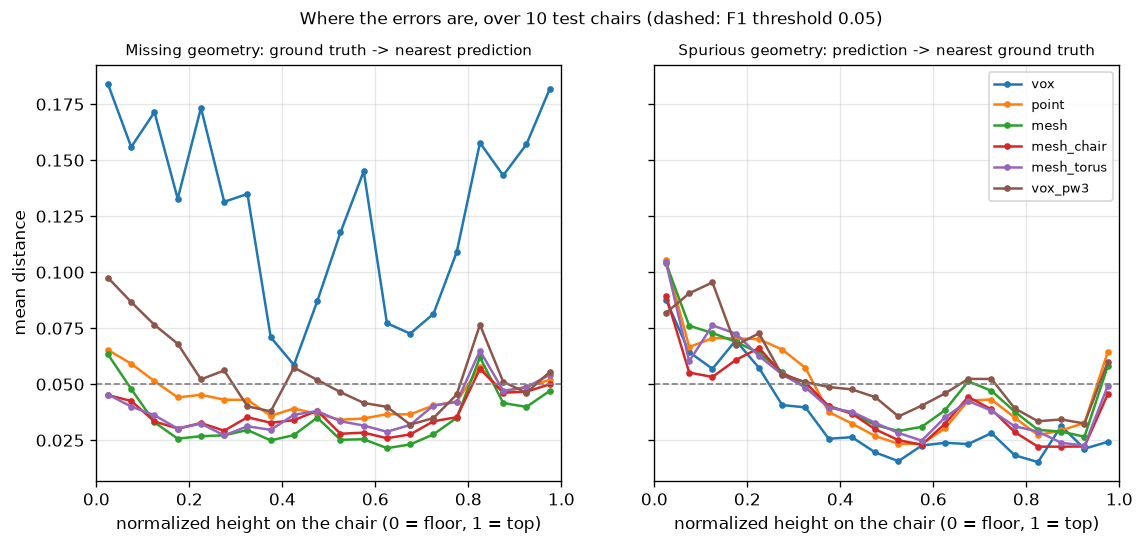
There is some truth to the claim that the common zone of error is in the top and near the feet of the chairs.
3.1 Implicit network (10 points)
Visualizations


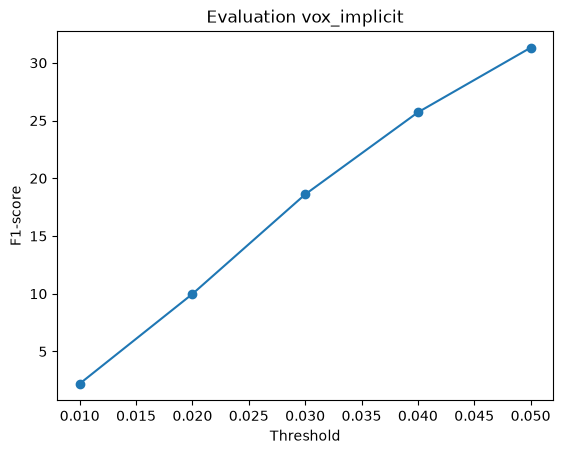
Results
--load_feat flag was used. F1@0.05 score was 31.3. One
of the benchmark examples produced an empty output.
3.2 Parametric network (10 points)
Visualizations


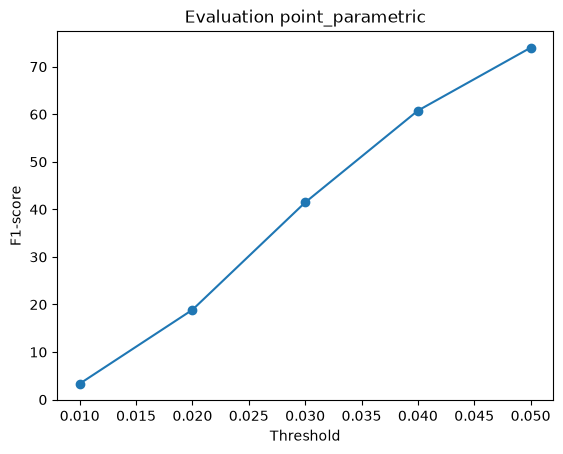
Results
--load_feat flag was used. F1@0.05 score was 74.3. Best
F1@0.05 score.
3.3 Extended dataset for training (10 points)
Visualizations
Multiclass model on chair eval

Multiclass model on multiclass eval


Chair model on multiclass eval (plane)

Chair model on multiclass eval (car)


Results
--load_feat flag was used. F1@0.05 score 70.6 evaluated
just on chair data. Performed slightly worse F1 score and shows no
qualitative improvements in the renderings compared to the model trained
on just chairs.
The multiclass model did show comprable F1@0.05 scores on the multiclass dataset (plane: 91.84, car 85.83, chair 70.81), but the generated point clouds were not qualitatively better. The point clouds generated by the multiclass models tended to cluster too much in the center of the cloud, and points near the surface were very sparse. I believe the variance in samples led to the model preferring to learn points closer to the average, middle of the cloud. The scores for the plane and car had higher means. This is likely because their shapes are “easier” with more mass in the center of the clouds, rewarding the model’s tendacy to shoot to the center.
The chair model predicted chair-like clusters in each of the multiclass evals. This suggested that the model wasn’t predicting, but rather doing something akin to nearest neighbor retrieval1
M. Tatarchenko, S. R. Richter, R. Ranftl, Z. Li, V. Koltun, T. Brox. “What Do Single-view 3D Reconstruction Networks Learn?” CVPR 2019. arXiv:1905.03678↩︎