3.1 Implicit Networks
Name: Hiroki Mii
Andrew ID: hmii
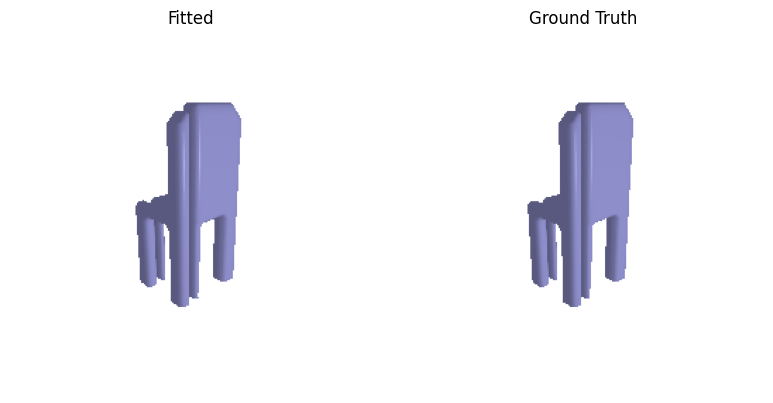
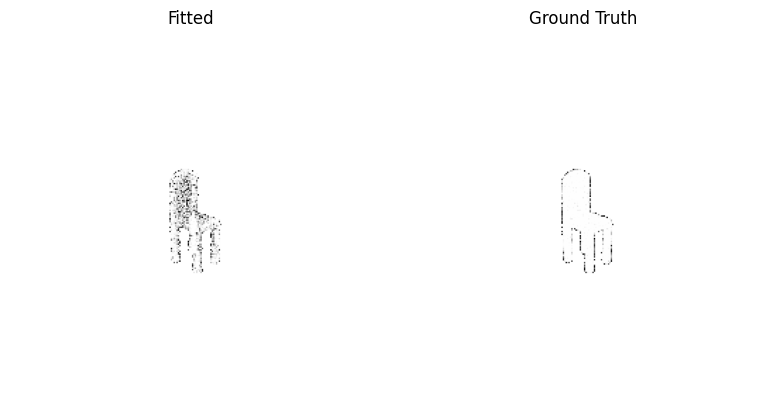
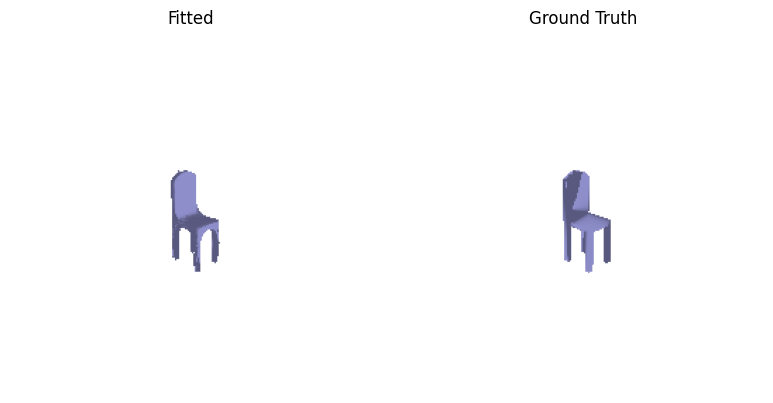
--load_feat was used across all experiments.


F1@0.05: 66.443
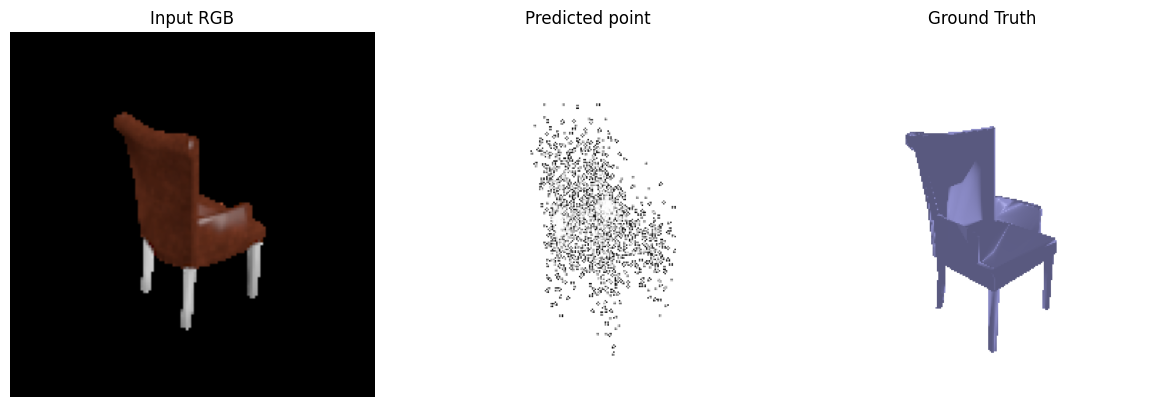
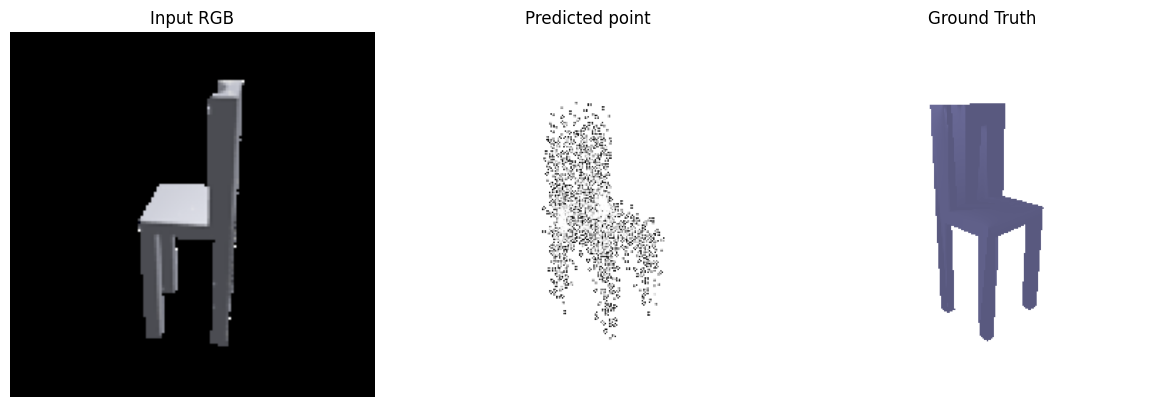
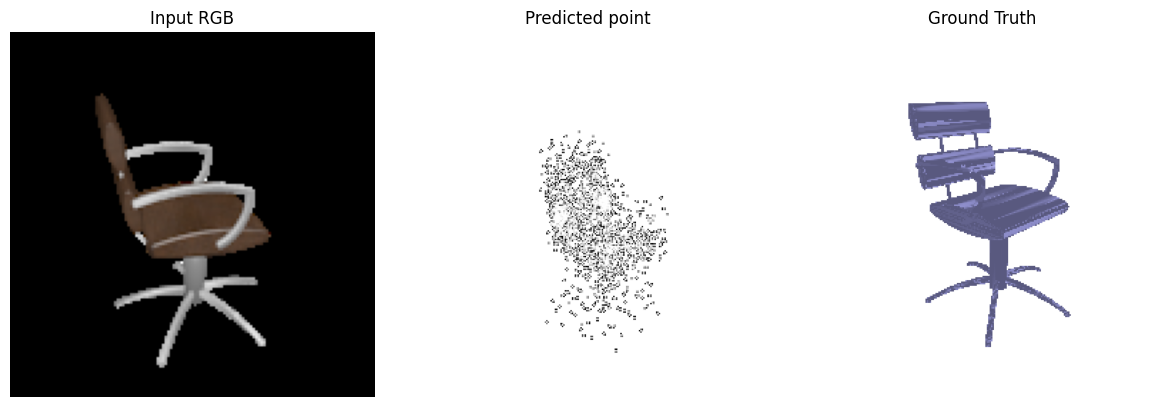
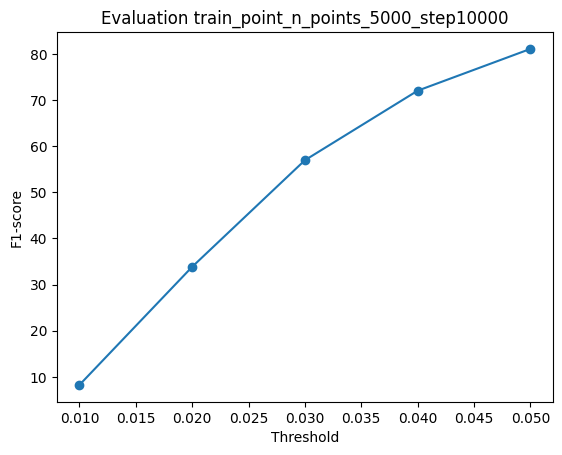
F1@0.05: 81.076
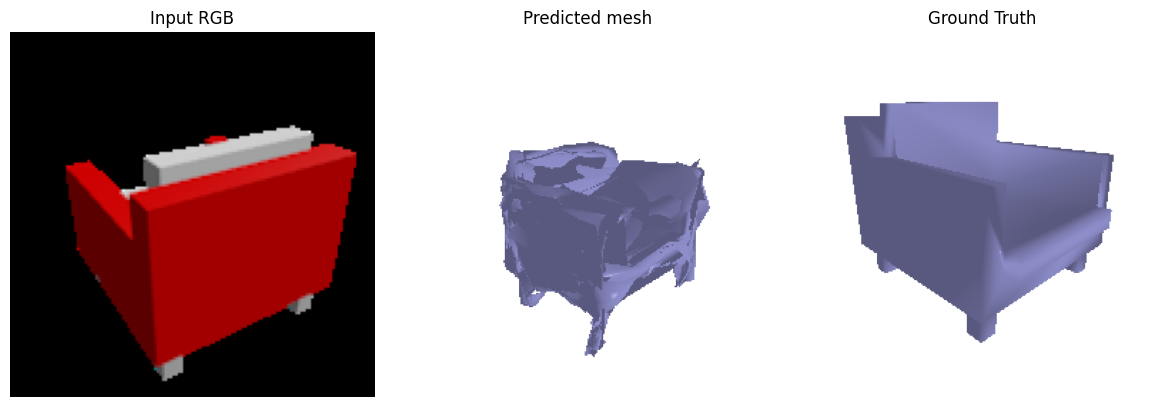
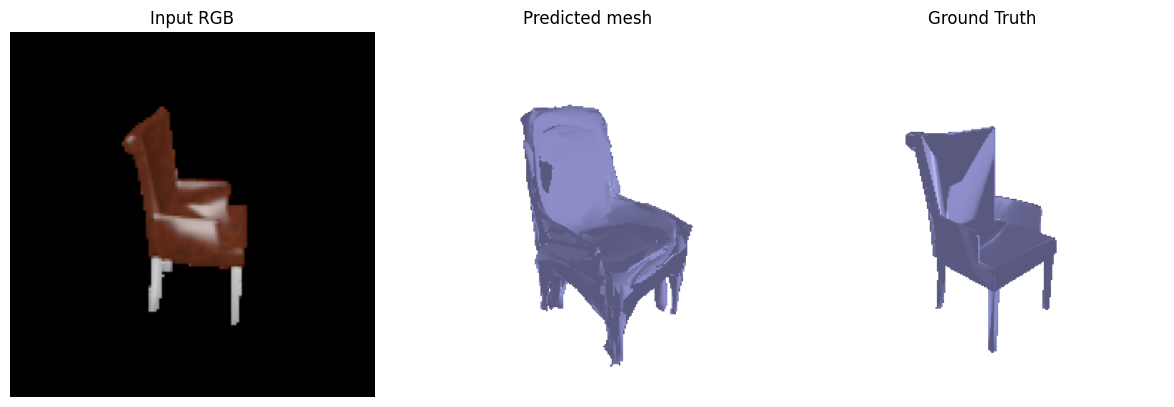
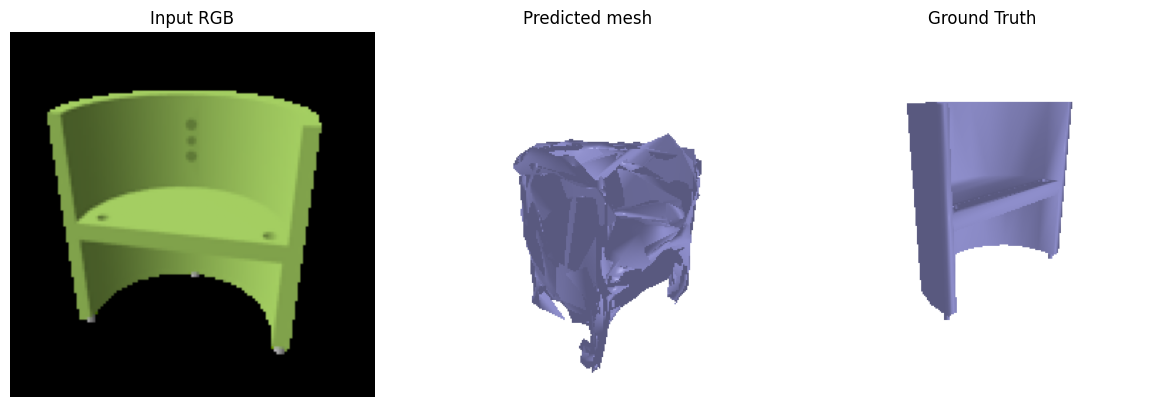
F1@0.05: 68.659
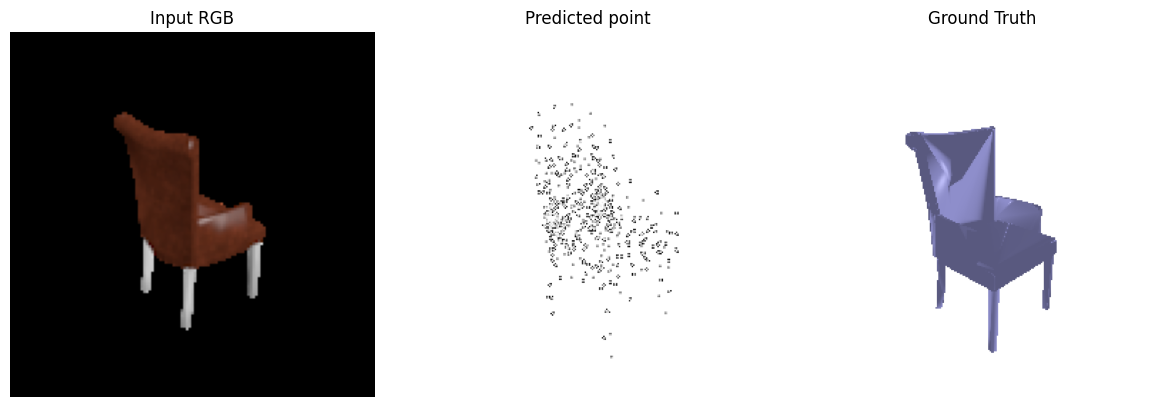
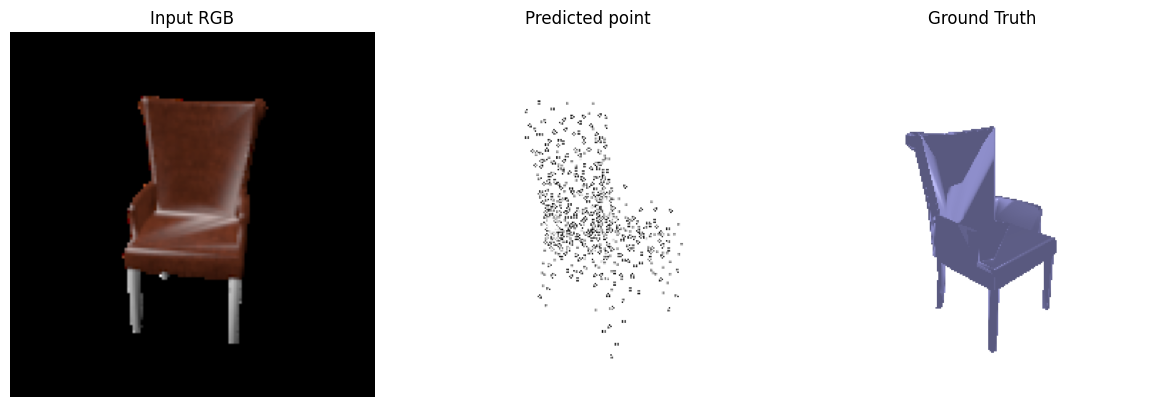
Point clouds scored the highest (81.1), followed by meshes (68.7) and voxels (66.4). This particular order makes sense due to each representation's surface structure. A point cloud is an unordered set of independent points, so each point only needs to land near the ground truth surface, and moving one point never affects another. A mesh is a connected surface, so badly fitted vertices drag their neighbors along and can crumple its structure. A voxel grid makes a binary occupied or unoccupied decision for each cell of a fixed-size lattice, so thin parts get dropped and small errors become holes or floating fragments. F1@0.05 only checks whether points land near the surface, so it favors the point cloud even though its predictions look the least like a chair.
The positive weight scales the loss on occupied voxels relative to empty ones. Lower valued weights push the model towards emptier shapes while higher weights toward fuller shapes. F1@0.05 was 65.7, 66.4, and 66.0 for weights 0.3, 1.0, and 3.0, respectively. The weight of 1.0 had the best score, but in general, changing the weights had little effect, and the visual outputs agree. All three outputs have broken legs and floating fragments.


F1@0.05 was 64.2, 69.2, and 81.1 for 500, 1000, and 5000 points, respectively. F1 scores increase with more points as more points create denser surfaces. Therefore, a ground truth point is more likely to have a predicted point within 0.05 of it, and a predicted point is more likely to have a ground truth point within 0.05 of it.
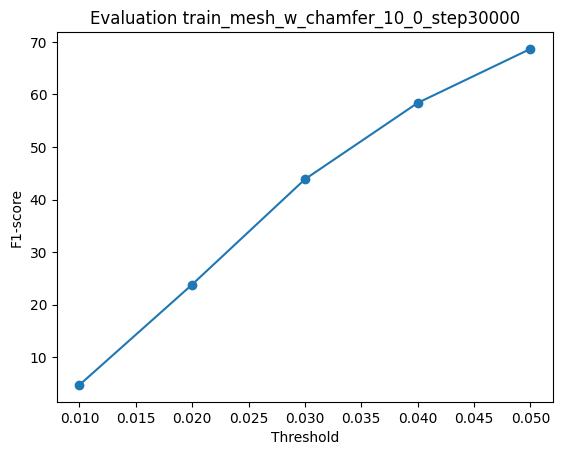
The Chamfer weight scales how strongly the predicted mesh is pulled towards the ground truth relative to the smoothness term (held fixed at 0.1). F1@0.05 was 60.6, 64.0, and 68.7 for weights 0.1, 1.0, and 10.0, respectively. The renders show the trade-off between smoothness and fit. At 0.1, the chair is formed with only a few flat sheets. On the other hand, 10.0 has spikier edges, but its boxy body fits the shape of the chair better.
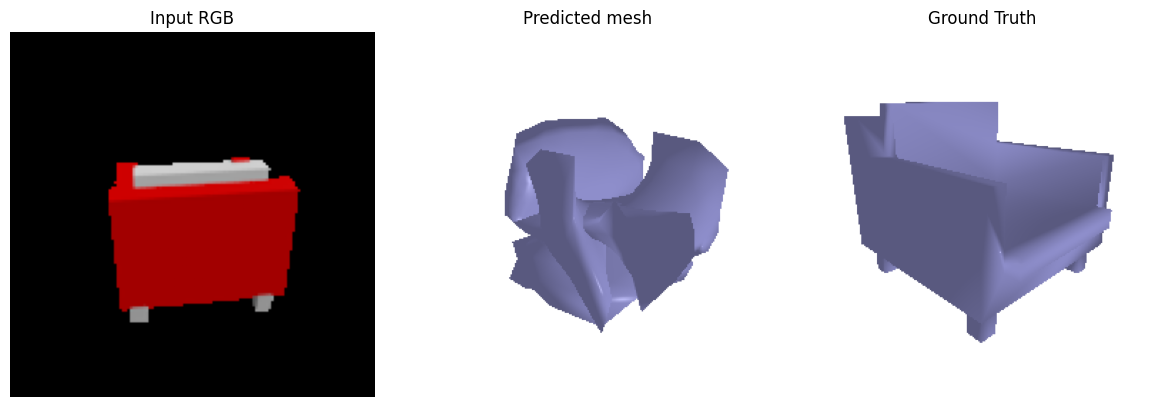
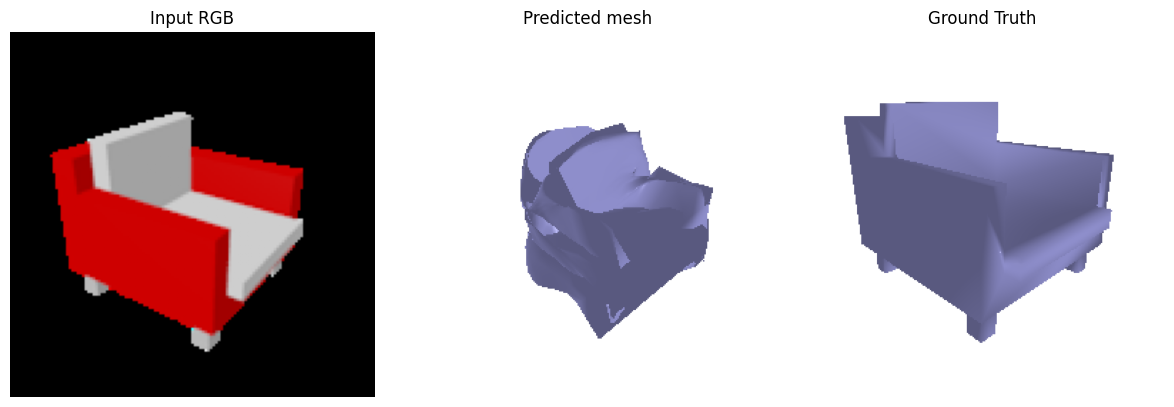
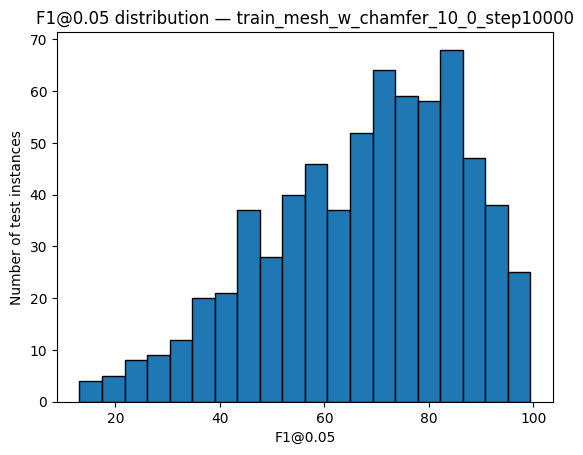
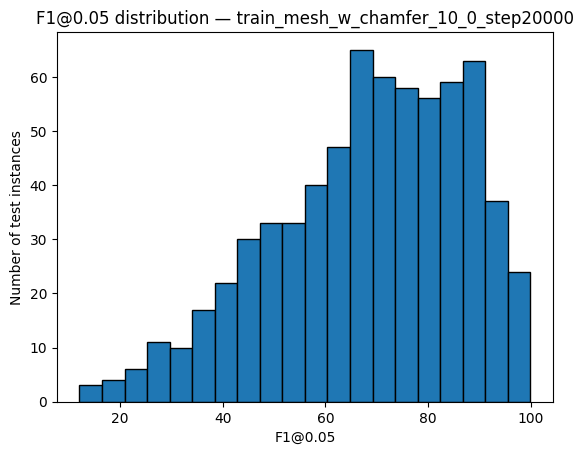
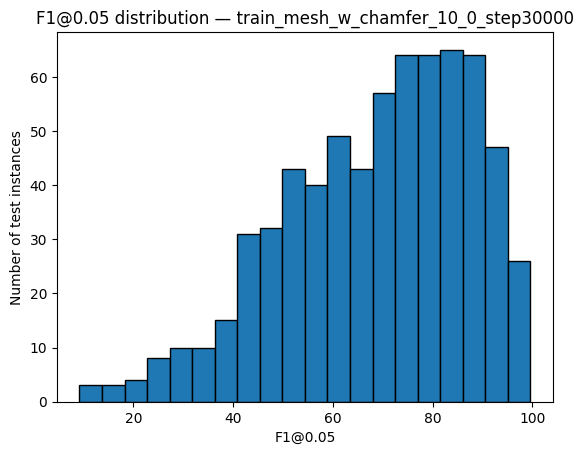
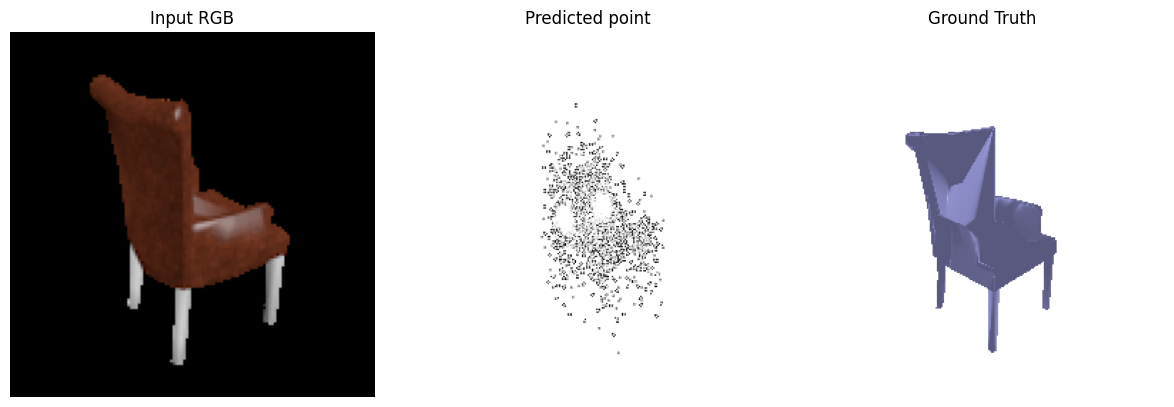
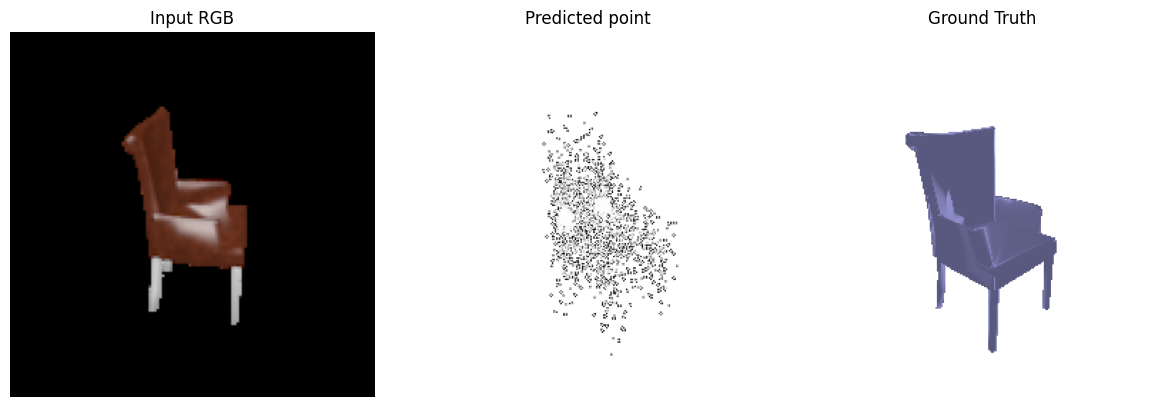
To see how the model learns across iterations, weights were saved at different checkpoints. Voxel grid and mesh were trained over 30k iterations and weights were saved at steps 10k, 20k, and 30k. Point cloud was trained over 10k iterations (lesser due to risk of overfitting) and weights were saved at steps 1k, 5k, and 10k. The below histogram shows the distribution of F1 score predictions for a 10k, 20k, and 30k iteration trained model for mesh. Although average F1 scores did improve across iterations, it is hard to see changes in histogram distributions so this motivates us to visually inspect the prediction outputs directly. The below visualizations show the gradual improvements in shape of the predicted representations. For voxel grid, the chair starts with just the seat and back support, but later develops arm rests and stem. For point cloud, the points start scattered, but becomes more filled. For mesh, the chair starts off with a blocky shape with barely a seat, but later develops a circular back and arm rest.


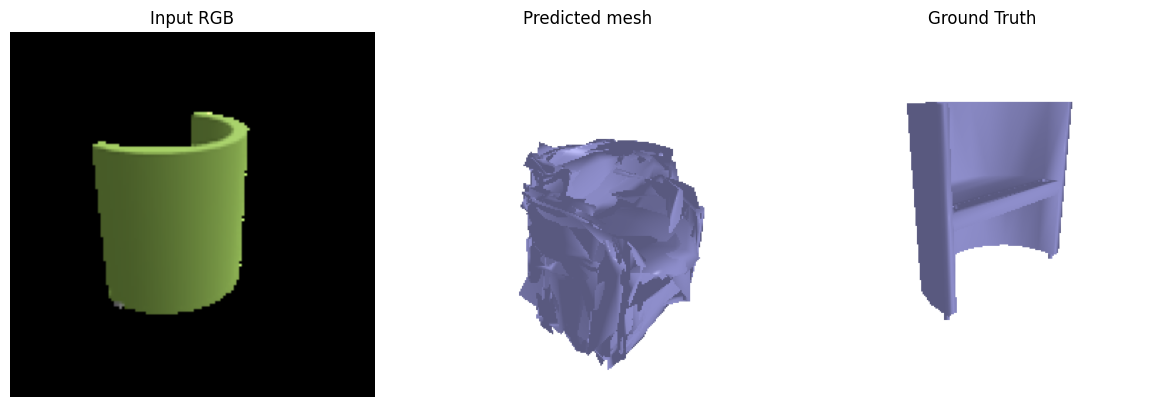
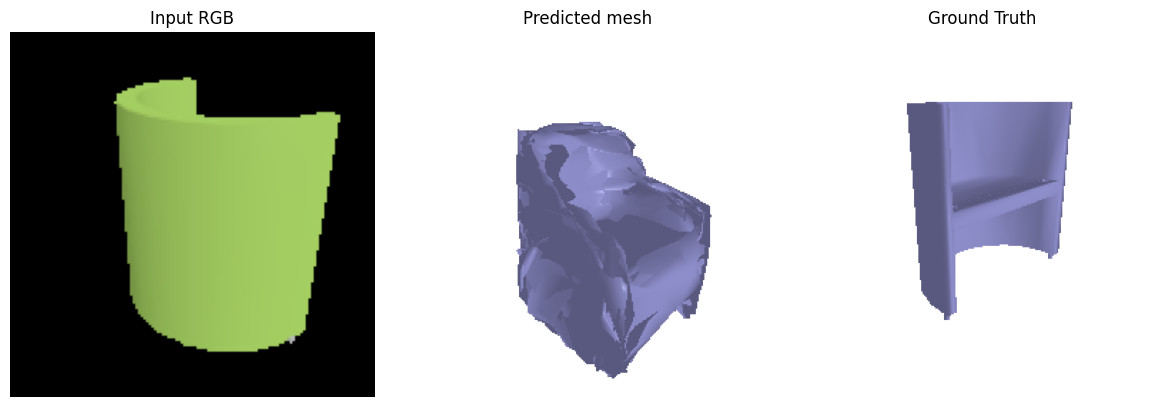
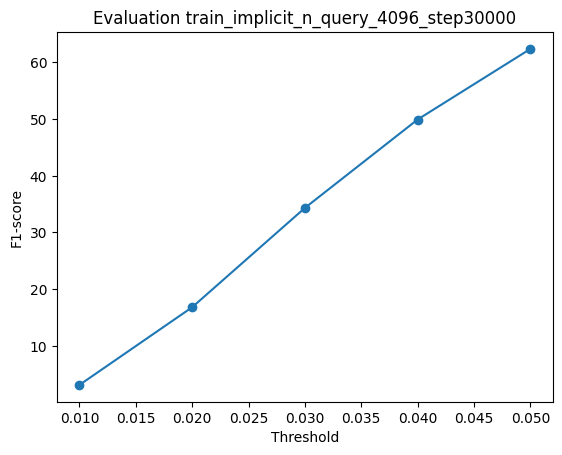
F1@0.05: 62.386
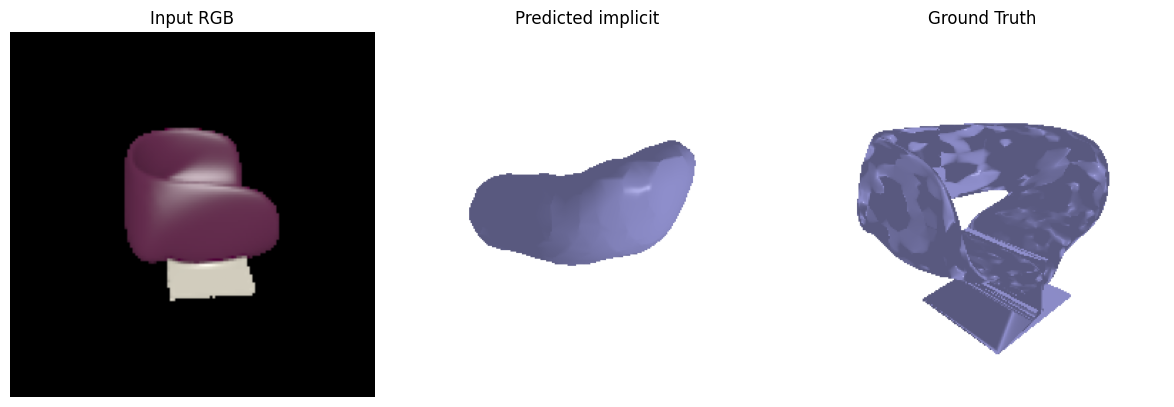
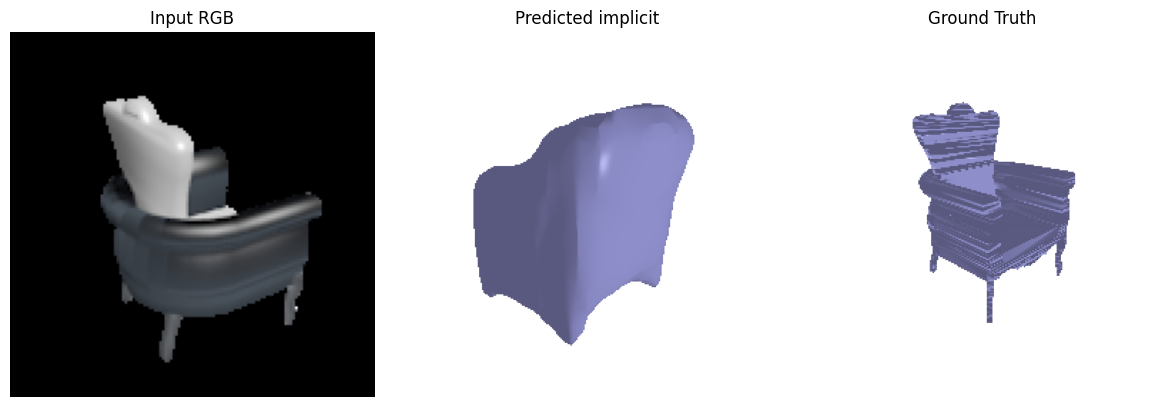
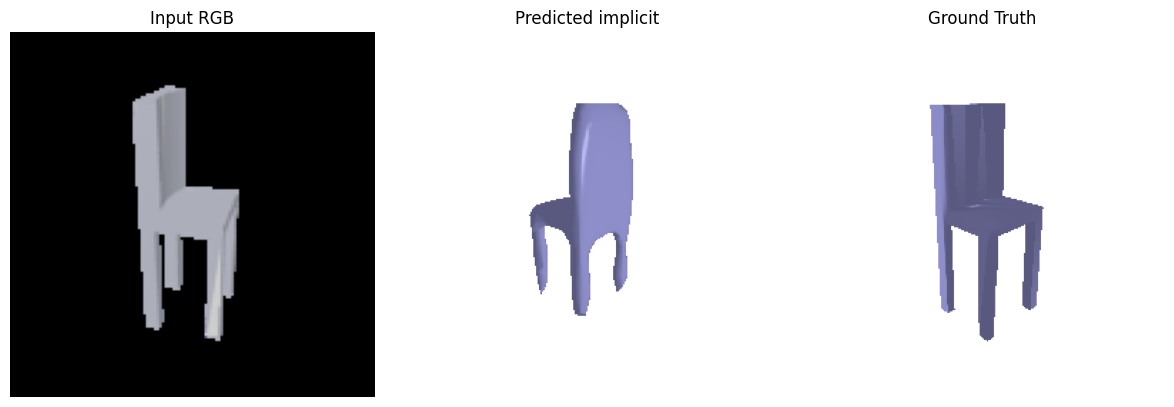
The implemented implicit network is a simplified version of [1]. It takes the 512 dimension image feature and a 3D query point, adds them at the input, passes them through five fully connected ResNet blocks, and outputs an occupancy value for that point. During training, 4096 sampled points from a 32^3 grid are queried at each step and compared with the voxel ground truth at the same locations. At test time, all 32,768 points are queried and the surface is extracted with marching cubes.
Because the shape is a continuous function and not a fixed set of cells, points, or vertices, the predicted surfaces look cleaner than the other representations. They are closed and smooth with no floating fragments like the voxel grid, no scattered points like the point cloud, and no crumpled patches like the mesh.
The smoothness is also the weakness. The decoder favors smooth functions and has trouble representing thin structures. The first chair's leg/supporter is missing and the second chair is overly smoothed.
The model could improve by using a more complex architecture. It could condition every block on the image feature and/or apply positional encoding to the query coordinates to capture thin, high frequency structures.