Assignment 2: Single View to 3D
Andrew ID: henrytsu
Reconstruction: 10,000 steps, batch size 8, 6,100 training chairs, supplied ResNet18 features (--load_feat). Evaluation: all 678 test objects, 1,000 ground-truth samples each. Training uses CPU for voxel/mesh and MPS for the other models. Fitting uses 2,000 steps.
1. Exploring loss functions


2. Reconstructing 3D from a single view
2.1. Image to voxel grid
F1@0.05: 38.27%.


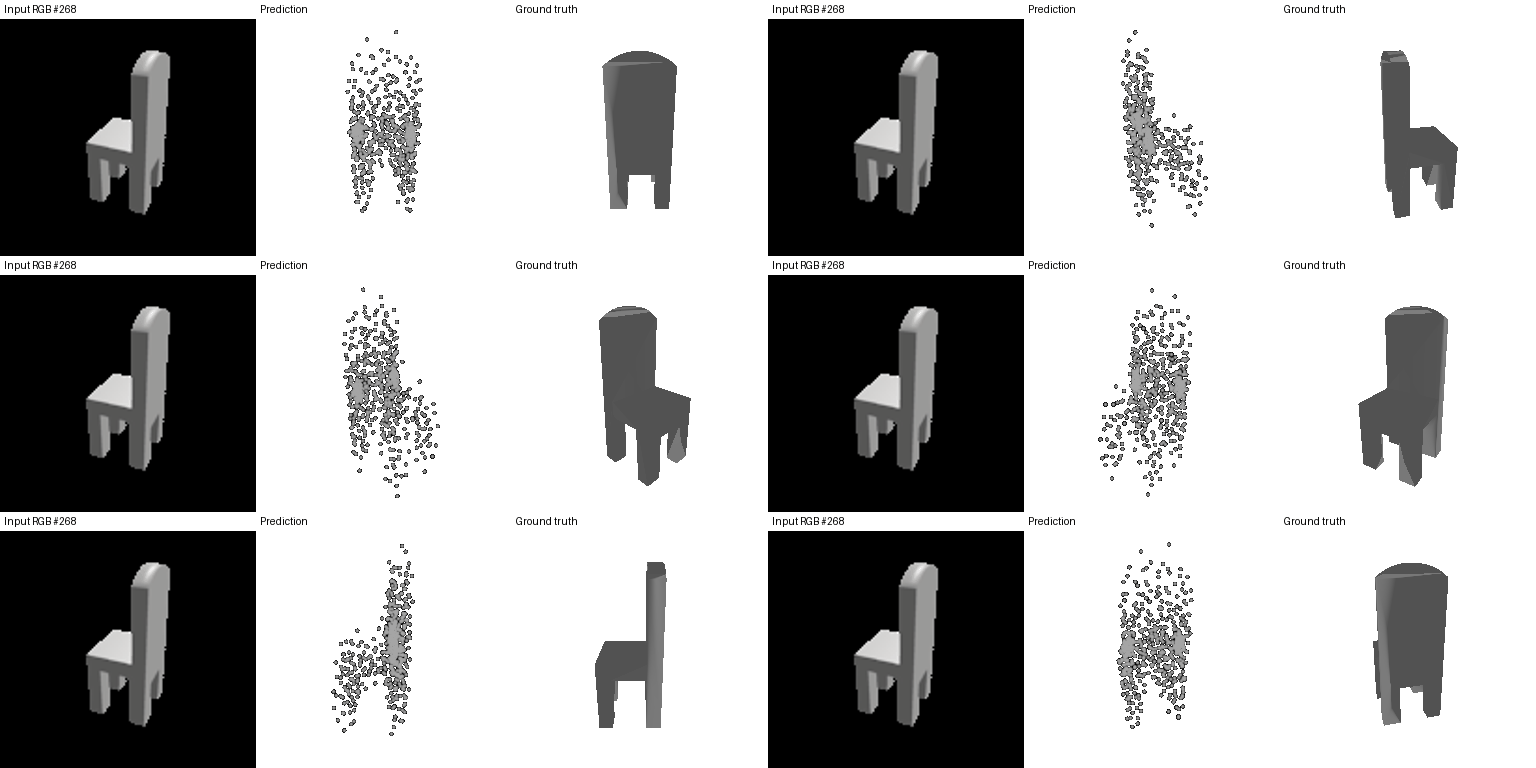
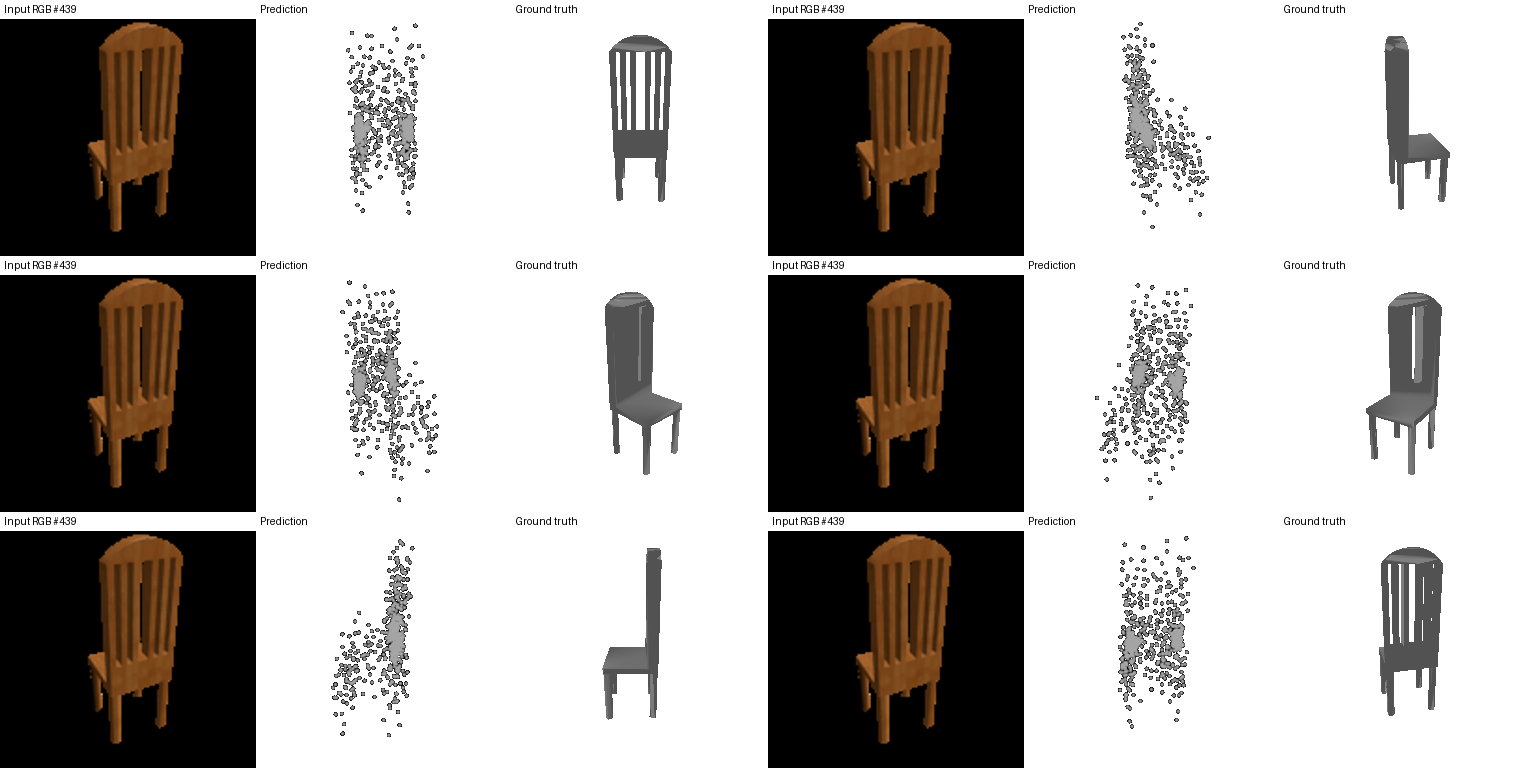
2.2. Image to point cloud
F1@0.05: 74.48%.


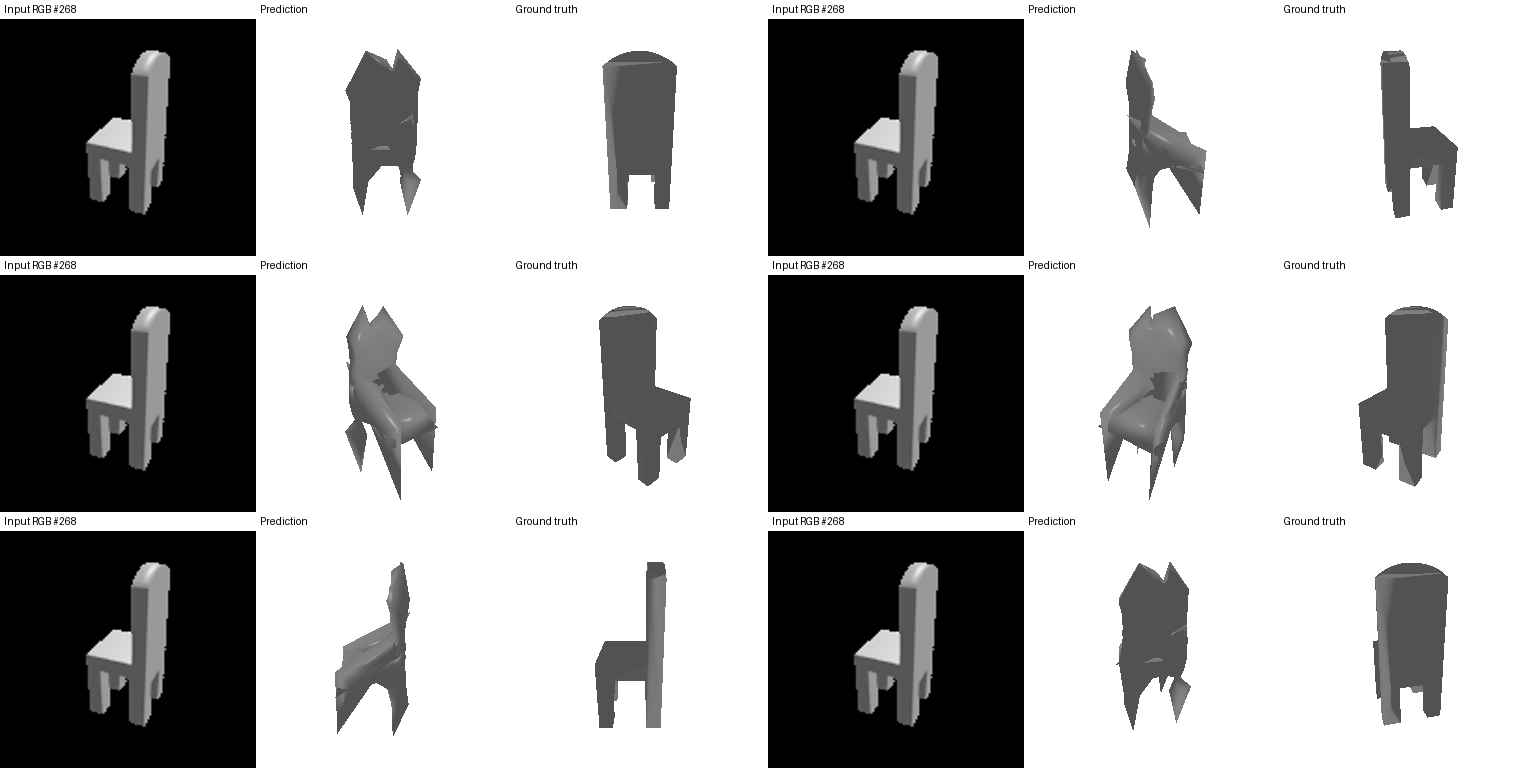
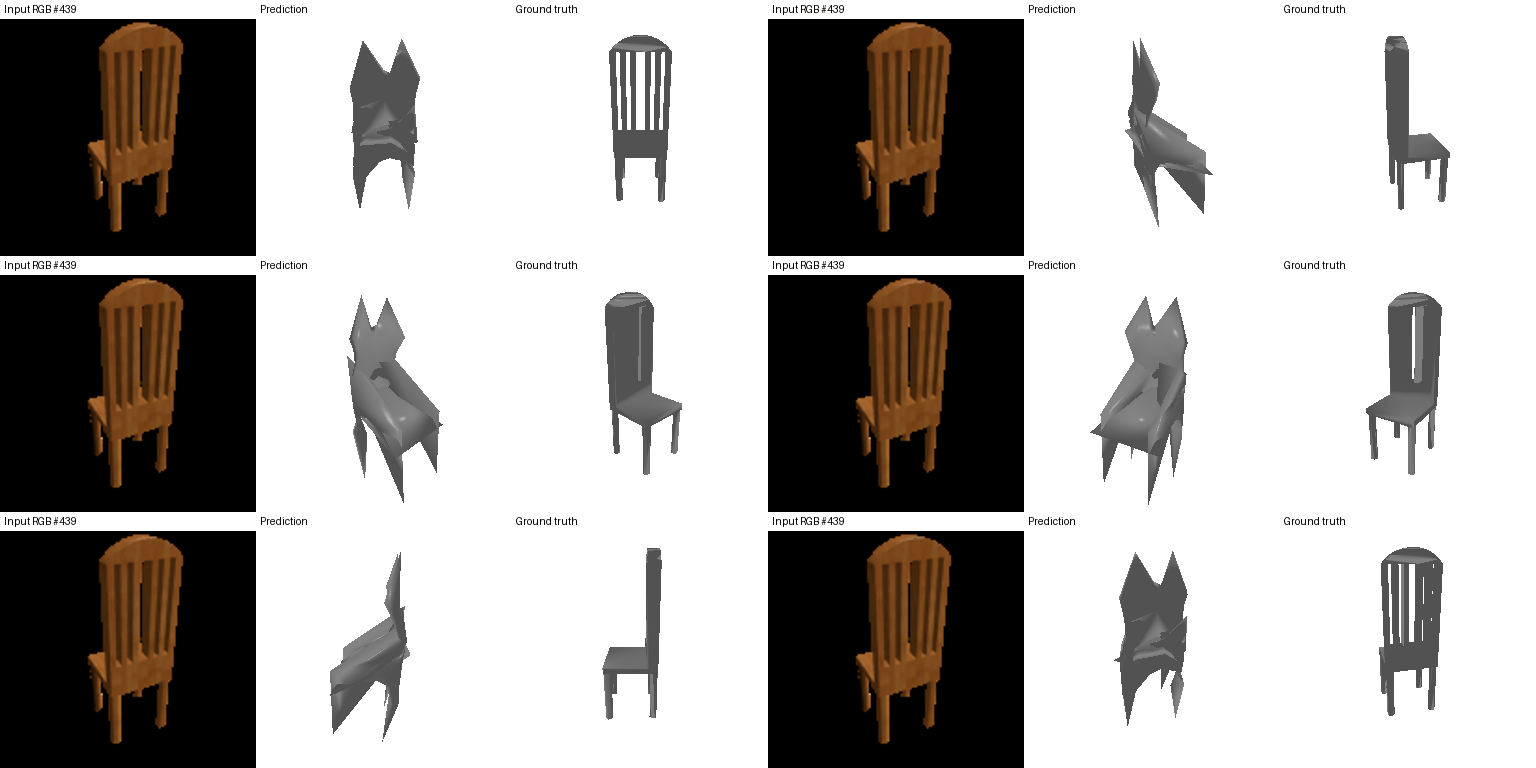
2.3. Image to mesh
F1@0.05: 67.77%.


Quantitative comparison
| Representation | F1@0.05 (%) |
|---|---|
| vox | 38.27 |
| point | 74.48 |
| mesh | 67.77 |
F1 ordering: point > mesh > vox. Points directly fit surfaces; meshes have fixed topology and may fold; the 32-cubed voxel grid loses thin details. Voxel/implicit surfaces are centered following the starter evaluation. Equal steps do not imply equal compute.
2.4. Hyperparameter: number of output points
| Output points | F1@0.05 (%) | Difference from 1,000 (pp) |
|---|---|---|
| 256 | 62.56 | -11.92 |
| 1,000 | 74.48 | +0.00 |
| 2,048 | 77.83 | +3.35 |
The strongest setting is 2,048 points. Output count affects coverage, decoder capacity, and training sample count; evaluation always uses 1,000 ground-truth samples.

2.5. Feature interpolation
Interpolate two held-out image features at five values and decode their point clouds. The panels show changes in seat extent and back shape. Continuity follows from the decoder; it does not prove that intermediate features represent real images.

3. Additional architectures
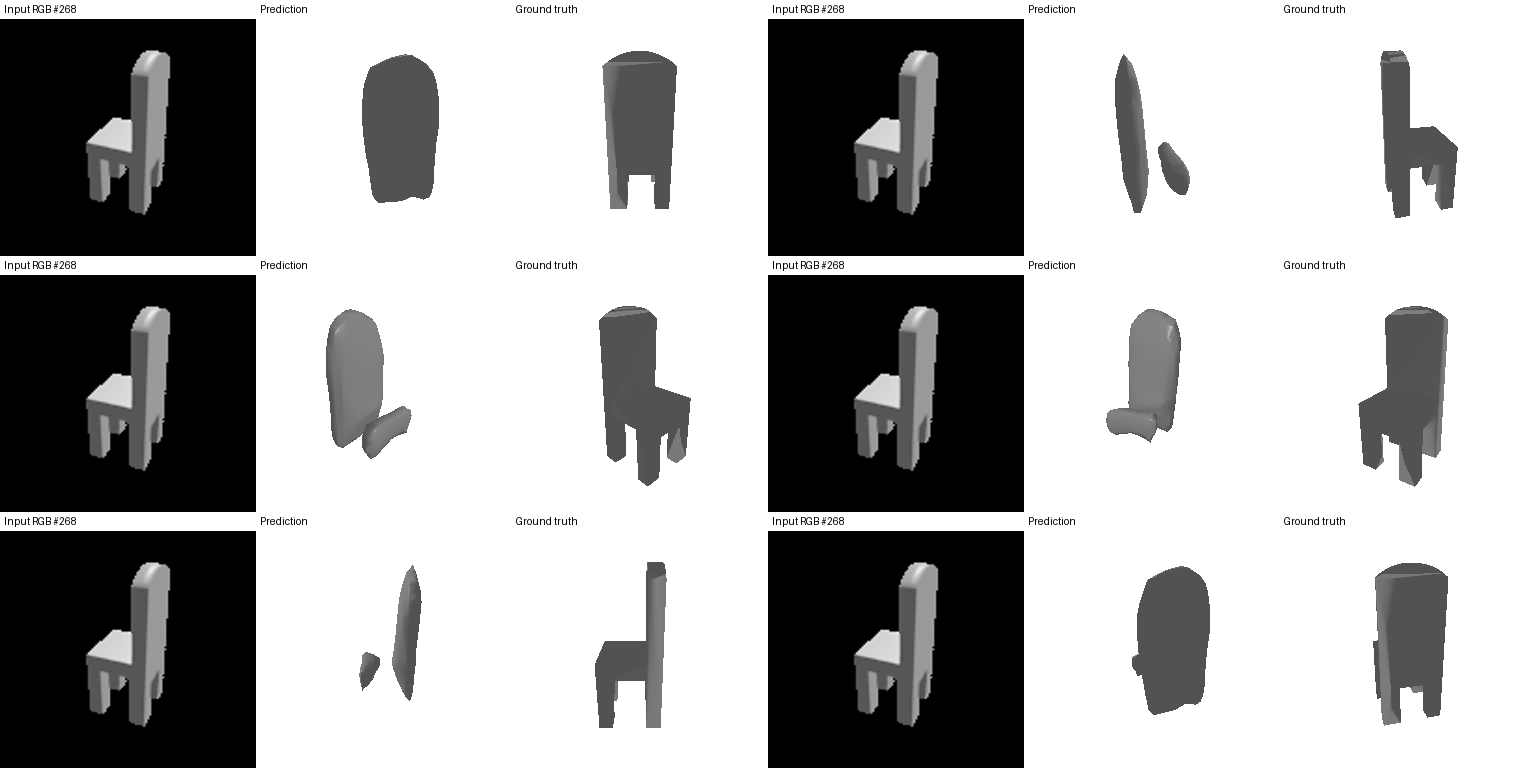
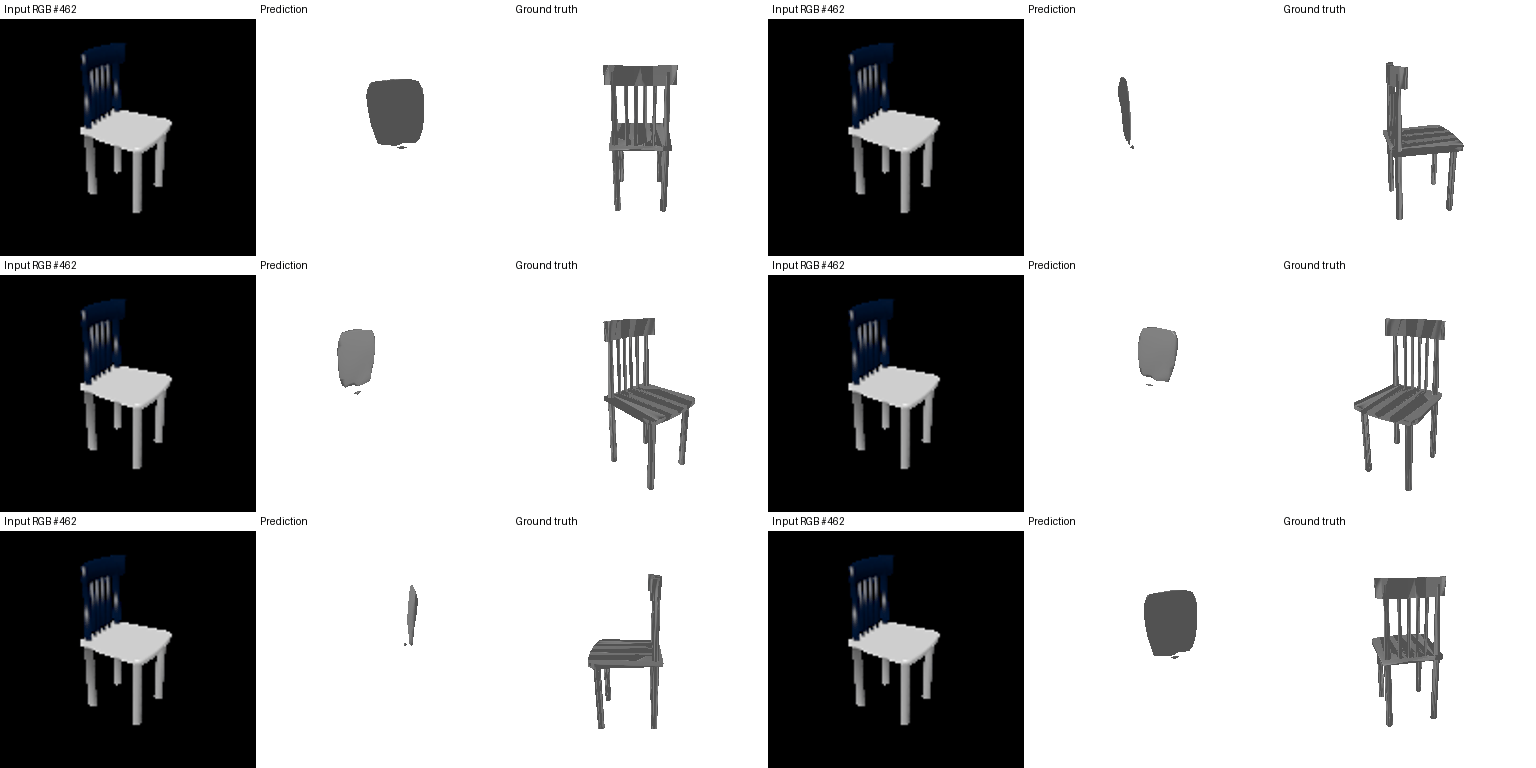
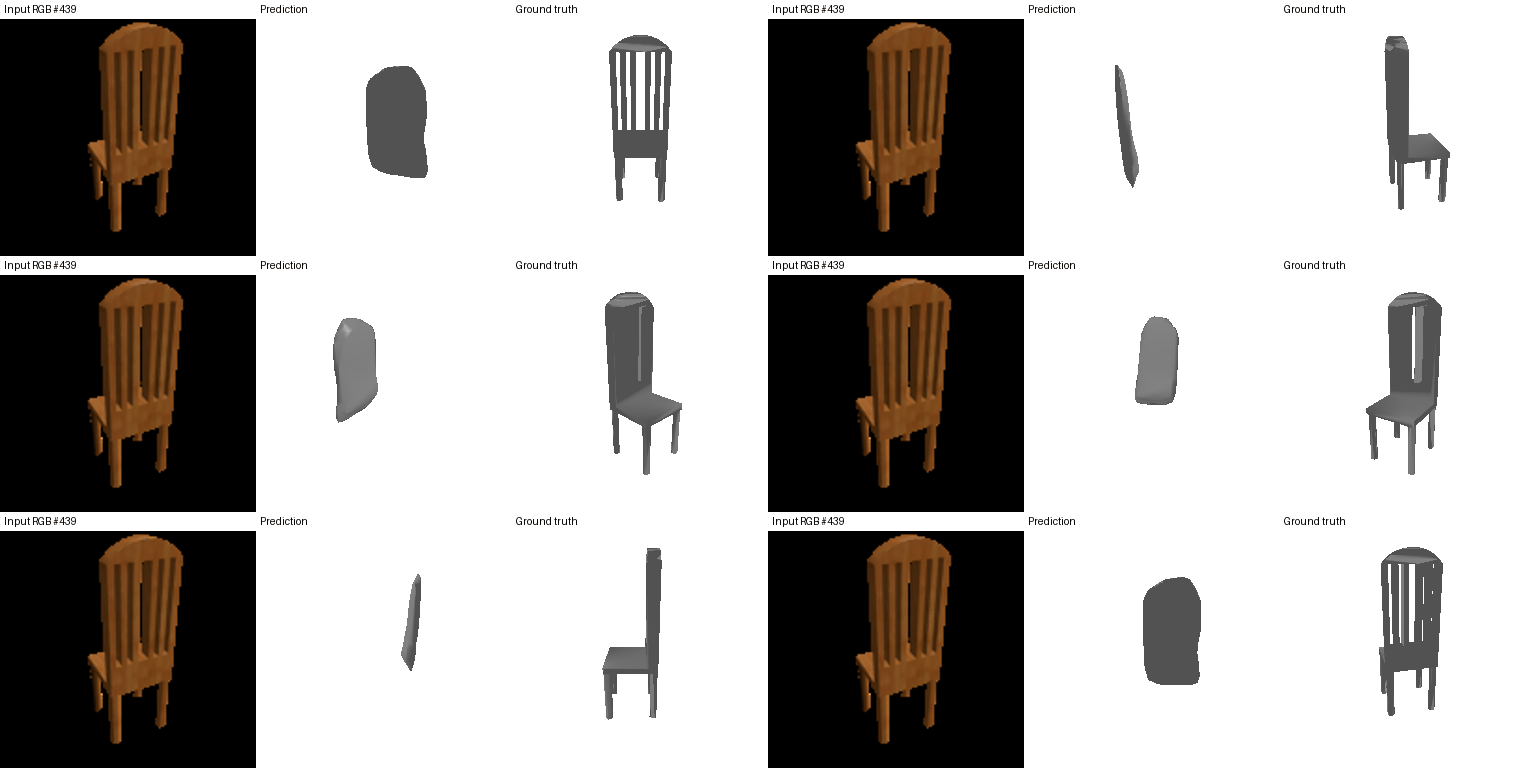
Implicit: image feature + 3D coordinate → occupancy; 2,048 sampled training queries, full 32-cubed inference grid. Parametric: image feature + 2D coordinate → 3D surface point.
3.1. Implicit network
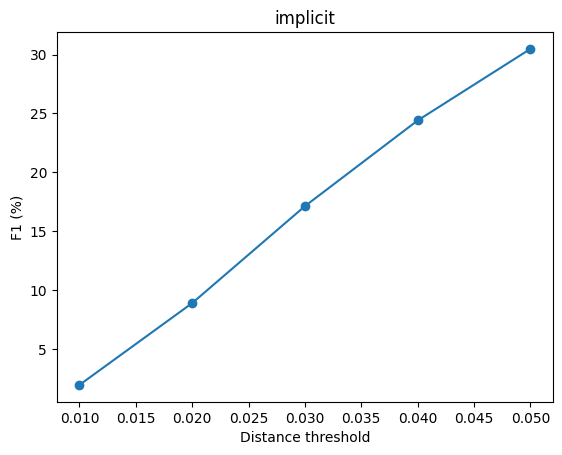
F1@0.05: 30.49%.
3.2. Parametric network
F1@0.05: 69.42%.
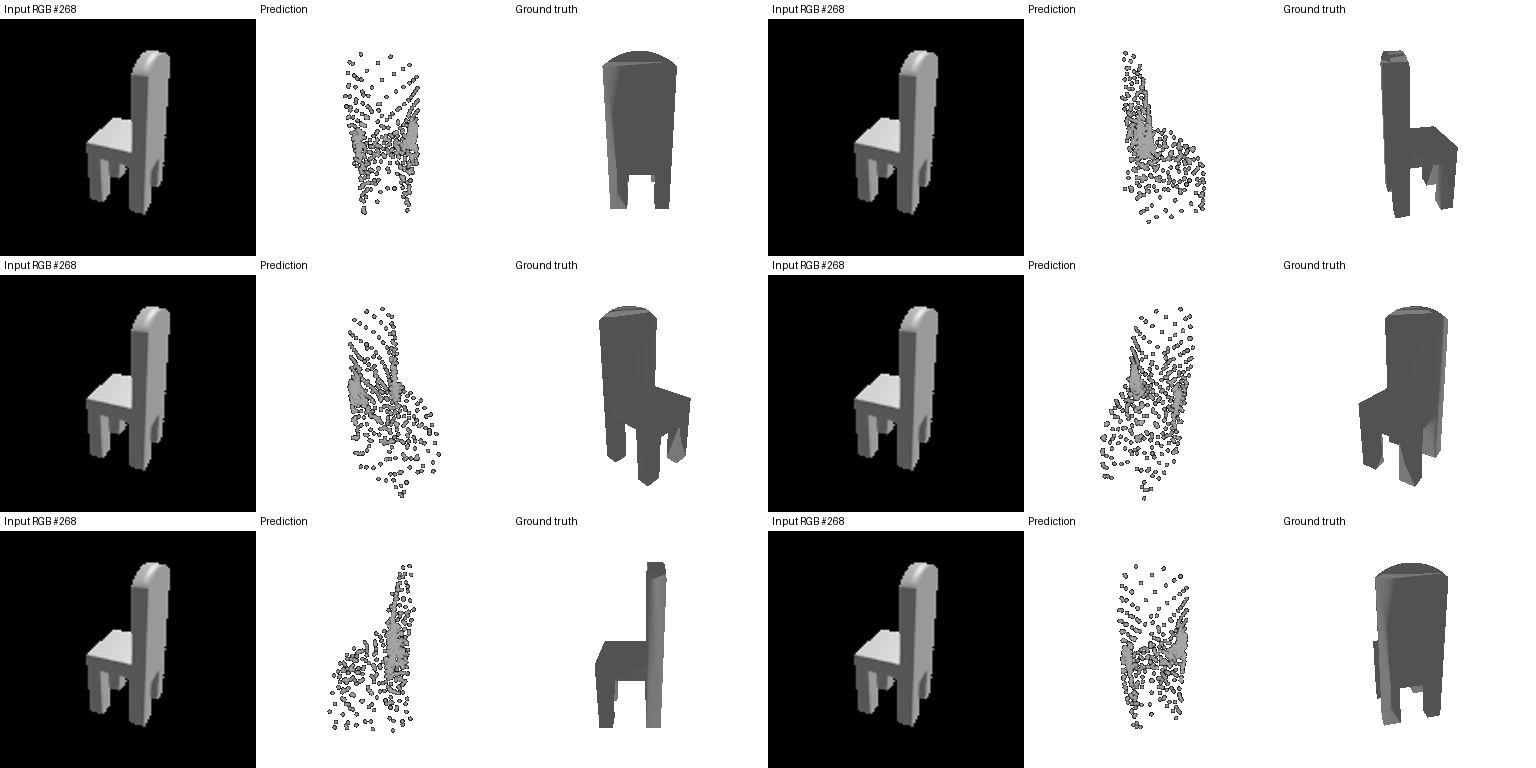
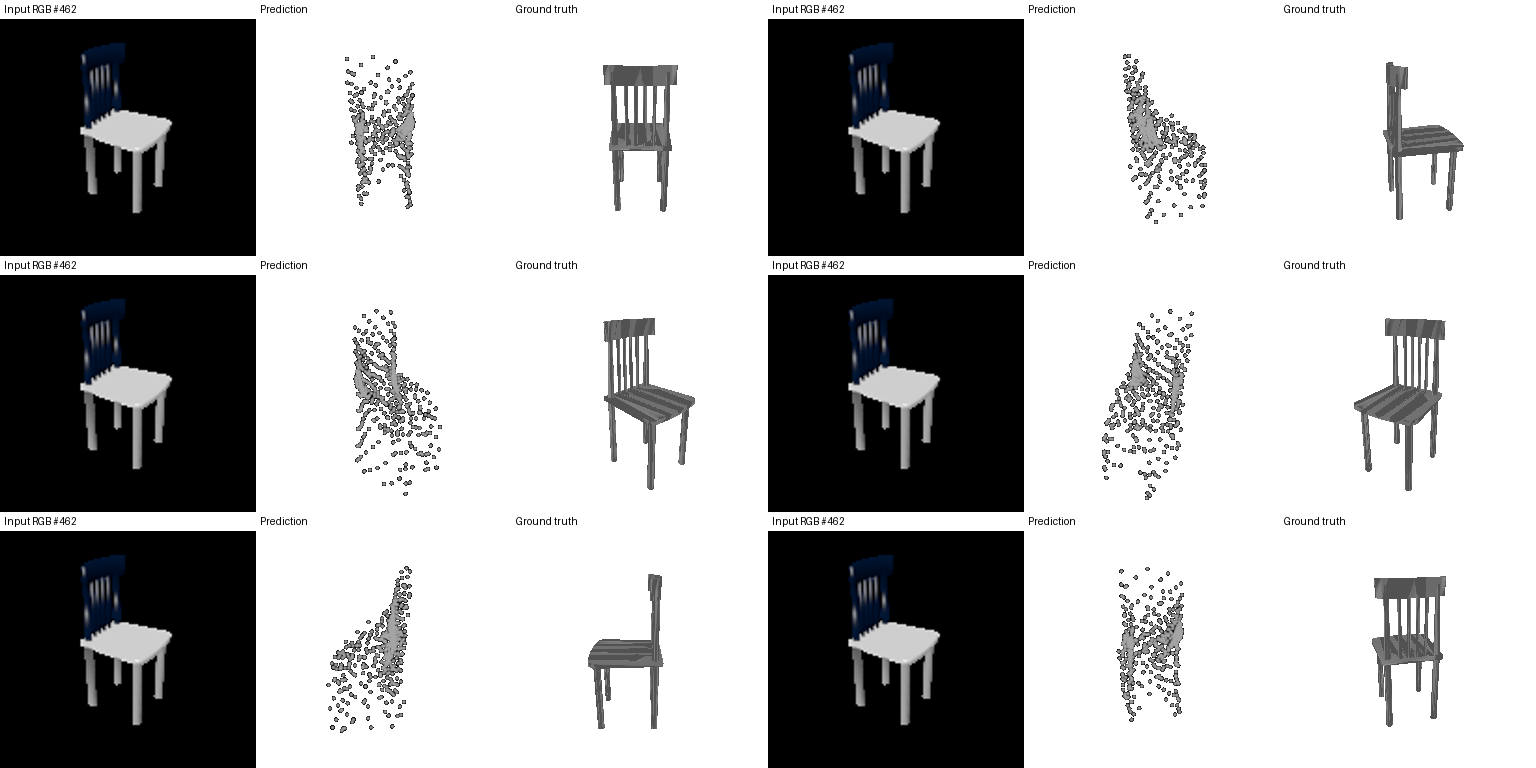
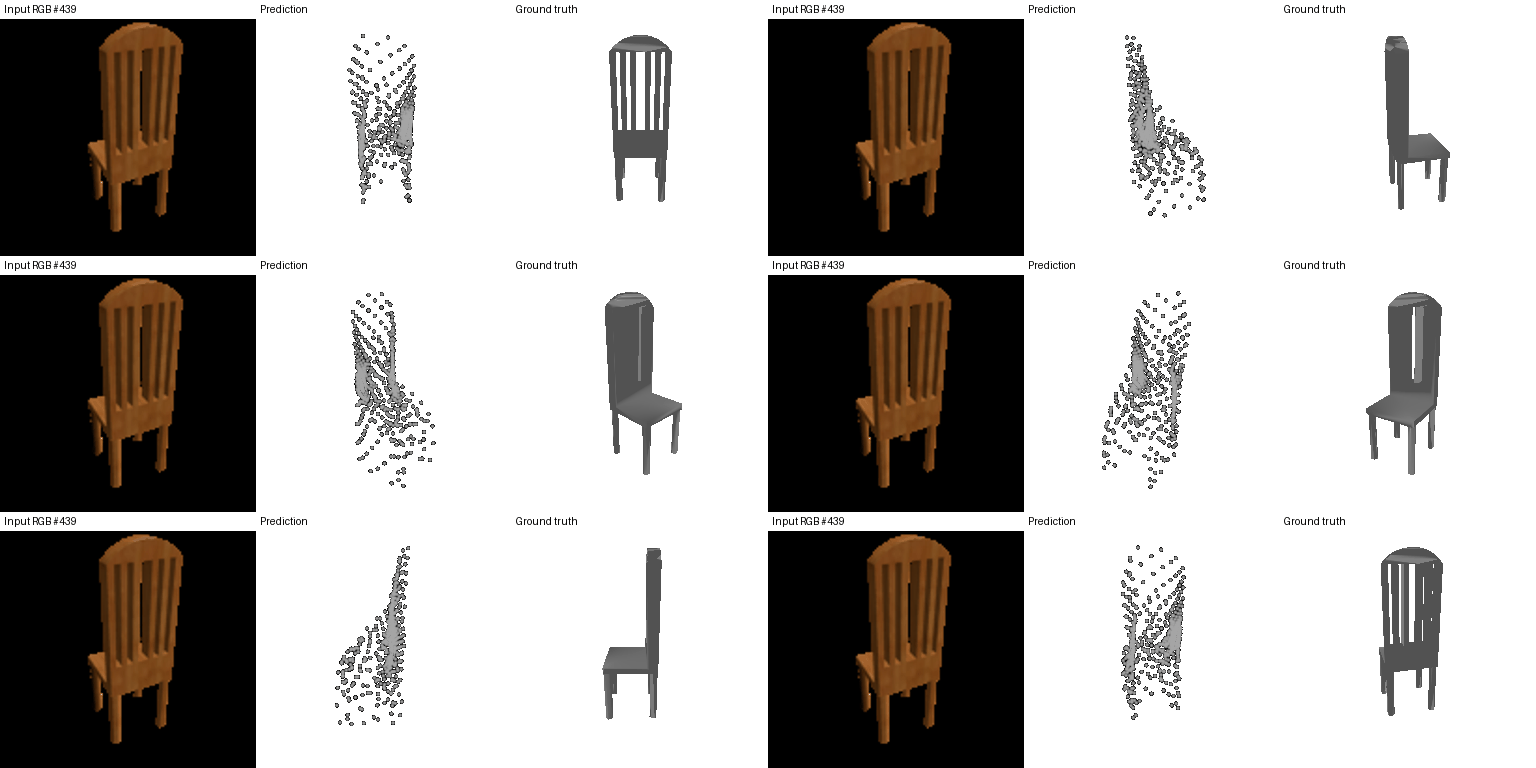
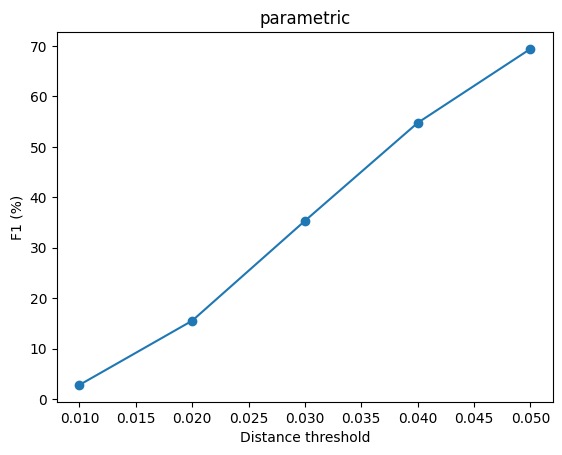
Implicit: 30.49% versus voxel 38.27%. Sampled occupancy supervision and limited spatial detail may affect thin parts. Parametric: 69.42% versus direct points 74.48%. A single patch can fold or bridge disconnected parts. These explanations are hypotheses, not isolated causal tests.