


All models use a pretrained ResNet18 image encoder (512-D feature), batch size 8 and learning rate 4e-4. All F1 scores are on the 678 test chairs. The evaluation is seeded, so every model sees the same camera view of each test chair and the example figures show the same three chairs throughout.
I implemented the voxel loss as binary cross-entropy with logits between the optimized 32x32x32 grid and the target occupancy grid. The source grid starts from random values.

I implemented the Chamfer loss from scratch using knn_points: for every source point I find
its nearest target point and for every target point its nearest source point, and sum the mean squared
distances of both directions.

I deformed an ico_sphere(4) by optimizing a per-vertex offset. The loss is the Chamfer loss
on points sampled from both meshes plus 0.1 times the Laplacian smoothing loss
(mesh_laplacian_smoothing), which keeps neighbouring vertices together.

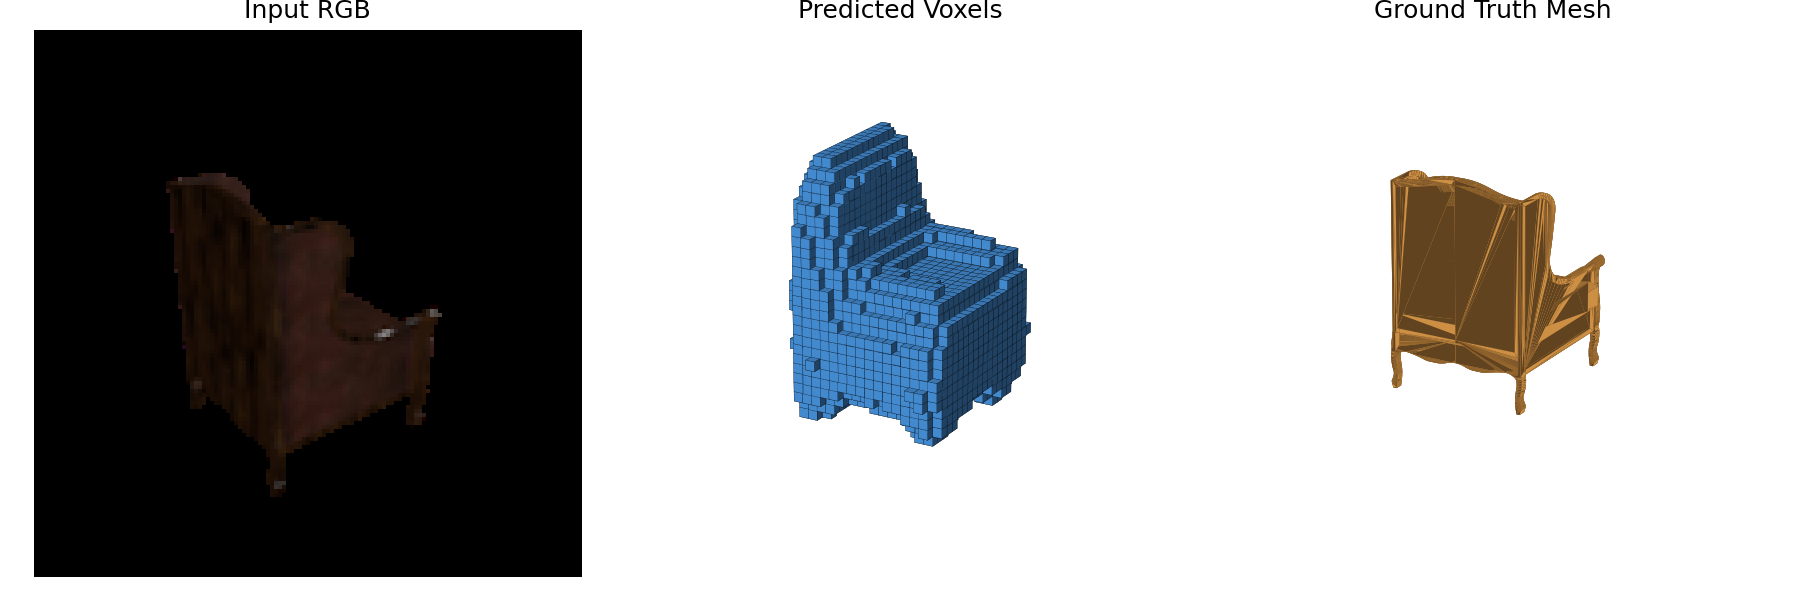
The decoder maps the 512-D feature with a linear layer to a 128x4x4x4 volume, then three 3D transposed convolutions (kernel 4, stride 2, each followed by BatchNorm and ReLU) upsample it to 8, 16 and 32 voxels per side, and a final 1x1x1 convolution outputs one occupancy logit per voxel.
Only about 4.4% of the voxels in a chair are occupied, so plain BCE mostly predicted empty grids. I used BCE
with pos_weight = 4 on the occupied voxels. A weight of 10 overpredicted occupancy (about 13%
of voxels filled), so I kept 4. The model was trained for 10k iterations. For evaluation I apply a sigmoid
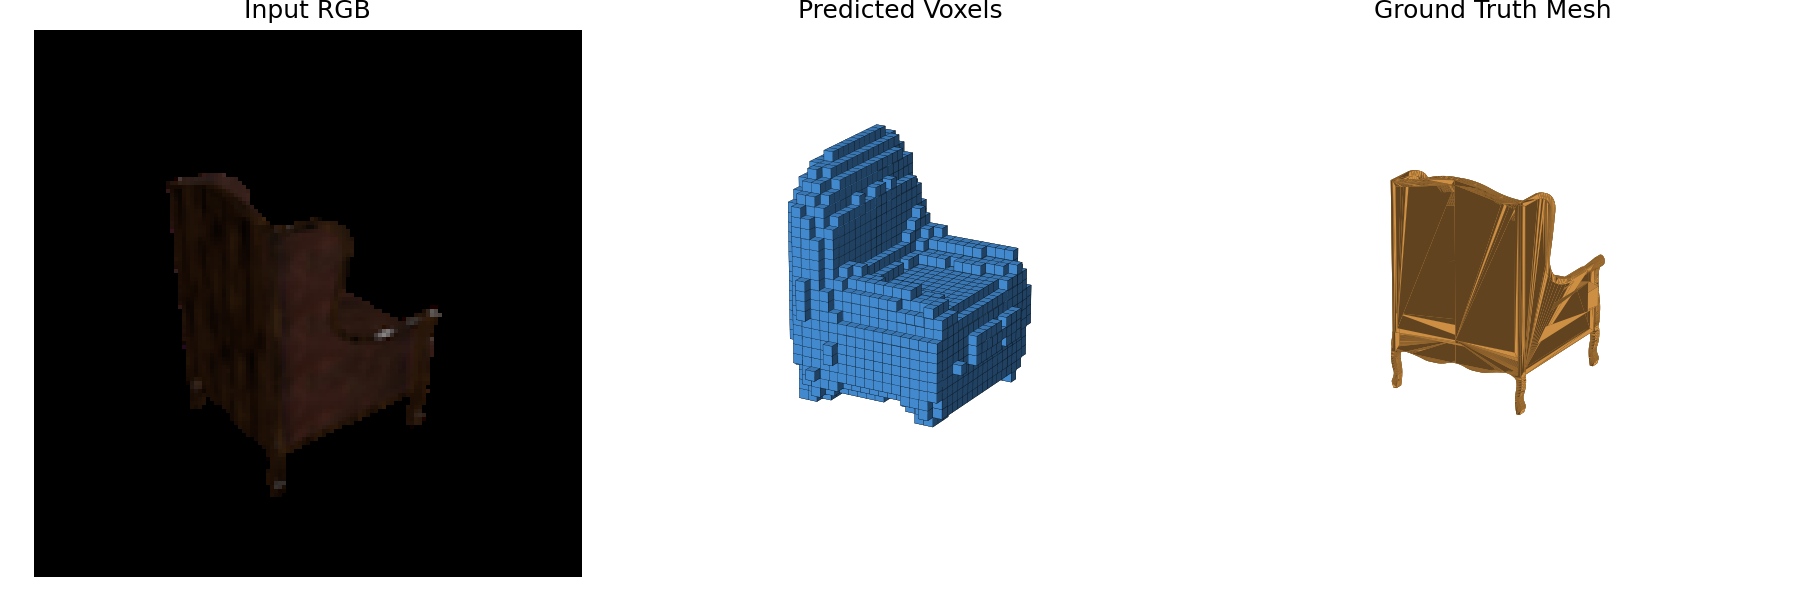
and marching cubes (isovalue 0.5) only to sample points for the F1 metric; the figures show the predicted
voxels directly.
F1@0.05 = 52.2
Input RGB, predicted voxels and ground-truth mesh for three test chairs:



The decoder is an MLP (512 → 1024 → 1024 → 1000x3, ReLU between layers, no activation at the end so coordinates can be negative) whose output is reshaped to 1000 points. It is trained with the Chamfer loss against 1000 points sampled from the ground-truth mesh for 18k iterations.
F1@0.05 = 77.2
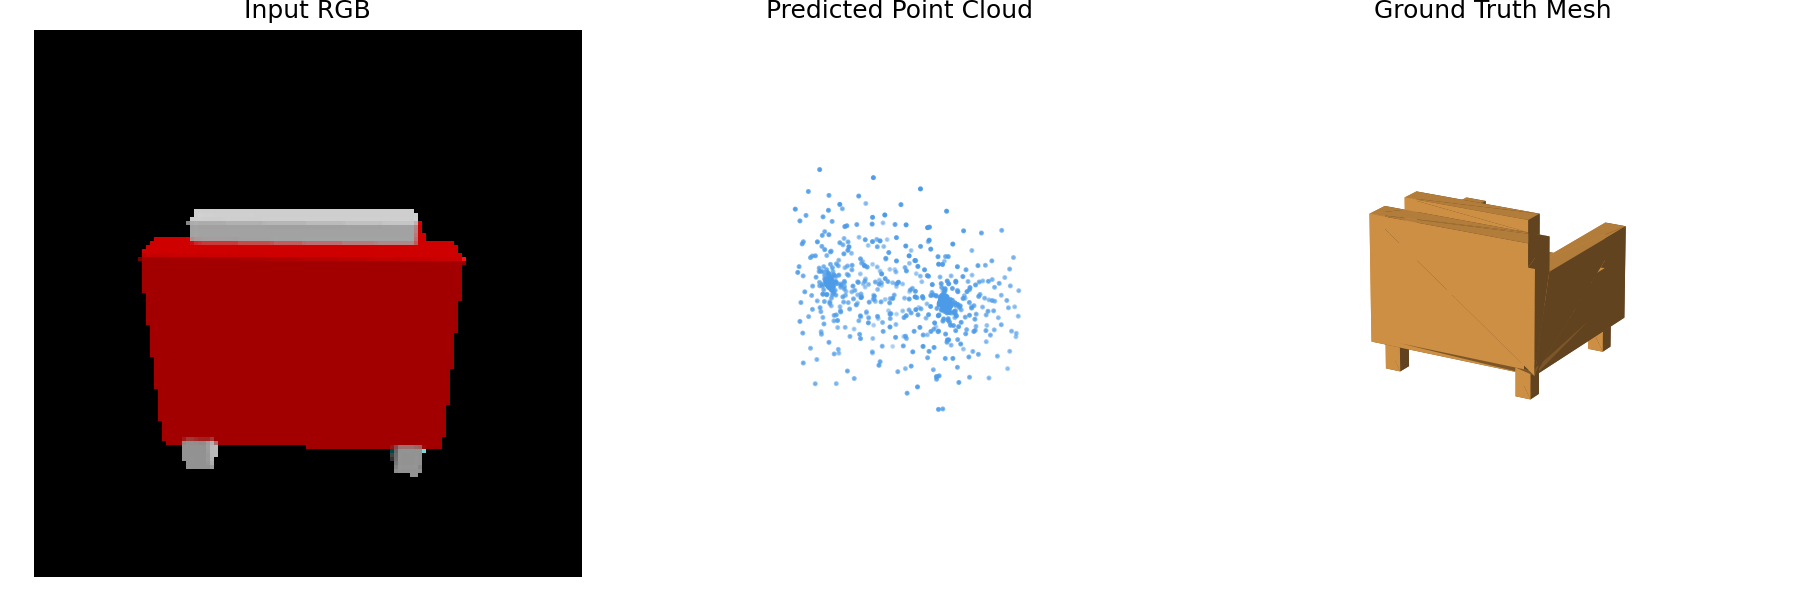

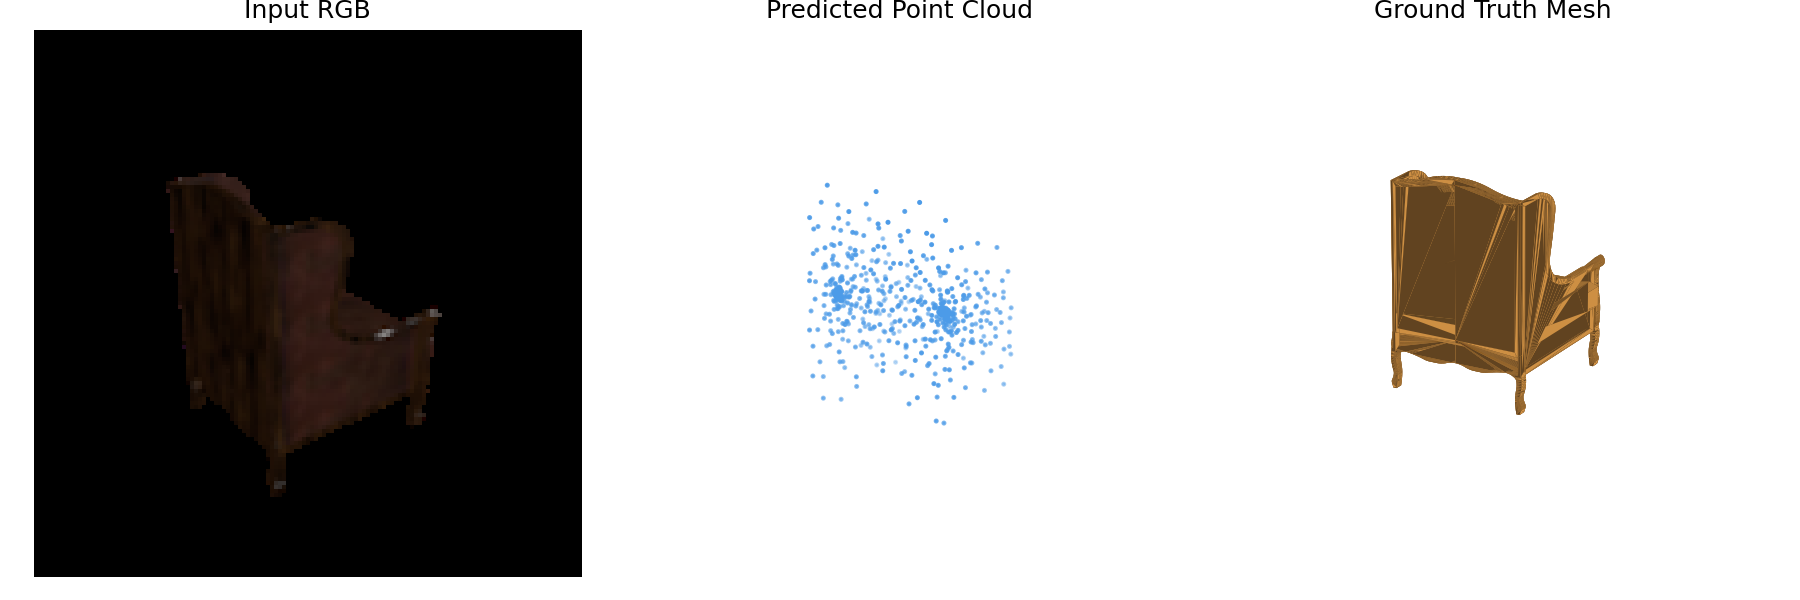
The decoder uses the same MLP to predict an offset for each of the 2562 vertices of an
ico_sphere(4). The loss is Chamfer on 1000 sampled points plus w_smooth times the
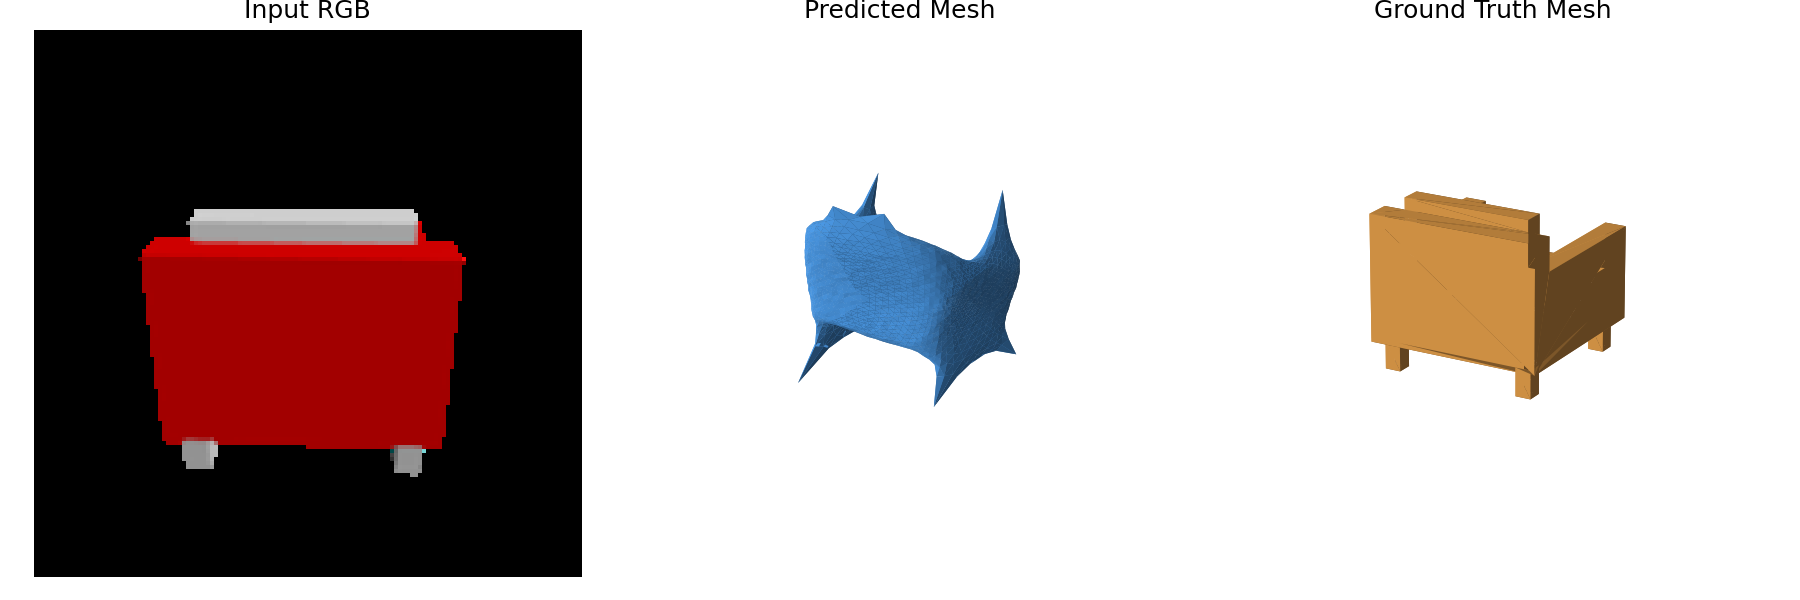
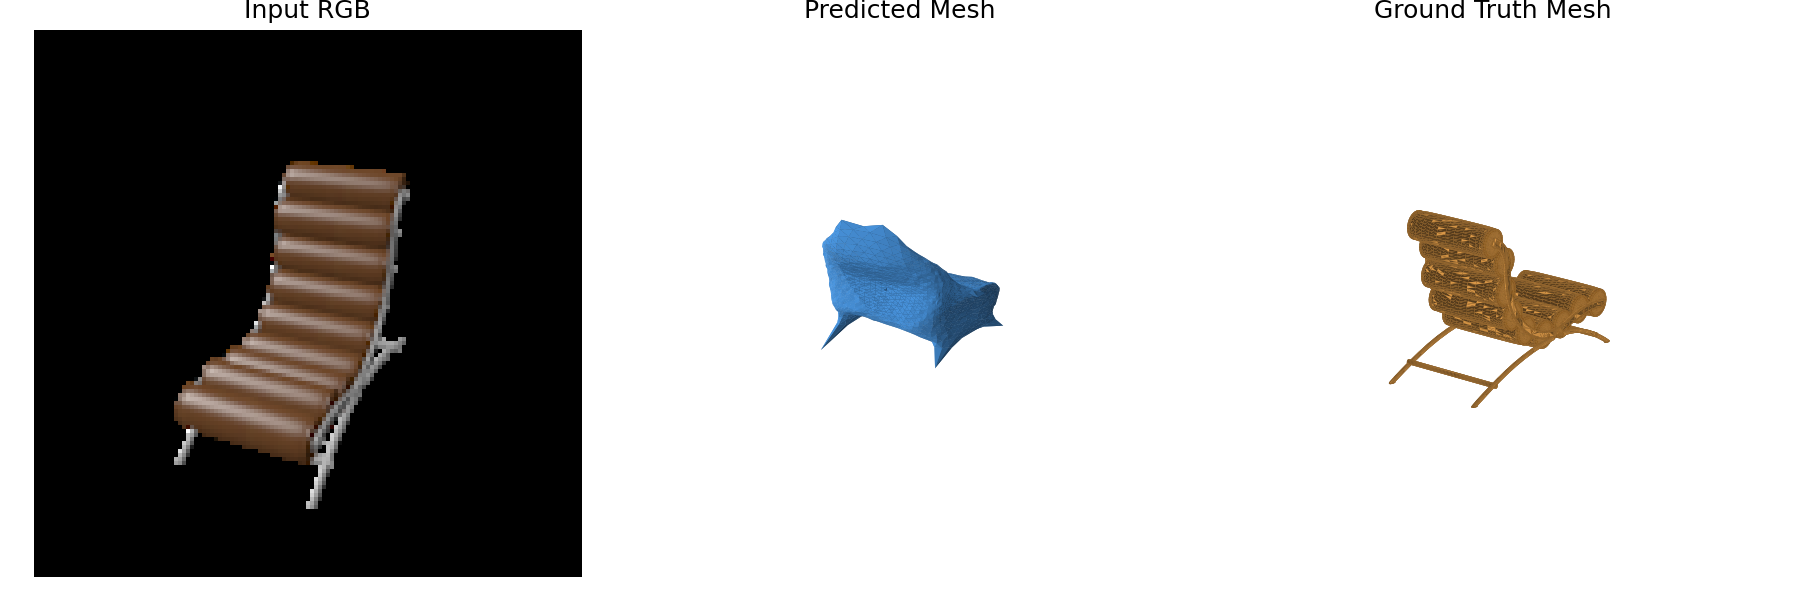
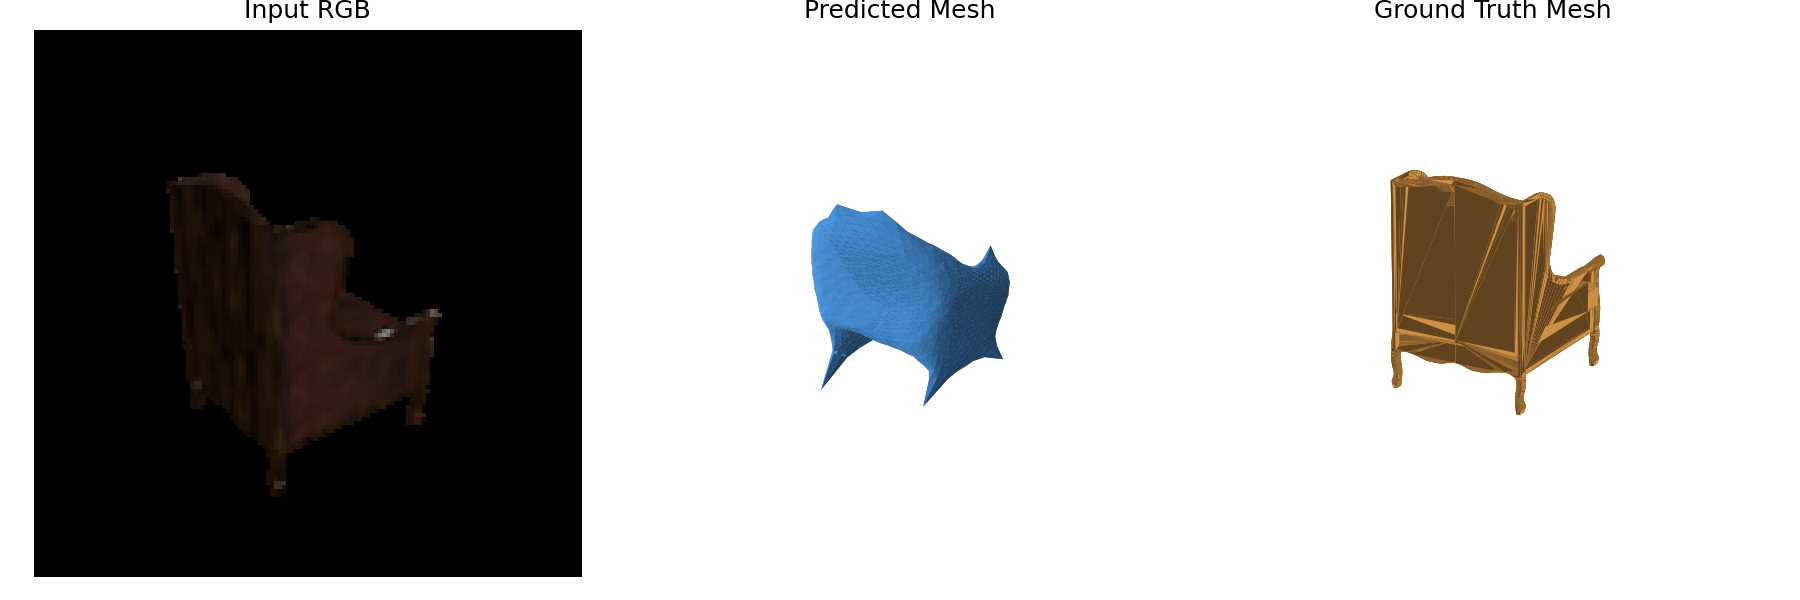
Laplacian smoothing loss. With the default w_smooth = 0.1 the mesh collapsed into a few huge
triangles over a crumpled core (see 2.4), so the final model uses w_smooth = 3. I also
initialised the last layer to zero so training starts from the clean sphere. Trained for 10k iterations.
F1@0.05 = 65.4
| Representation | F1@0.05 |
|---|---|
| Point cloud | 77.2 |
| Mesh | 65.4 |
| Voxel grid | 52.2 |
The point cloud scores highest because every point can move freely and the Chamfer training loss measures almost the same thing as F1. The mesh has to stay one smooth closed surface with the topology of a sphere, so it cannot open holes or form thin separate legs, and the smoothness term trades some accuracy for a valid surface. The voxel grid is limited by its 32³ resolution: thin parts are lost and marching cubes adds quantization error. As a reference, a perfect prediction scores 99.8, while the ground-truth voxels themselves only reach 81.2 through the same voxel evaluation.
I trained the mesh model three times with different smoothing weights, keeping all other settings fixed (10k iterations each), and evaluated them on the same chairs.
| w_smooth | F1@0.05 | Predicted mesh |
|---|---|---|
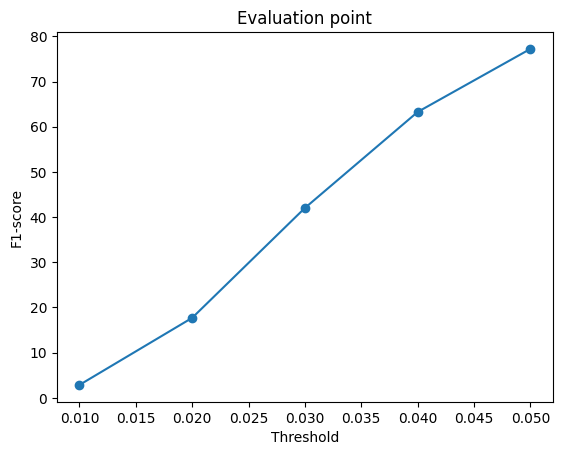
| 0.1 | 68.9 | spiky, self-intersecting: a few huge triangles over a crumpled core |
| 3 | 65.4 | smooth chair-like surface with seat, backrest and leg stubs |
| 10 | 58.6 | smoothest, but a rounded blob that looks similar for every chair |
w_smooth = 0.1:

w_smooth = 3:
w_smooth = 10:

F1 curves for w_smooth = 0.1, 3 and 10.
F1 drops steadily as the smoothing weight increases, because the Laplacian term pulls every vertex towards
the average of its neighbours and the mesh can no longer reach sharp corners or thin parts. However, the
highest F1 belongs to the worst-looking mesh. F1 is computed on points sampled from the surface in
proportion to triangle area, so the w_smooth = 0.1 model covers the chair with a few huge
triangles (about 90% of the surface area is in 5% of the triangles) and hides the rest in a crumpled clump
that is almost never sampled. With too much smoothing (10) the mesh stays close to a sphere and loses what
makes each chair different. w_smooth therefore trades F1 accuracy against surface quality, and a
mesh should be judged by both, not by F1 alone. A weight of 3 gave the best balance.
I analysed the point-cloud model (my best model) with three visualizations.
The middle column colours every ground-truth point by the distance to the nearest predicted point (what the model missed); the right column colours every predicted point by the distance to the nearest ground-truth point (points in the wrong place). Red is above the F1 threshold of 0.05.

The missed parts are the tops of the backrests, the leg tips and the thin metal frame of the lounge chair. The wrong predicted points are mostly below the seat: the model scatters points where legs might be, hedging between plausible shapes because that lowers the expected Chamfer loss.

Over every 5th test chair, I normalised each chair's height to 0 (floor) to 1 (top) and measured the percentage of ground-truth points with no prediction within 0.05. The result is U-shaped: about 40% of the bottom 10% (legs) and 43% of the top 10% (backrest tops) are missed, compared with 15-19% in the middle. The model reconstructs the seat and body well but misses the extremities, which vary the most between chairs.

I fed the same chair from four different views. Averaged over 23 chairs x 4 views, the Chamfer distance between predictions of the same chair from different views is 0.031, between predictions of different chairs 0.060, and between the real different chairs 0.147. The predictions are consistent across viewpoints, so the model predicts in the object's own frame rather than the camera's. But predicted chairs differ from each other only about 40% as much as real chairs do: the model is pulled strongly towards an average chair and partly recognises a typical shape instead of reconstructing every detail (as discussed by Tatarchenko et al., "What Do Single-view 3D Reconstruction Networks Learn?", CVPR 2019).
The implicit decoder is an MLP (input → 256 → 256 → 256 → 1, ReLU) that takes the 512-D image feature together with a 3D query point and outputs an occupancy logit. I query it at every point of a 32x32x32 grid in (-1, 1)³ and reshape the answers into a 32³ grid, so it uses the same weighted BCE loss and the same evaluation as the voxel model. The query point is passed through a positional encoding (the point itself plus sin and cos at 6 frequencies, 39 values), which lets the MLP represent sharp inside/outside boundaries. Trained for 10k iterations.
F1@0.05 = 55.1 (voxel decoder: 52.2)


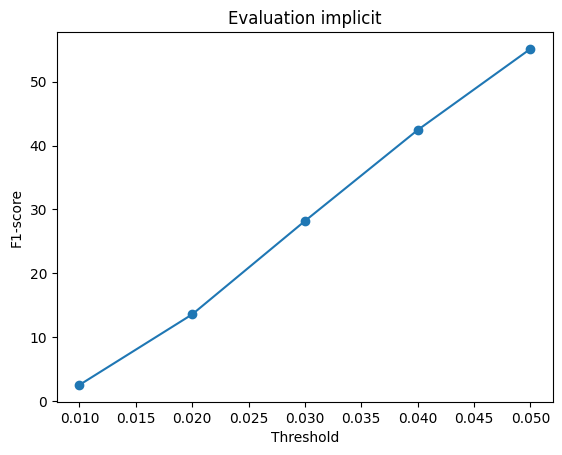
A short comparison of implicit decoder variants (3,000 iterations each):
| Decoder | F1@0.05 |
|---|---|
| Voxel decoder (Q2.1) | 51.6 |
| Implicit, raw xyz | 42.4 |
| Implicit, 512 hidden units | 47.5 |
| Implicit + positional encoding | 48.1 |
| Implicit + positional encoding, 512 hidden units | 44.3 |
With raw xyz the network underfit and sometimes predicted an empty chair, because MLPs are biased towards smooth functions of their input. The positional encoding fixed this at no extra cost. After the full 10k iterations the implicit network outperforms the voxel decoder, and unlike it, it can be queried at any resolution.
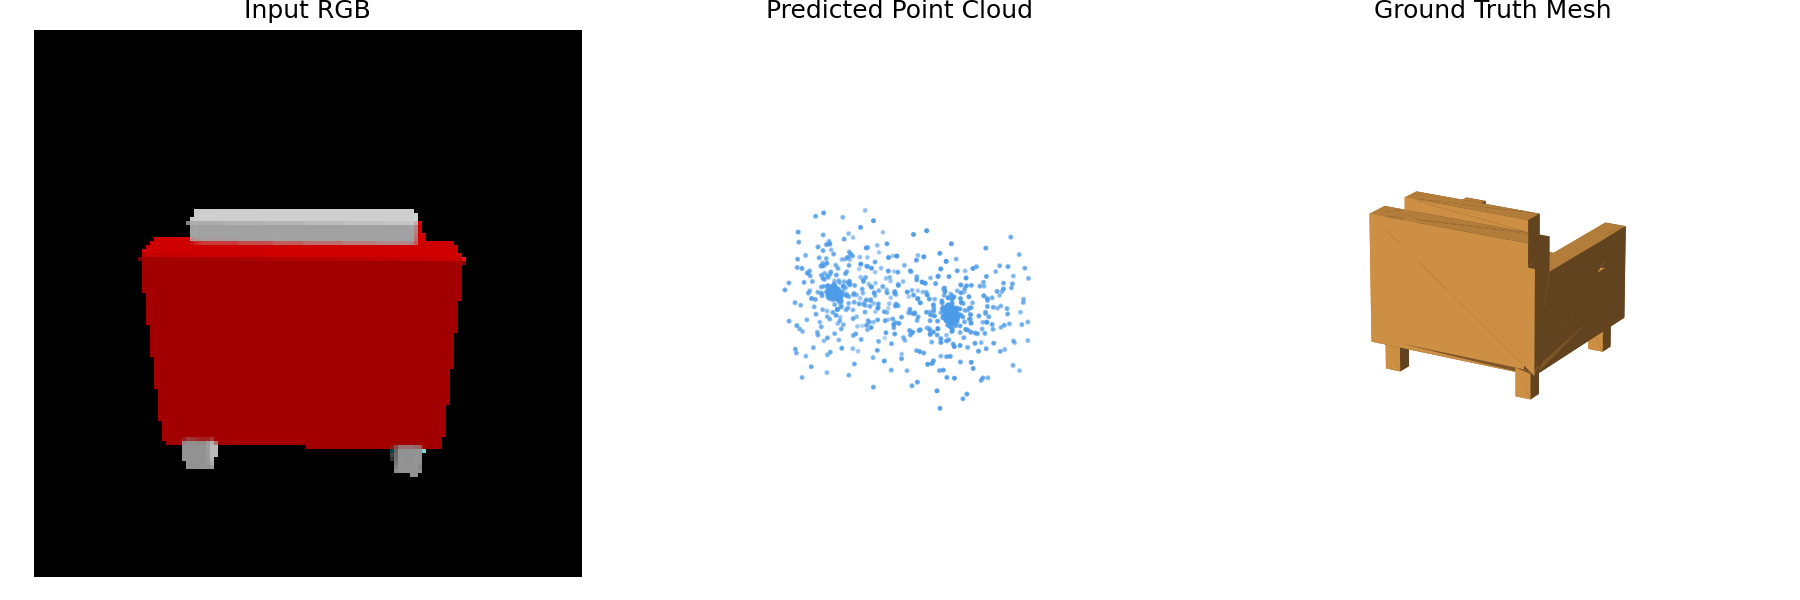
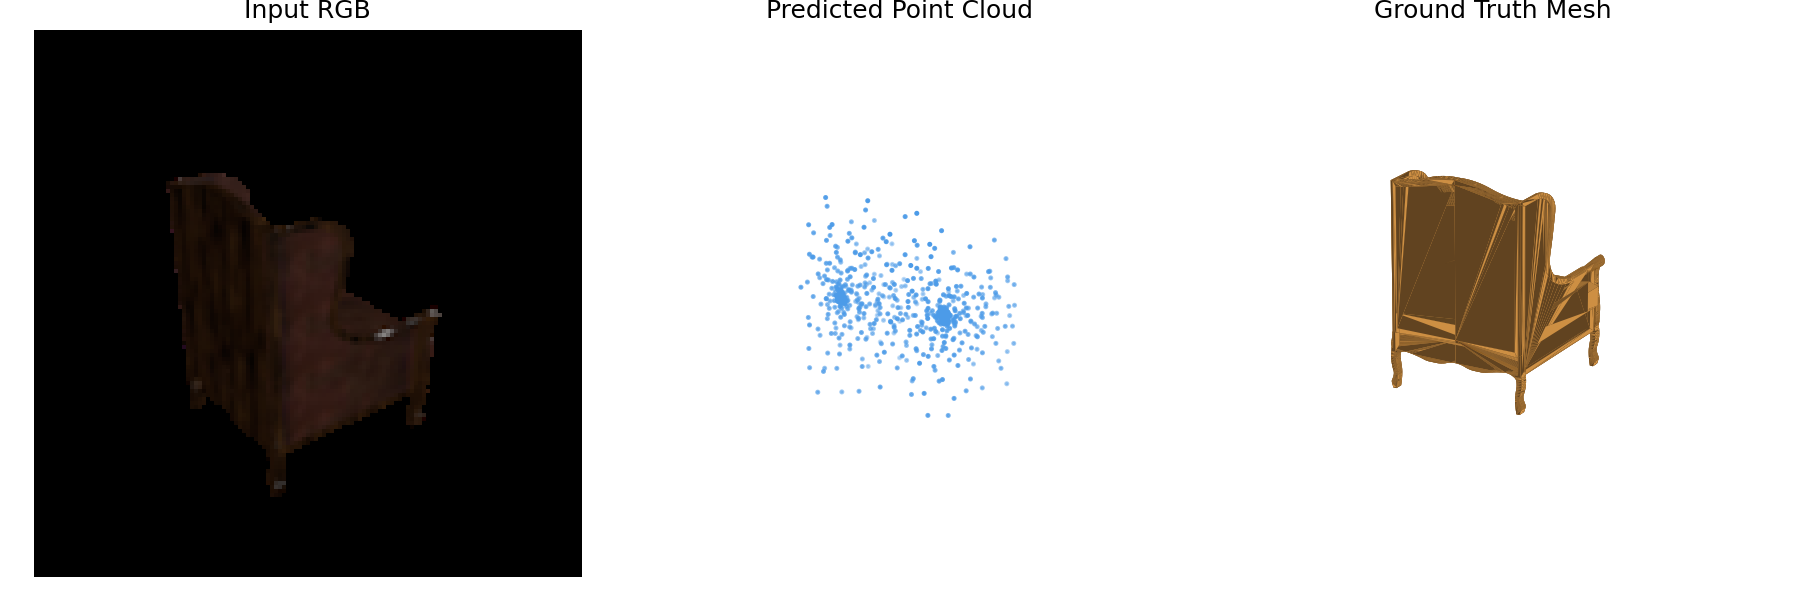
Following AtlasNet, the parametric decoder learns to fold a flat 2D sheet onto the chair. For each image I sample random 2D points (u, v) in [0, 1]², and a small MLP (514 → 512 → 256 → 128 → 3) maps the image feature and (u, v) to a 3D point. I use 10 patches, each with its own MLP and 100 points, giving 1000 points trained with the Chamfer loss for 18k iterations.
F1@0.05 = 74.5 (point MLP: 77.2)
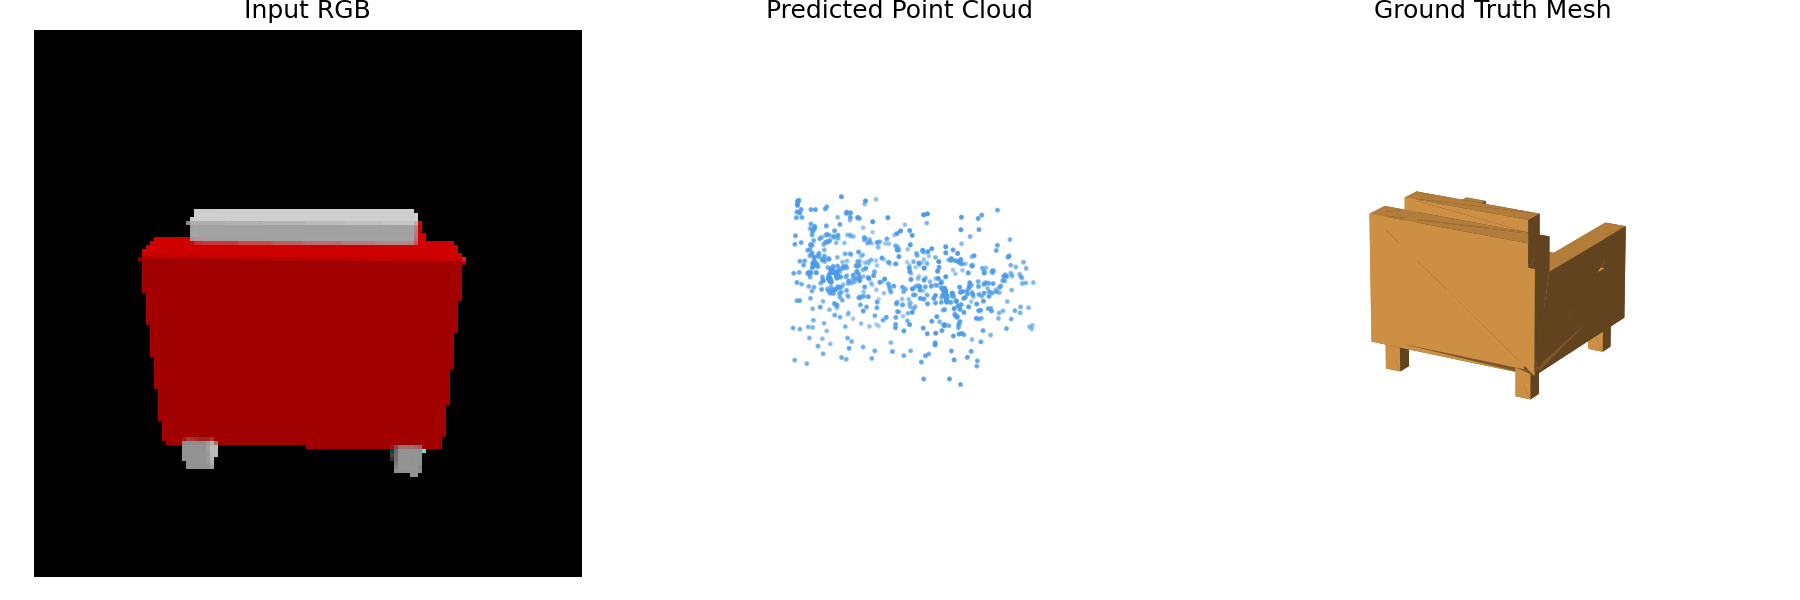
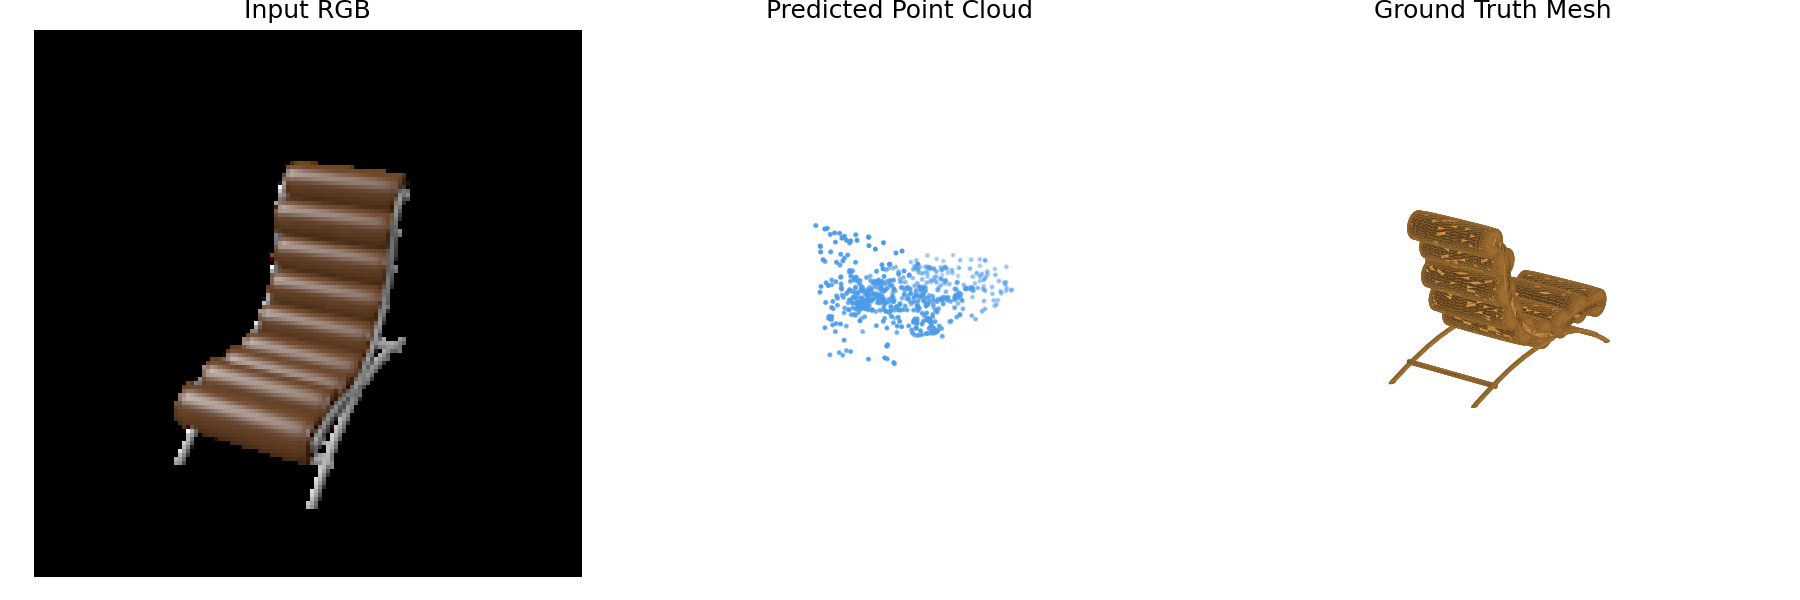
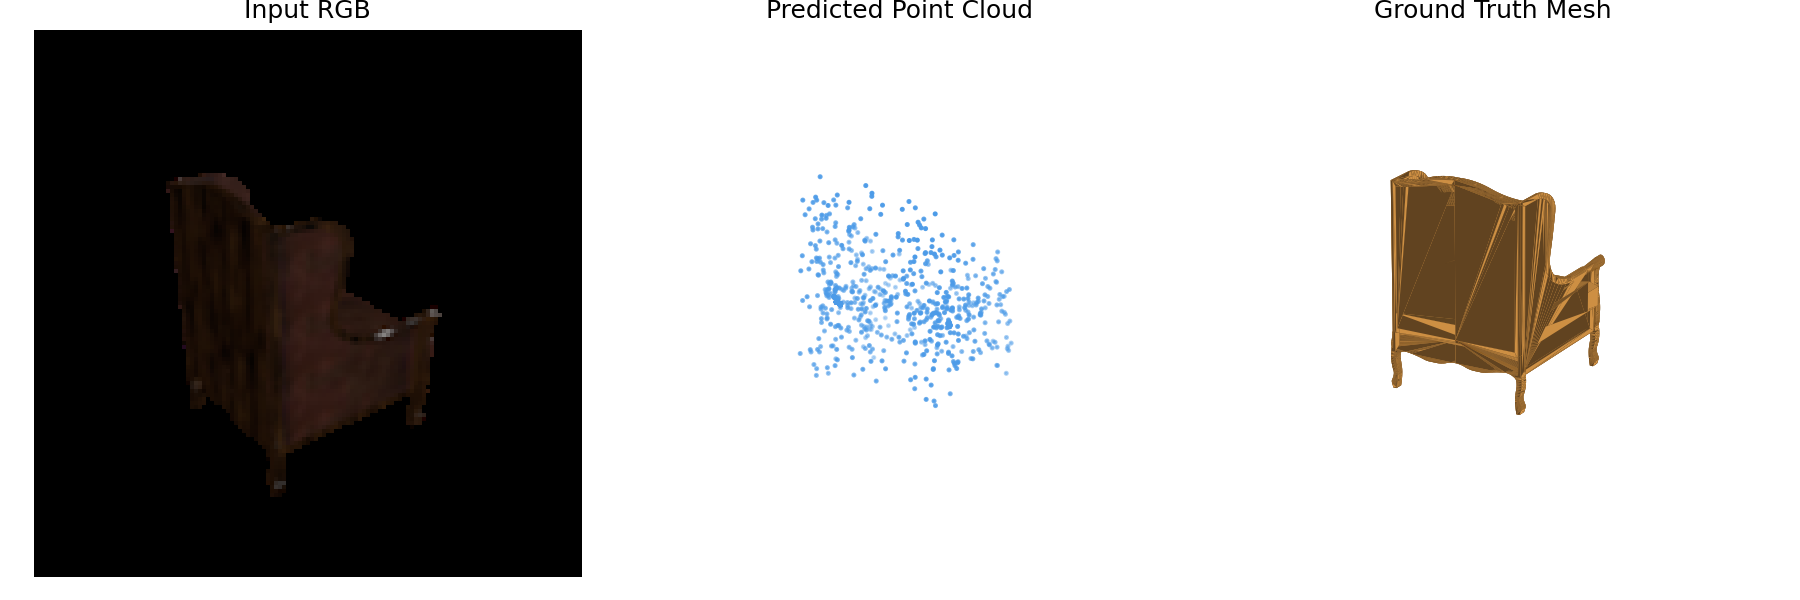
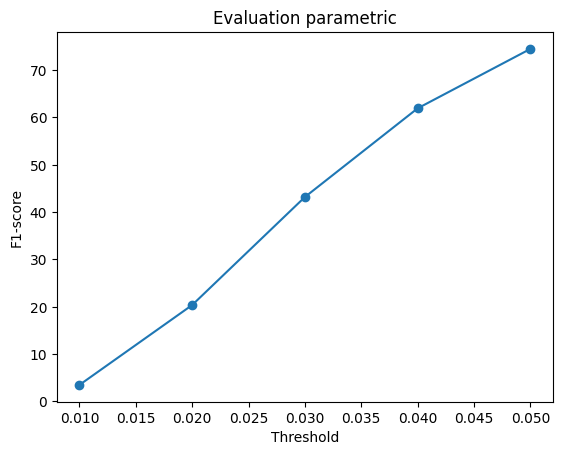
A short comparison (3,000 iterations each):
| Decoder | F1@0.05 |
|---|---|
| Point MLP (Q2.2) | 73.9 |
| Parametric, 1 patch | 61.2 |
| Parametric, 10 patches | 68.1 |
Each patch is a smooth function of (u, v), so its points must lie on a continuous surface. This produces more structured output (with a single patch the flat backrest and seat are clearly visible) but slightly lower F1, because the point MLP can place every point independently and hedge more freely, which Chamfer and F1 reward. More patches cover more of the chair. Because the decoder maps any (u, v) to 3D, the same trained model can be sampled at any resolution without retraining. With 10,000 points instead of 1000 it gives a much denser surface (F1 83.6, not directly comparable to the 1000-point models because more predicted points raise recall):

I trained the point-cloud model on the extended dataset (chair, car and plane) with the same settings as Q2.2 (18k iterations) and evaluated both models on the same 678 test chairs. Chairs are only 47% of the 3-class training set, so the 3-class model saw about half as many chairs.
| Measured on chairs | Trained on chairs | Trained on 3 classes |
|---|---|---|
| F1@0.05 | 77.2 | 76.6 |
| Consistency: same chair, different views | 0.031 | 0.031 |
| Diversity: different chairs, predicted | 0.060 | 0.059 |
| Real chairs' diversity (reference) | 0.147 | 0.146 |
Predictions of the 3-class model for the same three chairs:


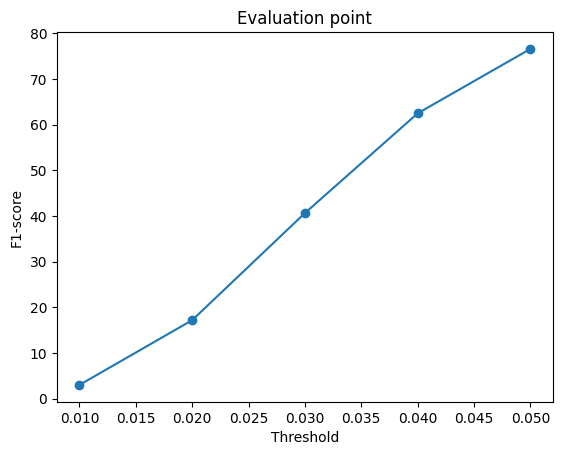
Left to right: misses by height for the 1-class model, for the 3-class model, and the 3-class F1 curve.

Training on three classes barely changed the chair reconstructions: F1 dropped by only 0.6 even though the model saw half as many chairs, the predictions are equally consistent across viewpoints, and they are just as un-diverse (0.06 against 0.15 for real chairs). The average-chair tendency therefore comes from the architecture (one global feature decoded by an MLP) rather than from training on a single class. The small loss appears at the extremities, mainly the backrest tops (about 47% missed compared with 43%). Chairs, cars and planes look very different, so the pretrained features separate them easily and the decoder learns a separate typical shape per class without the classes competing.