Assignment 4: Multi-View Transformers
16-825 Learning for 3D Vision · Fall 2026 · Jinxi He (ginh)
I use the ScanNet++ iPhone subset to implement multi-view geometry, novel-view synthesis with Mini-LVSM, and camera/depth prediction with Mini-VGGT. The Q3 bonus compares 2, 4, and 8 input views. All experiments use 224 training, 28 validation, and 28 test scenes, 224 × 224 images, and seed 825.
Use the menus to compare scenes and settings. Click a figure to enlarge it.
Q1. Multi-View Data Preprocessing (20 points)
1.1–1.2. Intrinsics and depth unprojection
For a resize scale s, I update each axis of the intrinsics with f′ = sf and c′ = s(c + 0.5) − 0.5, matching the image resampling convention. Depth is measured along the camera's optical axis and converted from millimeters to meters. For pixel p = [u, v, 1]T:
Xworld = R Xcamera + t
[R | t] is the camera-to-world pose. Pixels with missing depth are masked out.
1.3. Canonicalization
I transform each camera pose into camera 0's frame with T0−1Ti, then unproject the depth in that frame. I divide translations, points, and depths by the distance to the valid-point centroid. Camera 0 stays at (0, 0, 0) with identity rotation, and the centroid is 1 unit away. The centroid is not subtracted.
Each pair below shows the same eight views before and after normalization. Camera 0's position and the centroid distance are printed below the plots. To keep outliers from shrinking the room, the main plots use the 0.5th–99.5th percentile range on each axis, expanded to include all cameras. The insets show the full point-cloud extent.
036bce3393_frame_004470

076c822ecc_frame_002890

079a326597_frame_007430

07f5b601ee_frame_003630

07ff1c45bb_frame_000460

1.4–1.5. World-space rays and Plücker coordinates
Each ray starts at the camera center o = t and has direction d = normalize(R K−1p). Rotation puts the direction in world coordinates; translation sets the origin. The six-channel Plücker representation is:
The moment describes the line's offset from the origin, distinguishing parallel rays through different camera centers. Moving the origin along the ray leaves it unchanged: (o + αd) × d = o × d.
1.6–1.7. Dataloader and geometry checks
The training loader samples frames in random order from a temporal window; the first selected view is camera 0. Validation and test use fixed views from the prepared frames. The checker passes on four training samples with eight views each. Both point and ray reprojection errors are below 0.01 pixels.
| Check | Measured |
|---|---|
| Training scenes / checked clips | 224 / 4 |
| Views / image size | 8 / 224 × 224 |
| Maximum point reprojection error | 0.0001230203 px |
| Maximum ray reprojection error | 0.0001110857 px |
| Valid depth fraction | 0.75167–0.99031 |
| Valid-point centroid distance | 0.99999994–1.0 |
| RGB / depth batch shapes | (2, 8, 3, 224, 224) / (2, 8, 1, 224, 224) |
| Plücker batch shape | (2, 8, 6, 224, 224) |
Complete check_data.py output
{
  "split": "train",
  "dataset_samples": 224,
  "checked_samples": 4,
  "samples": [
    {
      "sequence_name": "e050c15a8d_frame_007080",
      "views": 8,
      "resolution": 224,
      "valid_depth_fraction": 0.9779127240180969,
      "max_reprojection_error_px": 0.00011009880108758807,
      "max_ray_reprojection_error_px": 0.00010764275066321716,
      "centroid_distance": 1.0
    },
    {
      "sequence_name": "5f99900f09_frame_002820",
      "views": 8,
      "resolution": 224,
      "valid_depth_fraction": 0.9903116226196289,
      "max_reprojection_error_px": 0.00012302029062993824,
      "max_ray_reprojection_error_px": 0.00011108566104667261,
      "centroid_distance": 0.9999999403953552
    },
    {
      "sequence_name": "47b37eb6f9_frame_002720",
      "views": 8,
      "resolution": 224,
      "valid_depth_fraction": 0.9609947800636292,
      "max_reprojection_error_px": 9.881925507215783e-05,
      "max_ray_reprojection_error_px": 8.897326188161969e-05,
      "centroid_distance": 1.0
    },
    {
      "sequence_name": "4c5c60fa76_frame_006690",
      "views": 8,
      "resolution": 224,
      "valid_depth_fraction": 0.7516716122627258,
      "max_reprojection_error_px": 0.00010924567322945222,
      "max_ray_reprojection_error_px": 0.00010257320536766201,
      "centroid_distance": 1.0
    }
  ],
  "batch_shapes": {
    "rgb": [
      2,
      8,
      3,
      224,
      224
    ],
    "depth": [
      2,
      8,
      1,
      224,
      224
    ],
    "depth_valid": [
      2,
      8,
      1,
      224,
      224
    ],
    "K": [
      2,
      8,
      3,
      3
    ],
    "frame_numbers": [
      2,
      8
    ],
    "T_world_from_camera": [
      2,
      8,
      4,
      4
    ],
    "original_world_from_reference": [
      2,
      4,
      4
    ],
    "scene_scale": [
      2
    ],
    "points_world": [
      2,
      8,
      3,
      224,
      224
    ],
    "ray_origins": [
      2,
      8,
      3,
      224,
      224
    ],
    "ray_directions": [
      2,
      8,
      3,
      224,
      224
    ],
    "plucker": [
      2,
      8,
      6,
      224,
      224
    ]
  }
}
Q2. Novel-View Synthesis with Mini-LVSM (40 points)
2.0. Model and training objective
Source tokens contain RGB scaled to [−1, 1] and six Plücker channels; target queries contain only rays. Each target attends to all source tokens and its own queries, with shared 2D positional embeddings. A sigmoid RGB head decodes the query outputs into image patches. The loss is MSE over all target RGB pixels, including those without valid depth.
2.1. Fixed-batch overfit (10 points)
I fit a fixed batch of four training scenes for 2,000 updates. On the same 24 target images, the model reaches 30.9009 dB PSNR, 0.87018 SSIM, and MSE 0.00086950. It captures the viewpoints and colors, though fine details remain blurred and some patch texture is visible.

2.2. Full training and evaluation (30 points)
I train for 100 epochs (5,600 updates) on all 224 training scenes. The final epoch has the best validation PSNR with two sources. Training and validation take 1,545.6 seconds on an RTX 6000 Ada, excluding output overhead; the separate overfit run takes 454 seconds.
| Setting | Mini-LVSM baseline |
|---|---|
| Architecture | Patch size 8; width 384; 8 transformer blocks; head dimension 64; MLP ratio 4; Q/K normalization |
| Parameters | 14,633,408, trained from scratch |
| Data | 8 views: 2 sources + 6 targets; sampling range 32; 224 × 224; batch size 4; seed 825 |
| Optimizer | AdamW; learning rate 2 × 10⁻⁴; weight decay 0.05; β = (0.9, 0.95) |
| Schedule | 100 epochs; 200 warmup steps; cosine decay; gradient clipping 1.0; BF16 autocast |
| Validation | All 28 scenes; fixed 8-view selection from the first 32 prepared frames |

Training visualizations
Each row below shows one target view from the first validation sample. Even at epoch 96, predictions capture mostly room colors and rough layout; edges and textures remain blurred.
Epoch 1

Epoch 26

Epoch 51

Epoch 96

Source-view and target-ray ablations
Using the best checkpoint, I evaluate 1, 2, and 4 source views with correct, shuffled, or zero target rays. Shuffling replaces each target's rays with another target's rays. Weights stay fixed, and PSNR/SSIM are averaged over all target images.
| Sources | Target rays | PSNR ↑ (dB) | SSIM ↑ | Targets |
|---|---|---|---|---|
| 1 | Correct | 15.2007 | 0.5579 | 196 |
| 1 | Shuffled | 11.7994 | 0.4870 | 196 |
| 1 | None (zeros) | 12.4740 | 0.5286 | 196 |
| 2 | Correct | 16.1371 | 0.5600 | 168 |
| 2 | Shuffled | 11.4741 | 0.4718 | 168 |
| 2 | None (zeros) | 12.4465 | 0.5269 | 168 |
| 4 | Correct | 16.8587 | 0.5749 | 112 |
| 4 | Shuffled | 11.5726 | 0.4729 | 112 |
| 4 | None (zeros) | 12.4652 | 0.5369 | 112 |
1 source view · correct rays
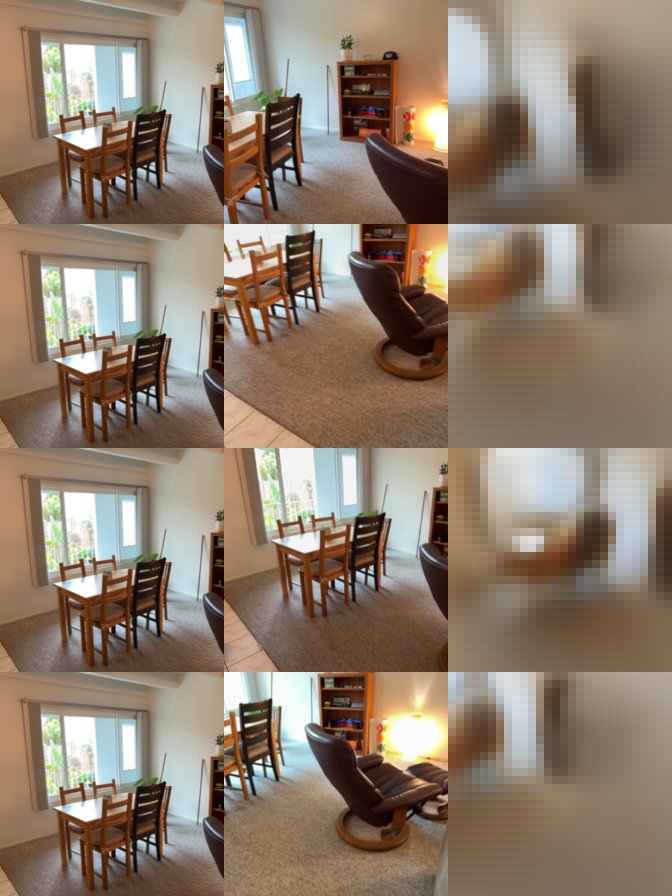
1 source view · shuffled rays
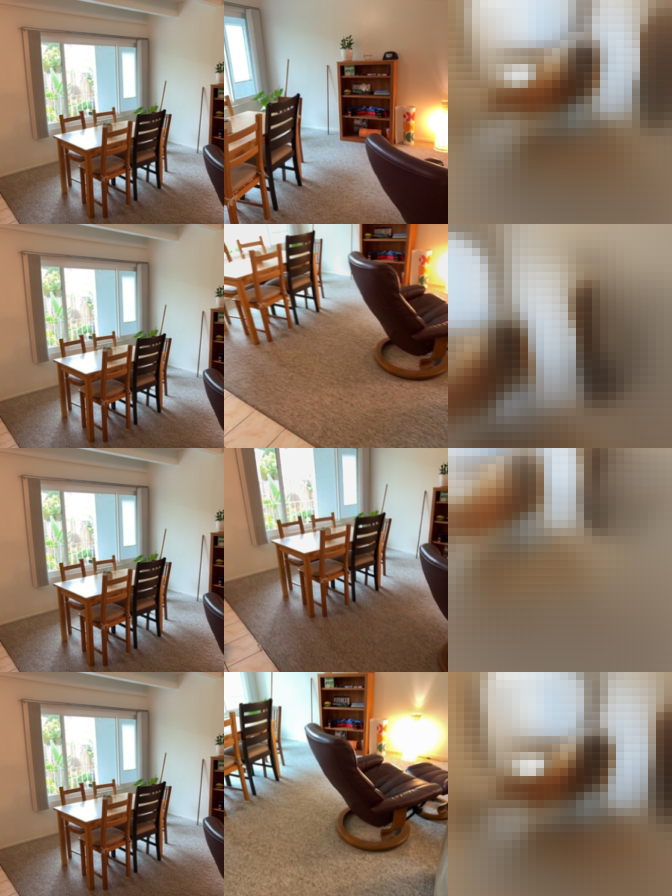
1 source view · zero rays
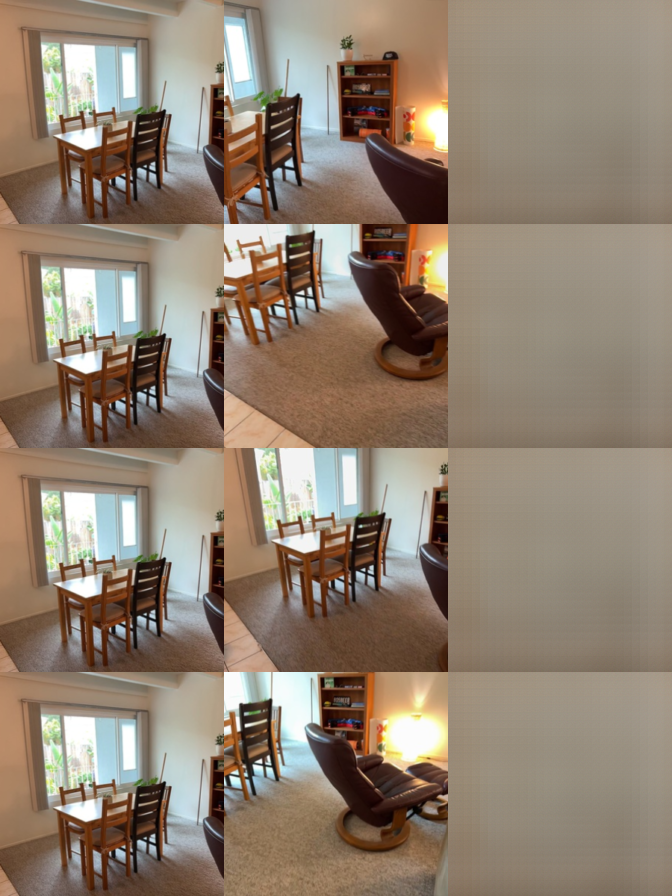
2 source views · correct rays
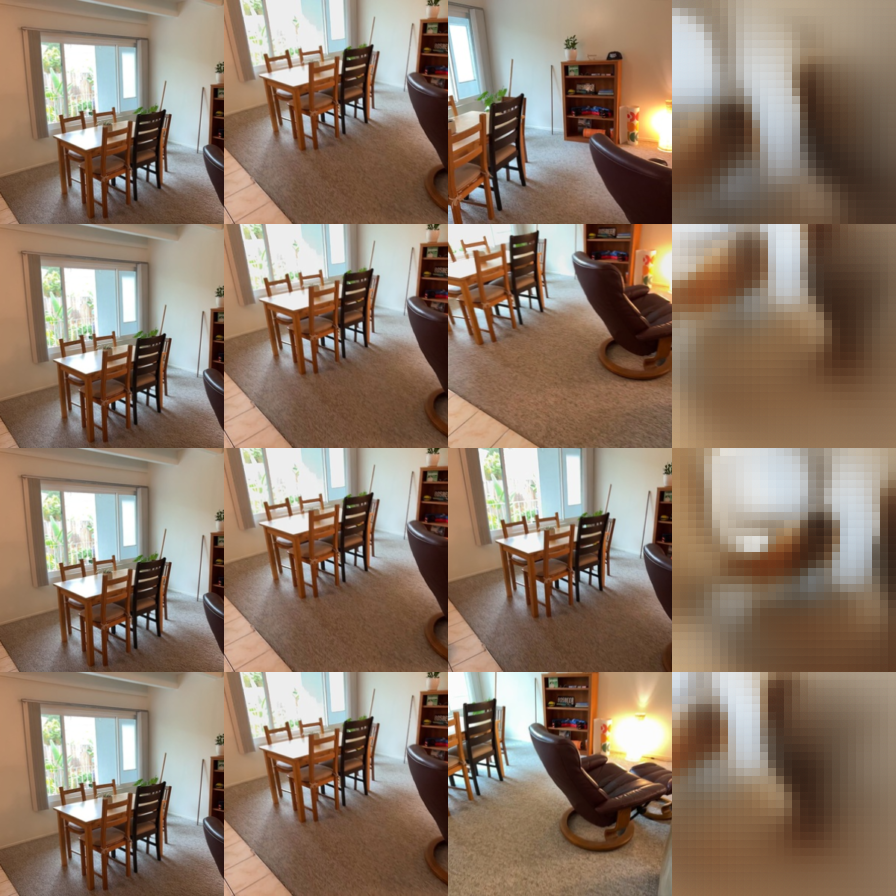
2 source views · shuffled rays
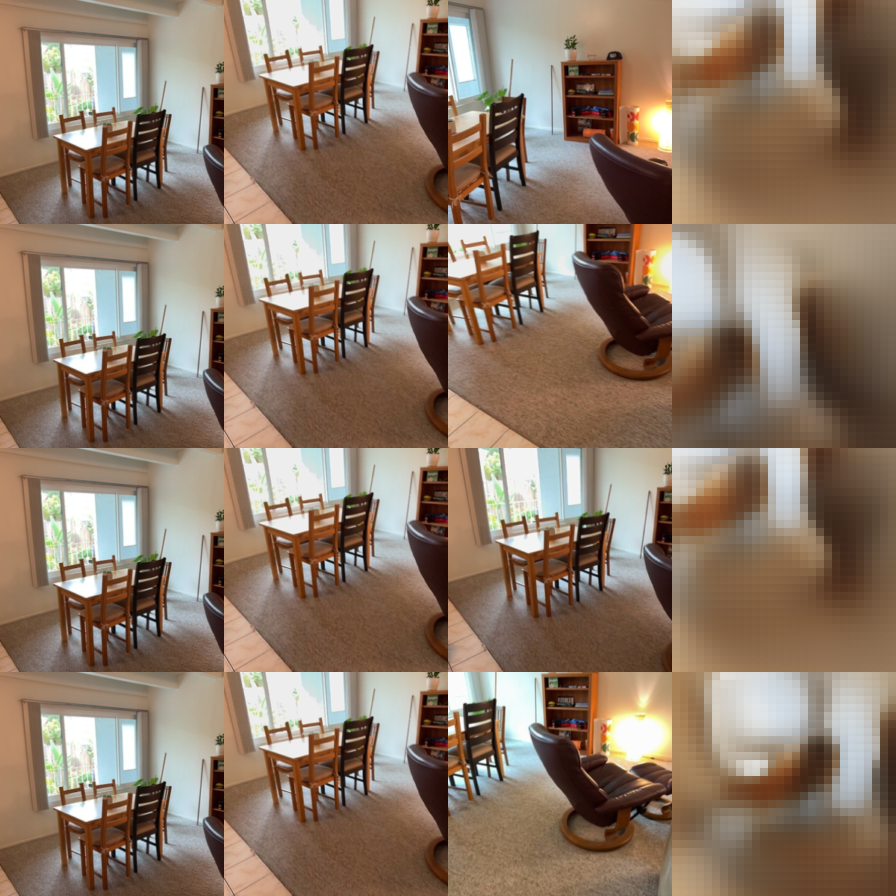
2 source views · zero rays
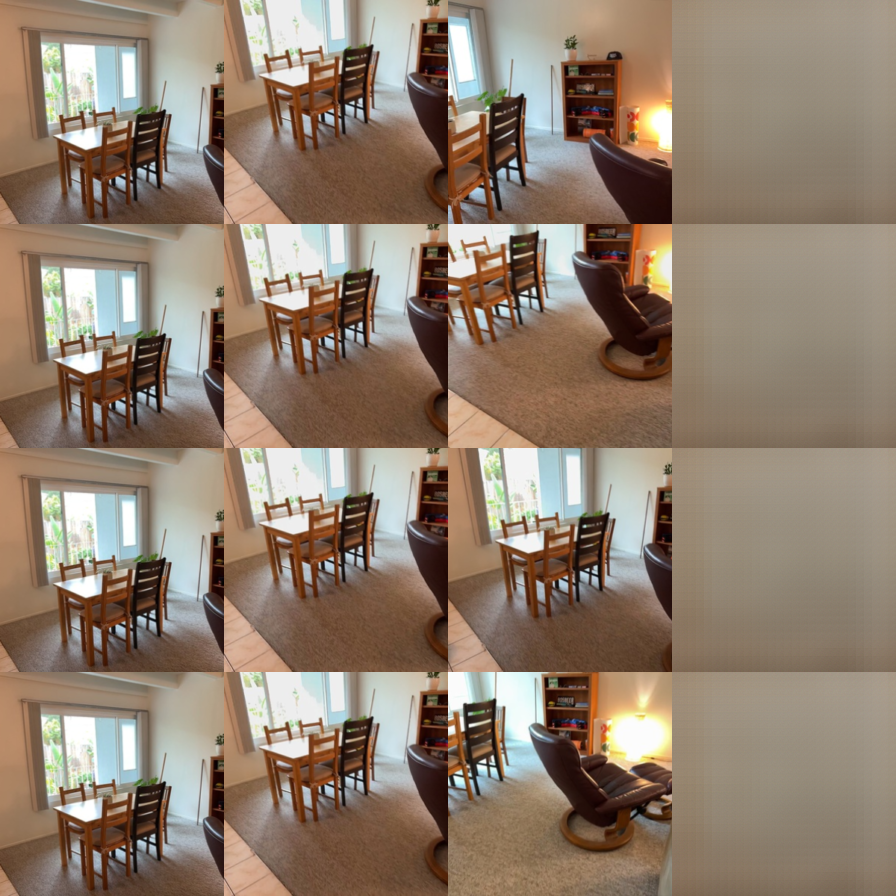
4 source views · correct rays
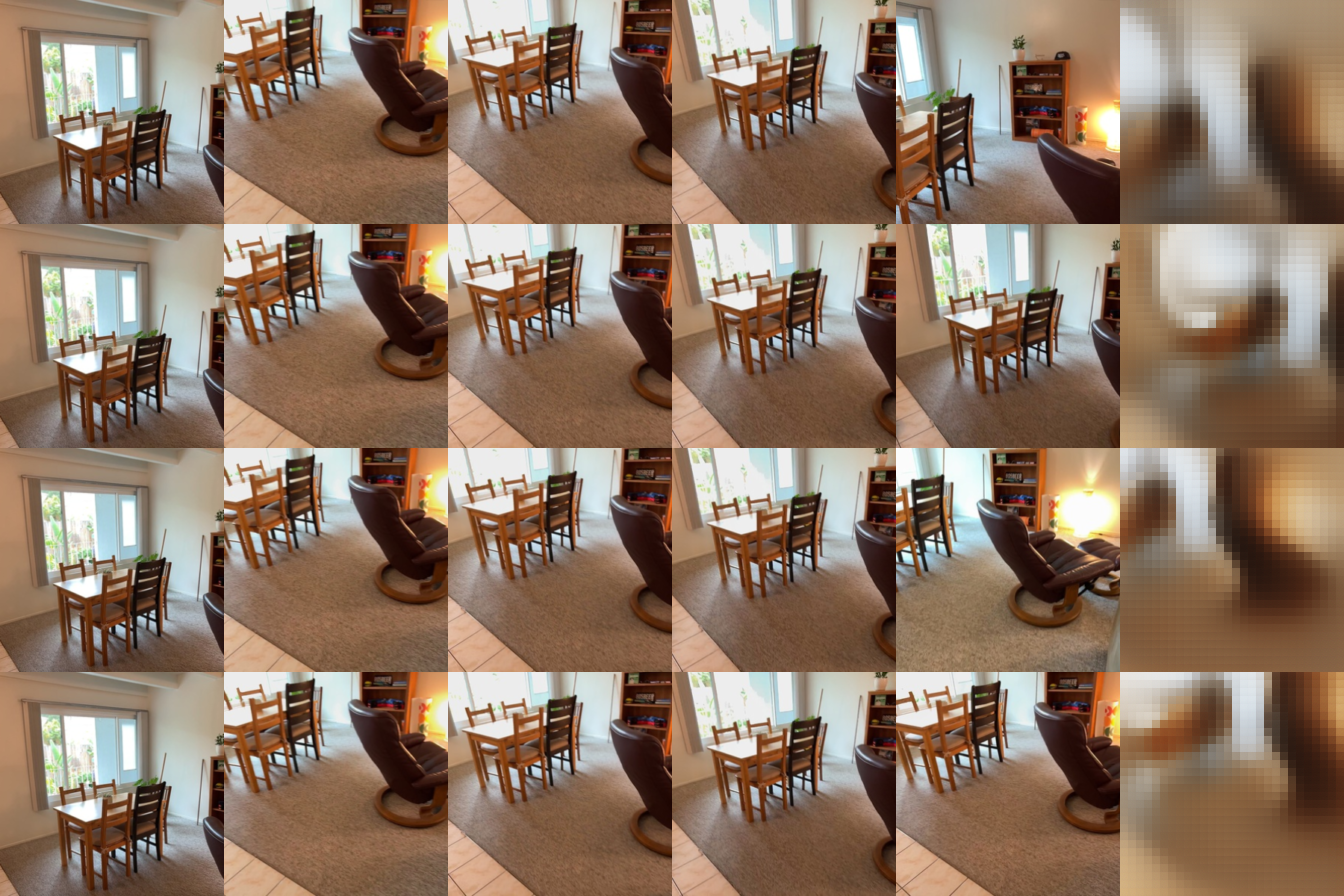
4 source views · shuffled rays
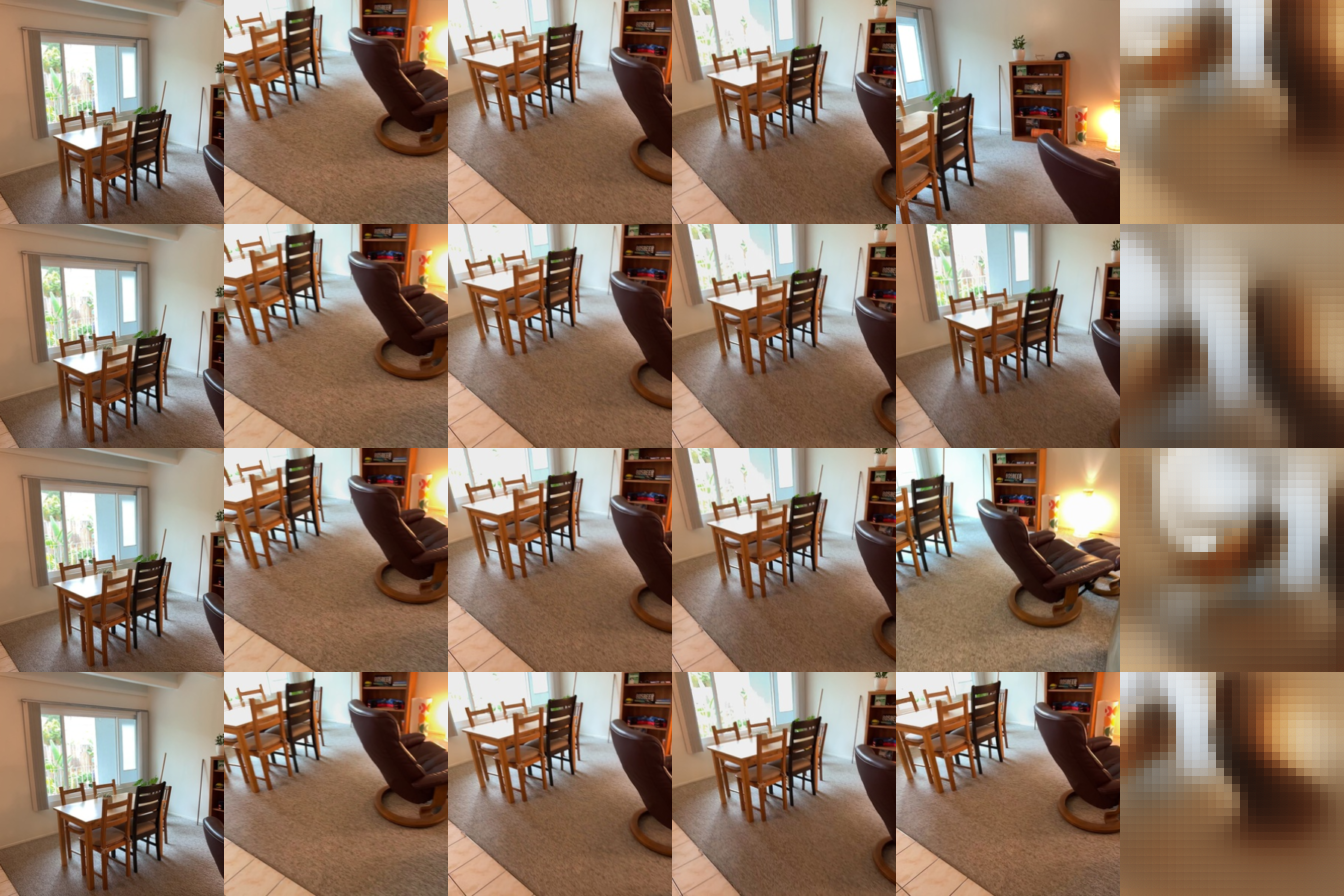
4 source views · zero rays
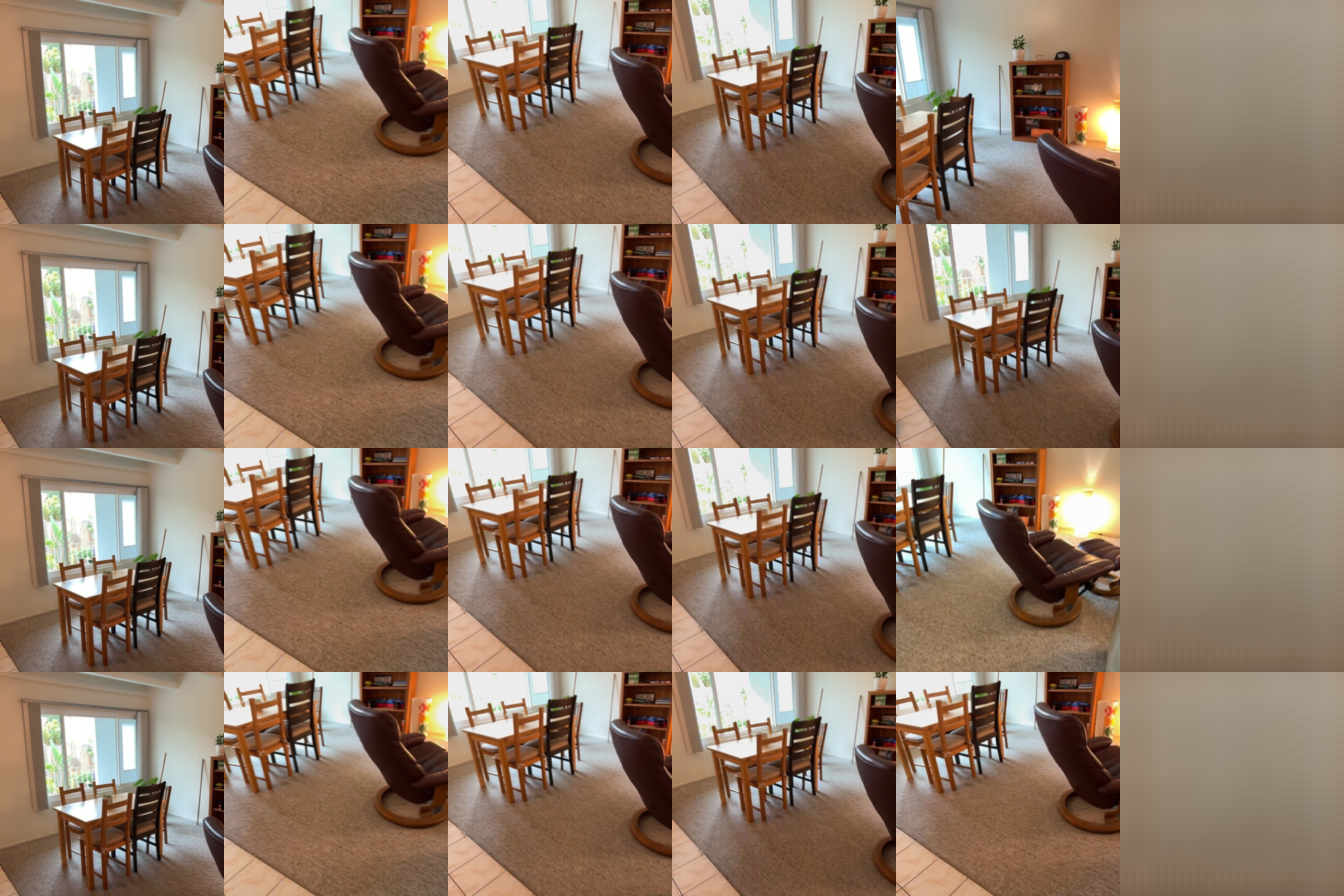
With correct rays, PSNR increases from 15.20 to 16.14 to 16.86 dB for 1, 2, and 4 sources, even though the model was trained with two. The target sets also change (196 / 168 / 112 images), so these scores do not measure the effect of source count alone.
At two sources, shuffled rays reduce PSNR by 4.66 dB and zero rays by 3.69 dB. Incorrect rays hurt more than missing rays at every source count. With zero rays, all targets in a sample have identical queries and produce the same image.
The gap between overfit and held-out quality is large: the model memorizes one batch but produces blurry images on unseen scenes. I did not run the Q2.3 bonus.
Q3. Multi-View Geometry with Mini-VGGT (40 points)
3.0. Model and losses
A frozen DINOv2 ViT-B/14 encodes the RGB images. Eight frame/global attention pairs (width 384, six heads) mix features within each view and then across views. The camera head predicts world-to-camera translation, an XYZW quaternion, and field of view. Decoded patches are refined with RGB to predict depth; a separate projection predicts confidence. I unproject the predicted depth using the predicted cameras to obtain points.
The loss is 5 × camera loss + depth loss. Camera loss combines translation L1 (clamped at 100 per element), raw quaternion L1, and 0.5 × FoV L1. The depth head uses exp(raw depth) and confidence 1 + exp(raw confidence). Depth loss trims the regression and confidence terms separately at the 98th percentile, then adds masked gradient losses at strides 1, 2, 4, and 8. The −0.2 log(confidence) term allows depth and total losses to become negative.
3.1. Single-scene overfit (10 points)
I fit one eight-view training clip for 40 epochs × 25 updates = 1,000 steps, using learning rate 10⁻³, weight decay 0.01, no warmup, and cosine decay to 5% of the initial rate. DINO stays frozen. Epoch 40 has the lowest loss.
| Loss | Before training (epoch 0) | After 1,000 updates |
|---|---|---|
| Total | 5.4835 | −0.177082 |
| Camera | 0.342389 | 0.002675 |
| Depth | 3.77154 | −0.190456 |

| Metric | Fixed training clip |
|---|---|
| Depth AbsRel ↓ | 0.035243 |
| Depth δ1 ↑ | 0.957640 |
| Mean rotation / translation-direction error ↓ | 0.1757° / 0.2876° |
| Joint pose AUC @ 5° / 15° / 30° ↑ | 0.992857 / 0.997619 / 0.998810 |

The camera trajectory and room shape are close to GT, but chair and table boundaries remain smoother. Camera 0 and scene scale are predicted without fitting a pose or scale alignment to GT. These scores measure fit to the training clip.
3.2. Full training and held-out evaluation (30 points)
Full training uses 1,000 epochs / 14,000 updates on 224 scenes. I select epoch 979 by validation loss. On two RTX 6000 Ada GPUs, training and viewer generation take about 2 hours 44 minutes; training/validation compute accounts for 7,310.96 seconds.
| Setting | Mini-VGGT baseline |
|---|---|
| Encoder / transformer | Frozen DINOv2 ViT-B/14; eight frame/global attention pairs; width 384; six heads |
| Parameters | 144,253,394 total; 57,672,914 trainable |
| Data | 8 views; sampling range 32; 224 × 224; seed 825; global batch 16 (8 per GPU) |
| Optimizer | AdamW; learning rate 6 × 10⁻⁴; weight decay 0.01 |
| Schedule | 1,000 epochs; 10 warmup epochs; cosine decay to 5%; BF16 autocast |
| Selection | Minimum validation loss; best epoch 979 (distributed validation loss 0.838922) |
| Evaluation | Full validation and test splits; 8 views from the first 32 prepared frames; 224px; seed 825 |

| Metric | Validation | Test |
|---|---|---|
| Depth AbsRel ↓ | 0.137730 | 0.167025 |
| Depth δ1 ↑ | 0.853522 | 0.790986 |
| Rotation AUC @ 5° ↑ | 0.171684 | 0.171684 |
| Rotation AUC @ 15° ↑ | 0.476361 | 0.479507 |
| Rotation AUC @ 30° ↑ | 0.669430 | 0.678869 |
| Translation AUC @ 5° ↑ | 0.006888 | 0.003827 |
| Translation AUC @ 15° ↑ | 0.060374 | 0.046514 |
| Translation AUC @ 30° ↑ | 0.178146 | 0.154932 |
| Joint pose AUC @ 5° ↑ | 0.001276 | 0.001020 |
| Joint pose AUC @ 15° ↑ | 0.034609 | 0.034184 |
| Joint pose AUC @ 30° ↑ | 0.148469 | 0.134099 |
AbsRel is mean |prediction − GT| / GT over valid depth pixels. δ1 is the fraction with max(prediction / GT, GT / prediction) < 1.25. Pose AUC uses relative camera pairs; translation direction allows sign ambiguity, and joint pose uses the larger rotation or translation error. AUC and δ1 are reported as fractions. Each split has 28 scenes and 784 nondegenerate camera pairs, with 10,347,720 / 10,517,881 valid depth pixels on validation/test.
Re-evaluating the best checkpoint gives validation loss 0.837495, close to the distributed value of 0.838922. Batch grouping affects the trimmed loss, and BF16 rounding can slightly change pose AUC.
Test δ1 is 6.25 percentage points below validation. Translation direction is the larger pose error: 42.35° / 40.41° on validation/test, versus rotation errors of 12.53° / 11.20°, which limits joint pose AUC. Training uses random clips and validation uses fixed frames, so their losses reflect different samples.
Four held-out scene comparisons
The first four validation scenes are shown below. Each GT/prediction pair uses the same eight frames, viewpoint, axis bounds, aspect ratio, and depth colors. I use the GT-valid mask for depth maps and point clouds, with no pose/scale alignment or confidence filtering.
Dining area · 09c1414f1b

The room layout is recognizable, but chairs and tables merge. Surfaces appear in multiple layers, and predicted camera centers are more clustered than GT.
Classroom floor · 21d970d8de
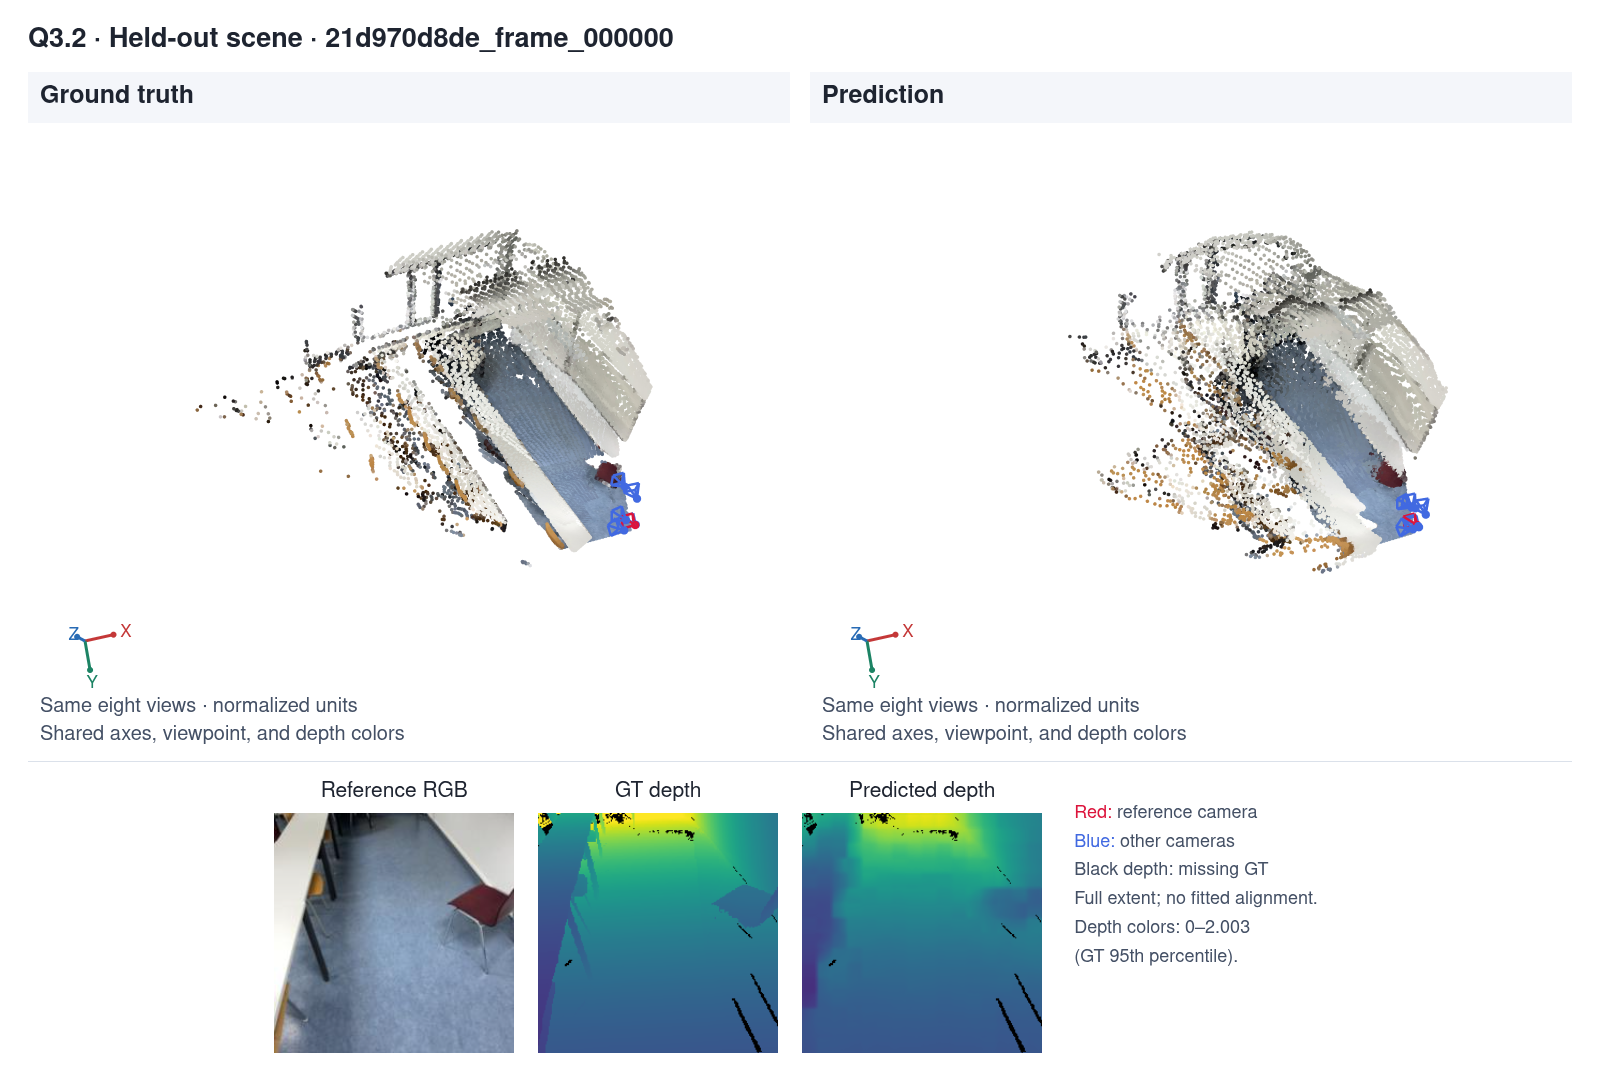
The floor is recognizable, but the point cloud is curved and contracted. Thin furniture parts and sharp depth boundaries are lost.
Hallway · 280b83fcf3

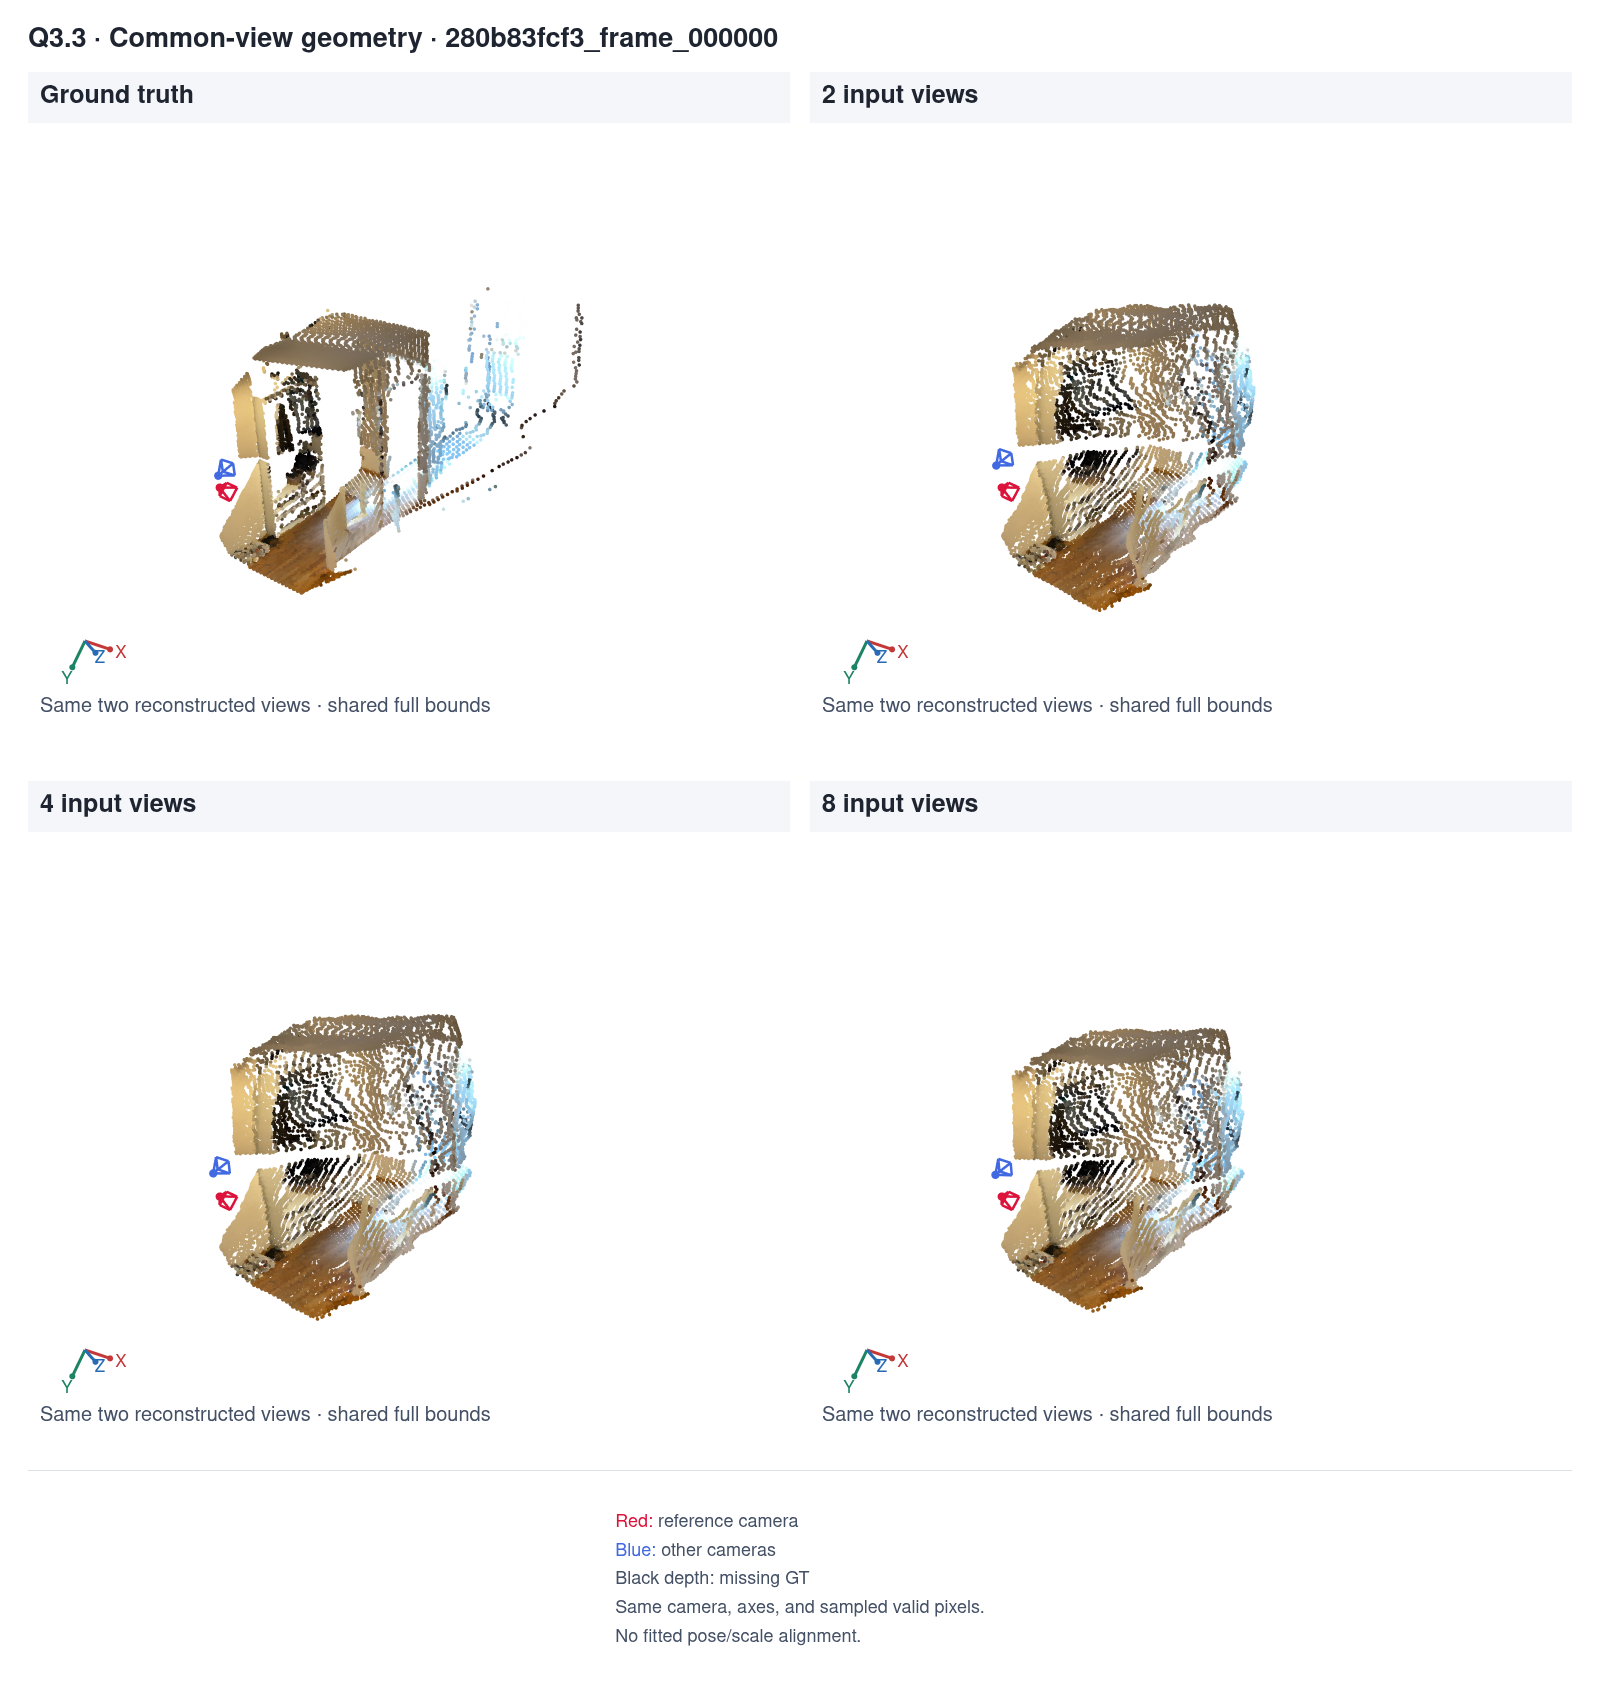
This is the most distorted of the four scenes. Doorways and walls become curved and contracted, and foreground surfaces overlap distant ones.
Office · 2b1dc6d6a5

The chair, wall, and floor keep roughly the right depth order. Chair boundaries blur, surfaces become thicker, and several camera centers deviate from the GT trajectory.
Camera errors and smooth depth can both cause surfaces from different views to misalign. These plots do not separate their contributions.
Q3.3. Bonus: How Many Input Views? (+10 points)
Setup
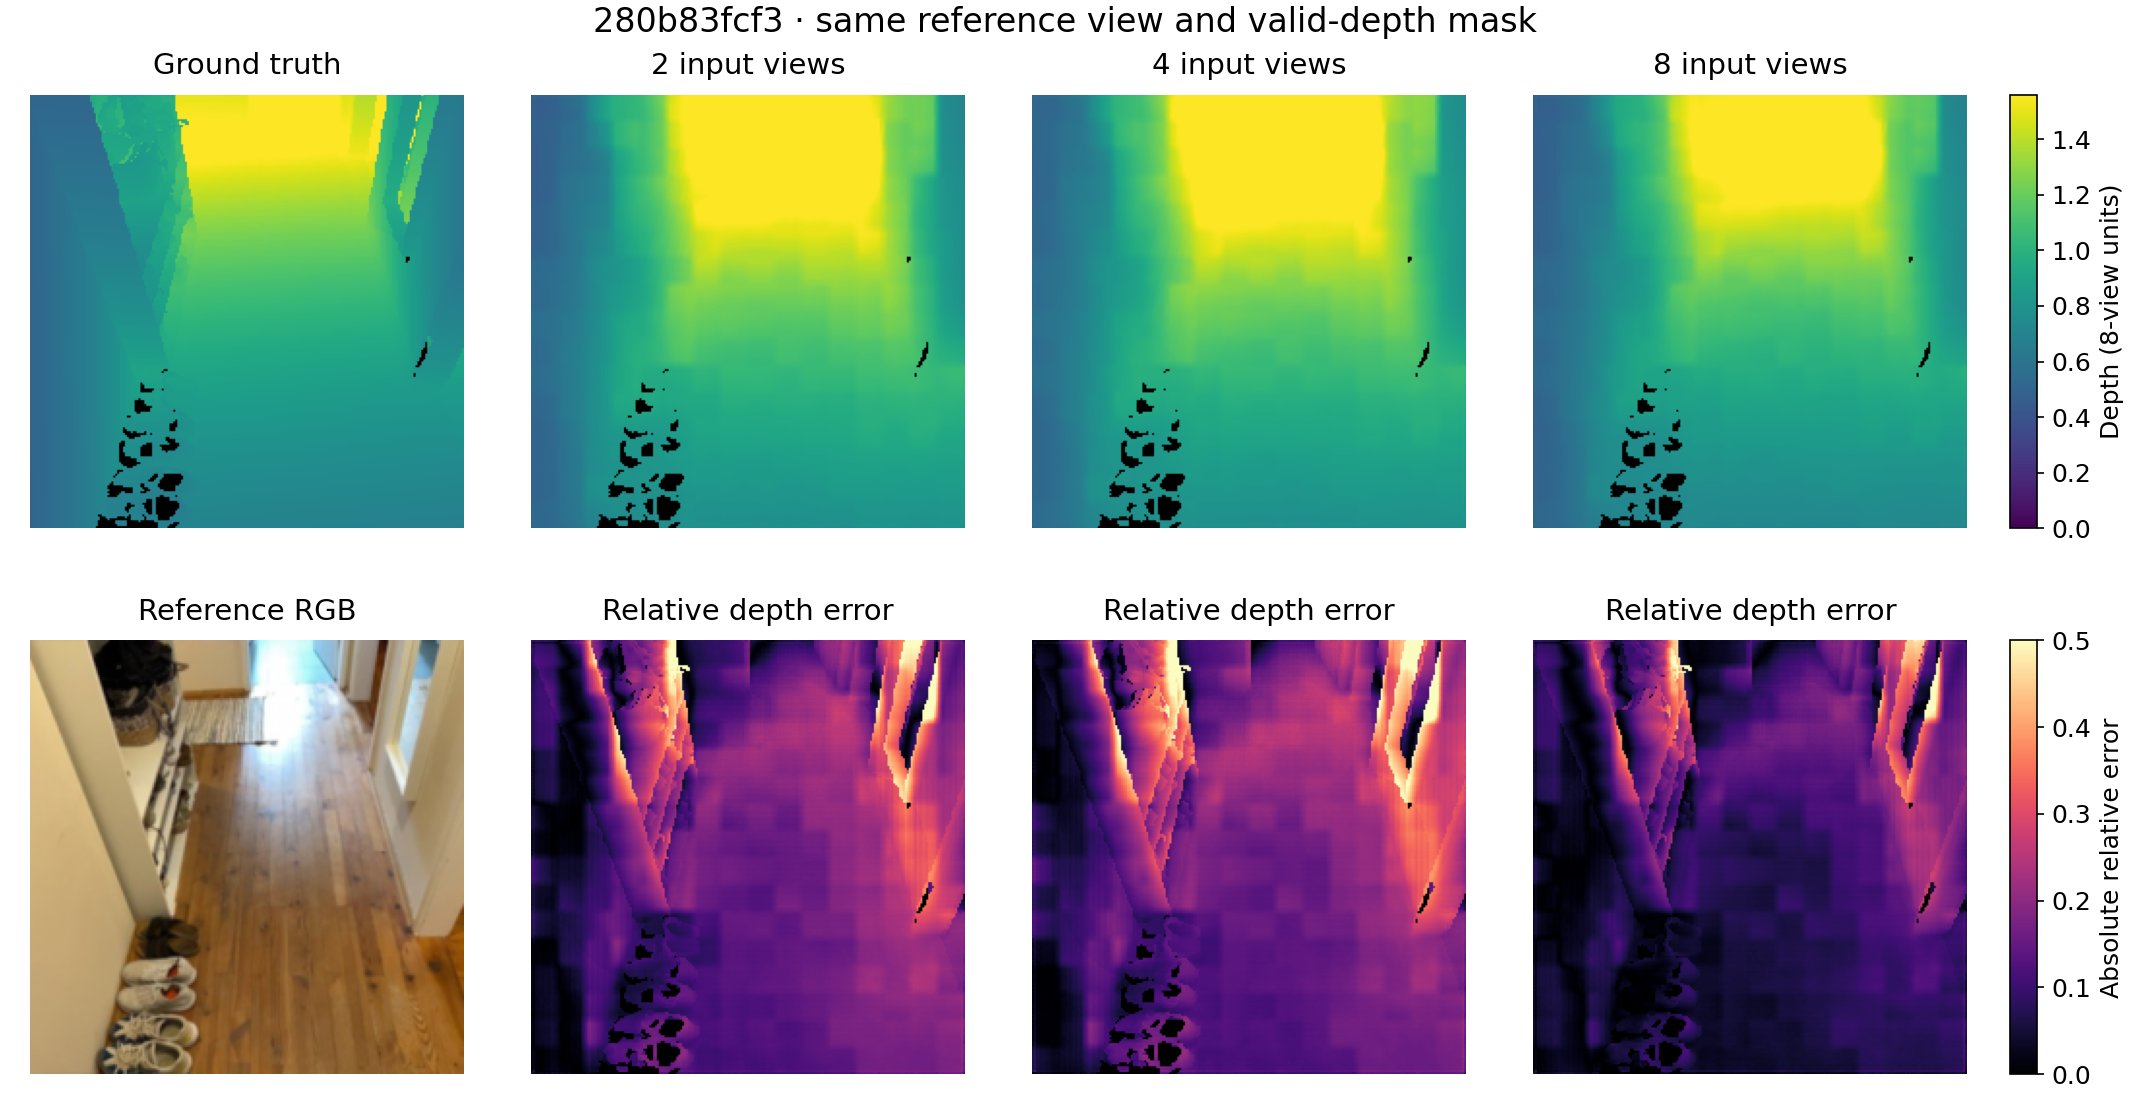
I compare 2, 4, and 8 input views using the epoch-979 checkpoint, which was trained with eight views. For each of the 28 validation scenes, smaller inputs are prefixes of the same eight selected frames. Weights, resolution, frame selection, and seed stay fixed.
I score the same first two views and camera pair at every input count: 2,588,890 valid depth pixels and 28 pose pairs. This keeps the targets fixed while adding input views.
Normalization and evaluated views
The loader normalizes each selected set by its centroid distance, so its scale sV depends on the input count. I multiply predicted depth and translation by sV / s8 to compare them with the eight-view reference GT. This is a unit conversion using the dataset scales, with no fitted alignment. Scaling predictions and targets together leaves relative depth errors and pose angles unchanged. The model receives only RGB, and results are not filtered by confidence.
The result JSON also includes metrics over all input views. Those use different target pixels and camera pairs for each input count, so the table below uses the common first two views.

| Common-view metric | 2 inputs | 4 inputs | 8 inputs |
|---|---|---|---|
| Depth AbsRel ↓ | 0.126824 | 0.136822 | 0.133291 |
| Depth δ1 ↑ | 0.840829 | 0.842878 | 0.871791 |
| Rotation AUC @ 5° ↑ | 0.200000 | 0.200000 | 0.192857 |
| Rotation AUC @ 15° ↑ | 0.490476 | 0.476190 | 0.488095 |
| Rotation AUC @ 30° ↑ | 0.667857 | 0.660714 | 0.658333 |
| Translation AUC @ 5° ↑ | 0.035714 | 0.000000 | 0.007143 |
| Translation AUC @ 15° ↑ | 0.119048 | 0.092857 | 0.092857 |
| Translation AUC @ 30° ↑ | 0.215476 | 0.216667 | 0.209524 |
| Joint pose AUC @ 5° ↑ | 0.000000 | 0.000000 | 0.000000 |
| Joint pose AUC @ 15° ↑ | 0.071429 | 0.071429 | 0.066667 |
| Joint pose AUC @ 30° ↑ | 0.179762 | 0.189286 | 0.184524 |
Going from two to eight inputs raises δ1 by 3.10 percentage points, but worsens AbsRel from 0.126824 to 0.133291. The 90th-percentile relative error improves (0.3018 → 0.2546), while the 99th percentile worsens (0.6380 → 0.8893). Errors above 0.5 increase from 2.49% to 4.35%: more pixels fall within the δ1 threshold, but large errors become worse. At 30°, four inputs give the best joint pose AUC and two give the best rotation AUC.
Runtime and memory
I time BF16 forward passes on a shared RTX 6000 Ada with batch size one and RGB already on the GPU. Each input count gets five warmups per scene and 40 timed passes (four scenes × ten repeats), in randomized order. Timing excludes loading, transfer, and metric computation.
| Inputs | Forward median [IQR], ms | Peak allocated, MiB | Incremental peak, MiB |
|---|---|---|---|
| 2 | 26.701 [26.539, 27.132] | 589.12 | 18.83 |
| 4 | 26.689 [26.573, 26.917] | 605.08 | 34.80 |
| 8 | 26.573 [26.461, 26.758] | 640.33 | 70.04 |
The timing IQRs overlap, so there is no clear speed difference on this shared GPU. From two to eight views, peak allocated memory rises by 8.7% and the increase above resident model/input memory grows 3.72×. These are PyTorch tensor allocations; they exclude reserved memory, CUDA context, and other processes.
Variation across scenes
I bootstrap the 28 scenes 10,000 times with replacement (seed 825). Each scene has equal weight here, whereas the main depth scores weight every valid pixel equally. All 95% confidence intervals for the changes include zero.
| Comparison | Metric | Mean change | 95% paired bootstrap CI | Scenes improved |
|---|---|---|---|---|
| 4 minus 2 inputs | AbsRel | +0.010369 | [-0.014640, +0.038634] | 14/28 |
| 4 minus 2 inputs | δ1 | +0.000659 | [-0.049558, +0.060139] | 12/28 |
| 8 minus 2 inputs | AbsRel | +0.006474 | [-0.021444, +0.039140] | 15/28 |
| 8 minus 2 inputs | δ1 | +0.029580 | [-0.013627, +0.097112] | 15/28 |
Eight inputs improve AbsRel in 15/28 scenes. In the worst case,
88627b561e, AbsRel rises from 0.4247 to 0.7688. More views do not help consistently
across scenes.
Depth, error maps, and geometry
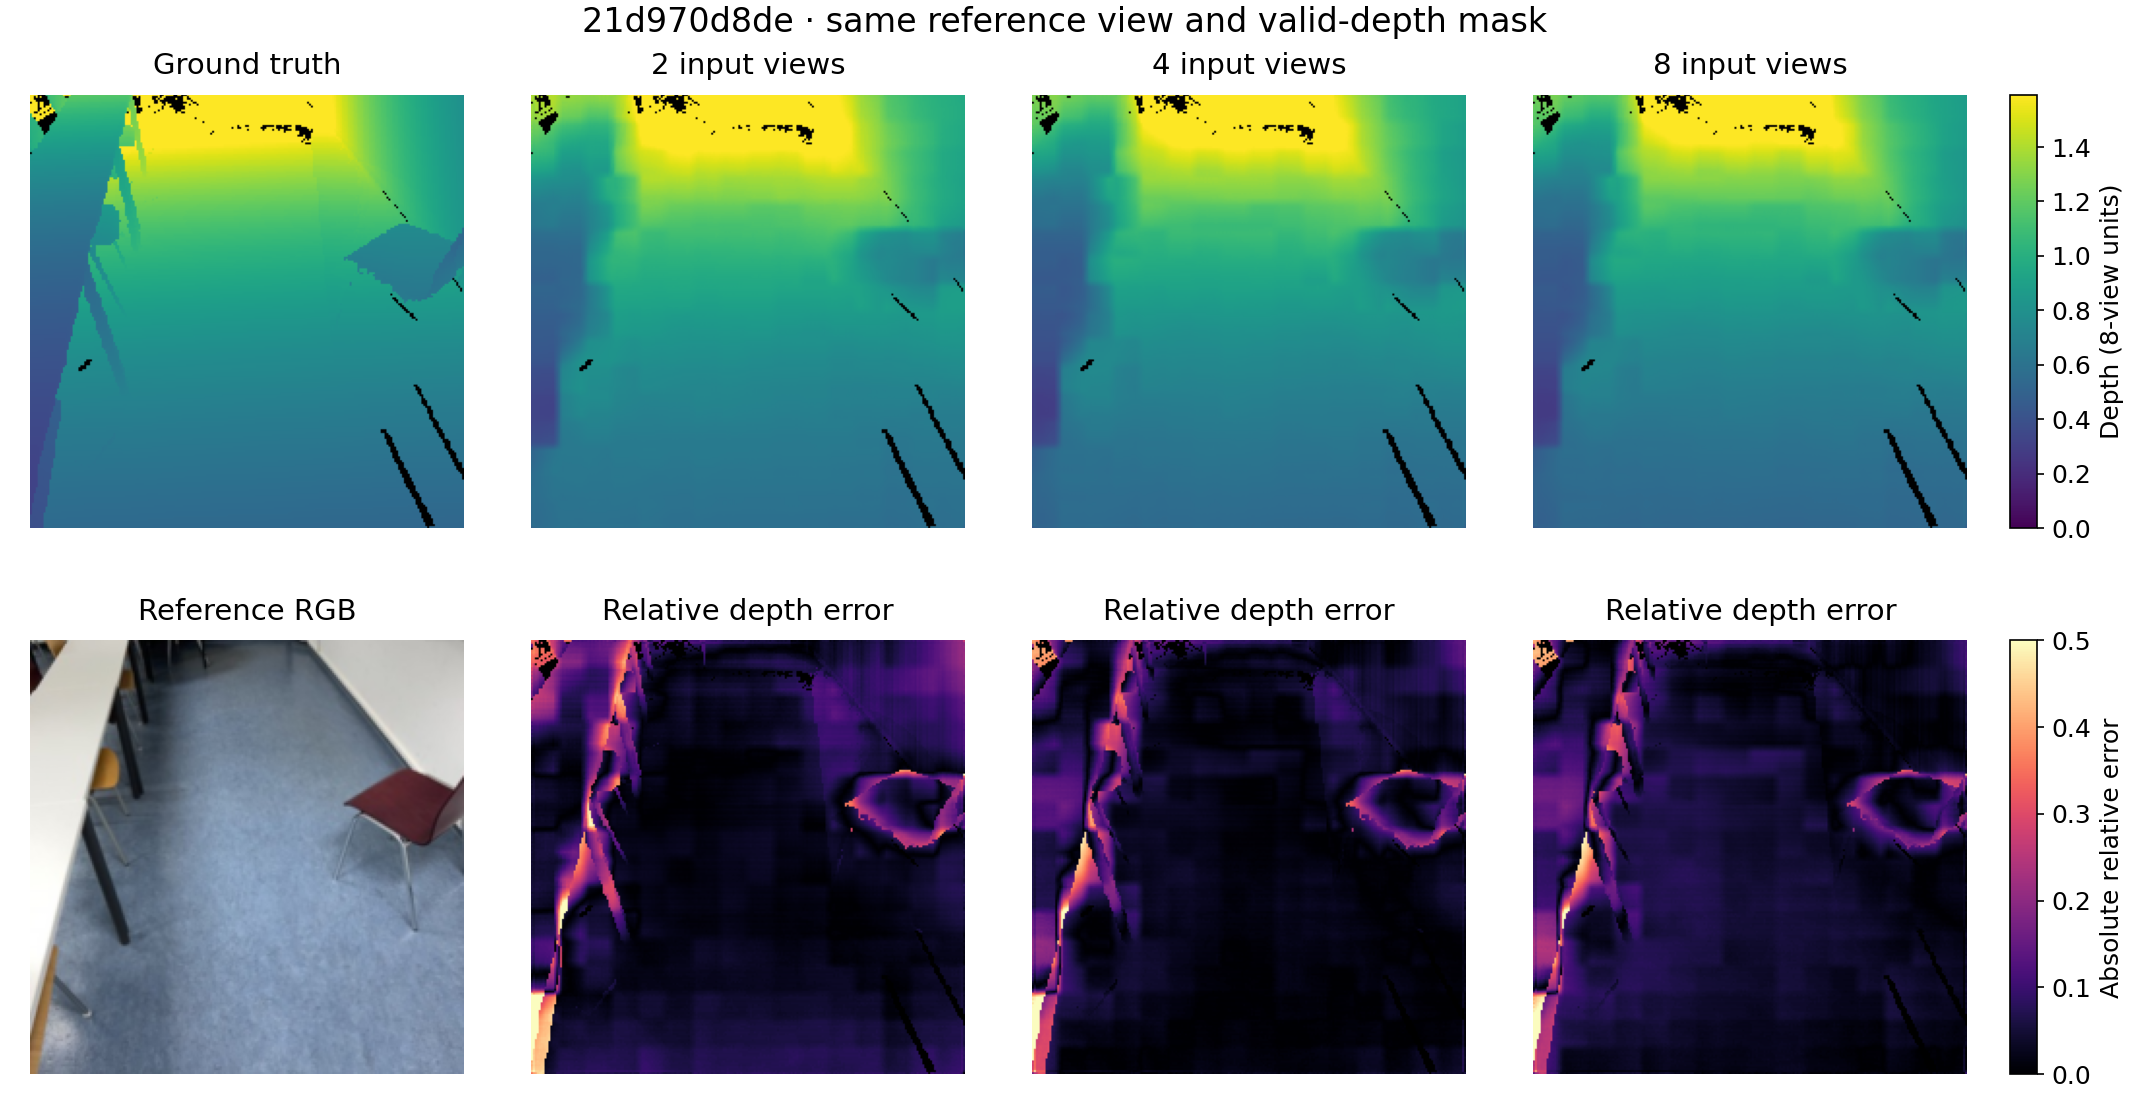
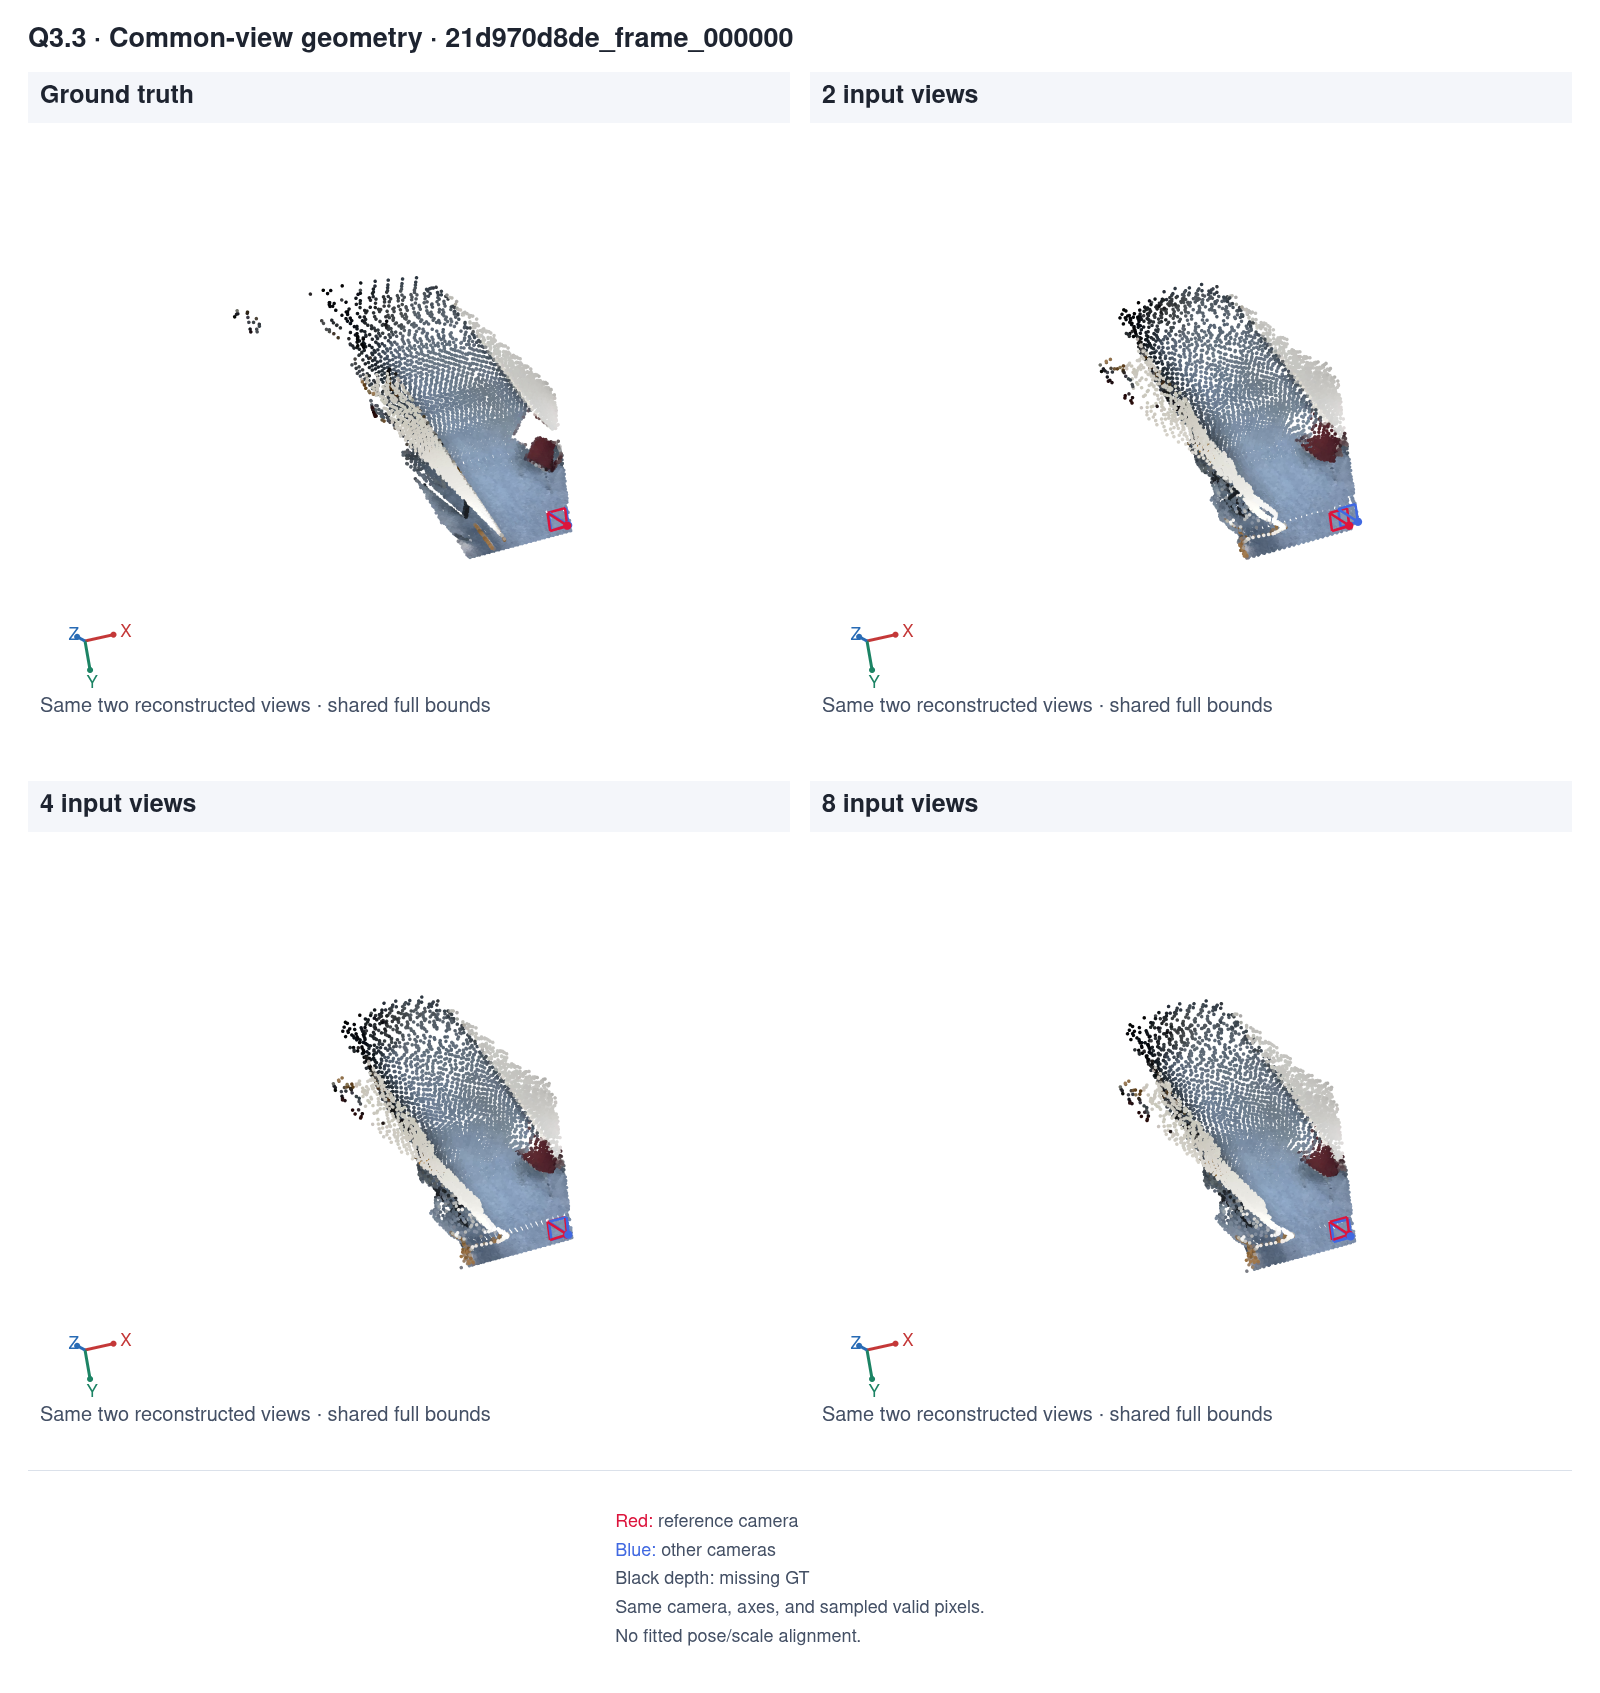
For the first four validation scenes, I show reference-view depth and relative error, followed by point clouds from the same two views. Each comparison shares the GT-valid mask, viewpoint, bounds, and color limits. Depth colors clip at the GT 95th percentile and error colors at 0.5; metrics use unclipped values.
Dining area · 09c1414f1b


Classroom floor · 21d970d8de
Hallway · 280b83fcf3
Office · 2b1dc6d6a5
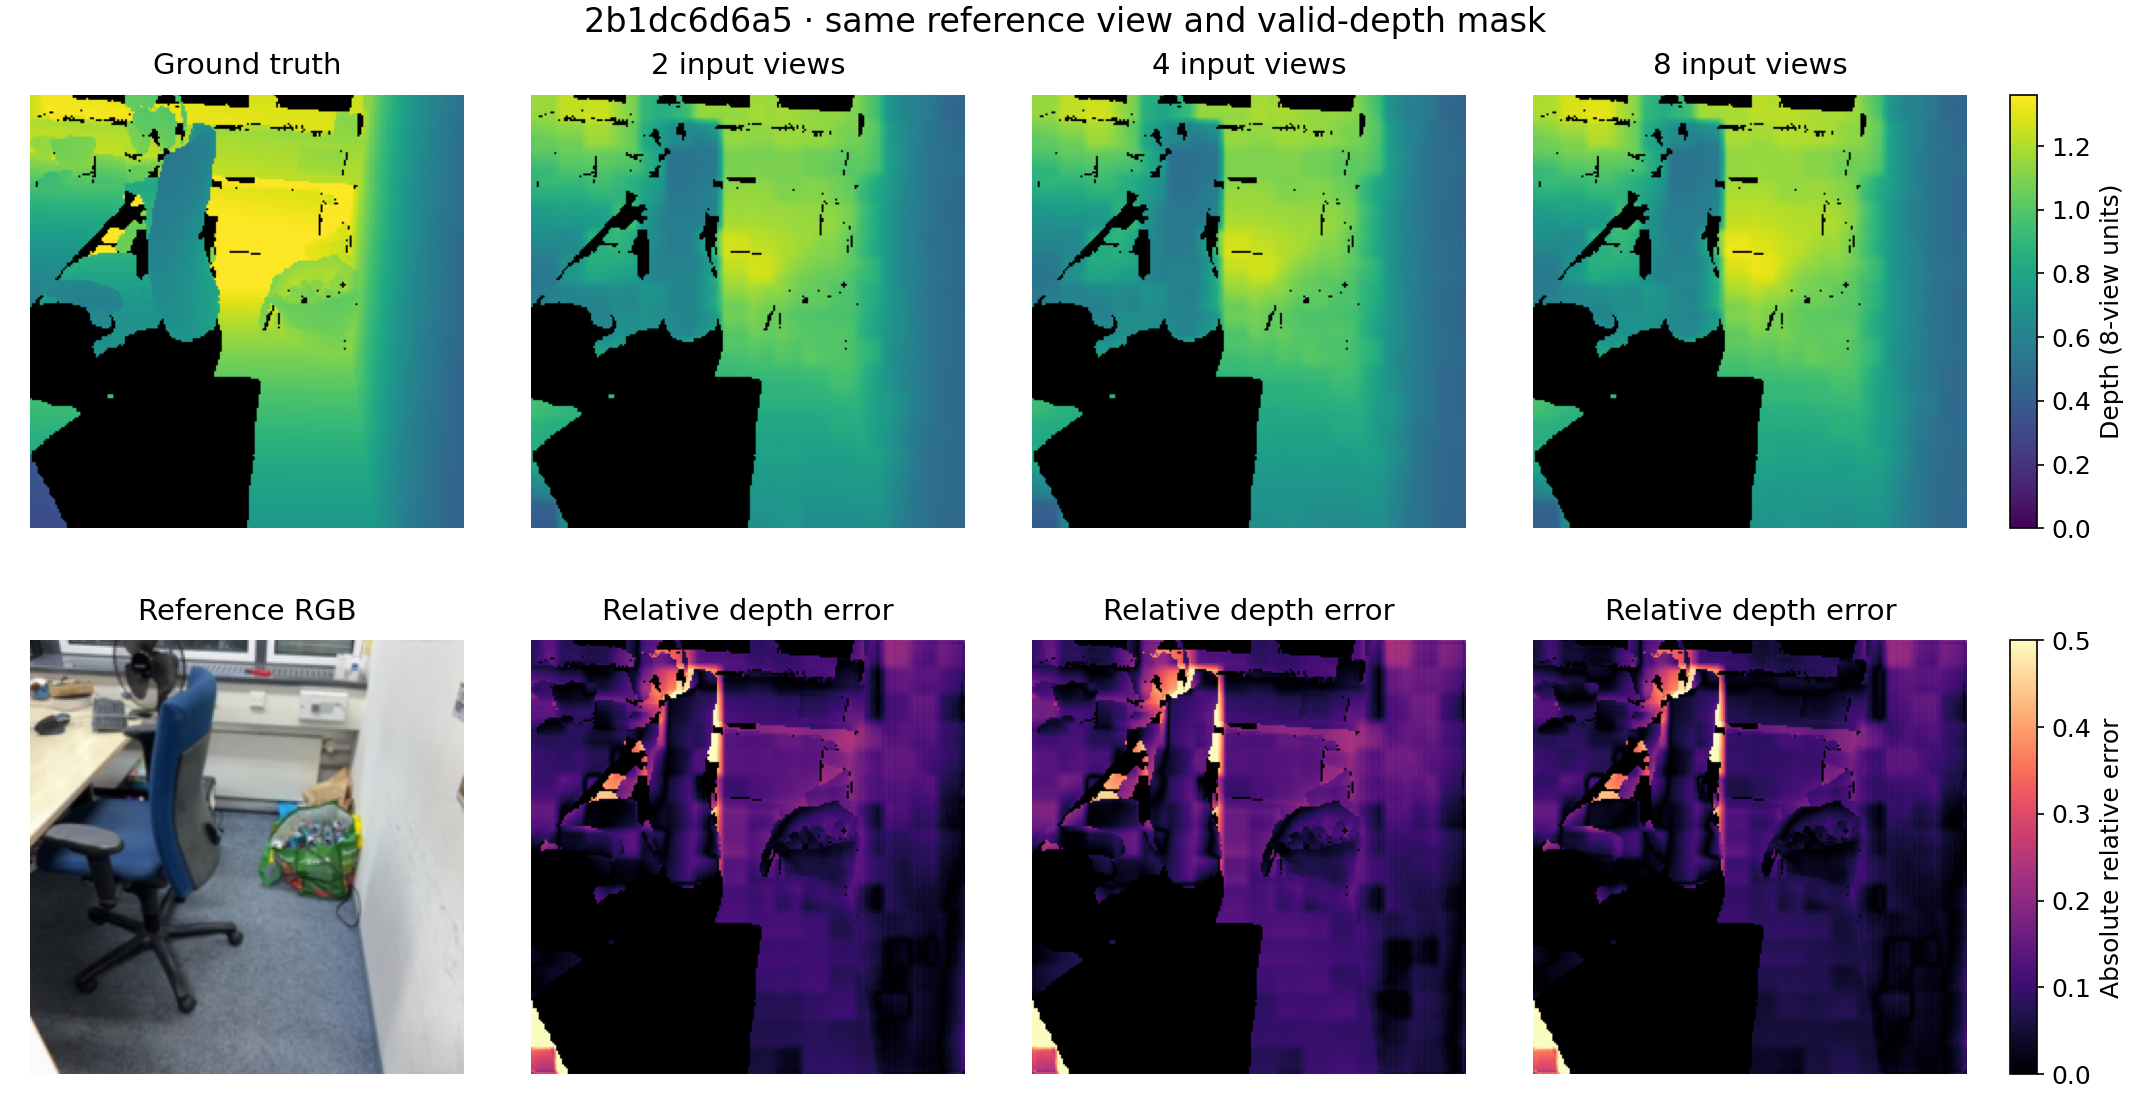
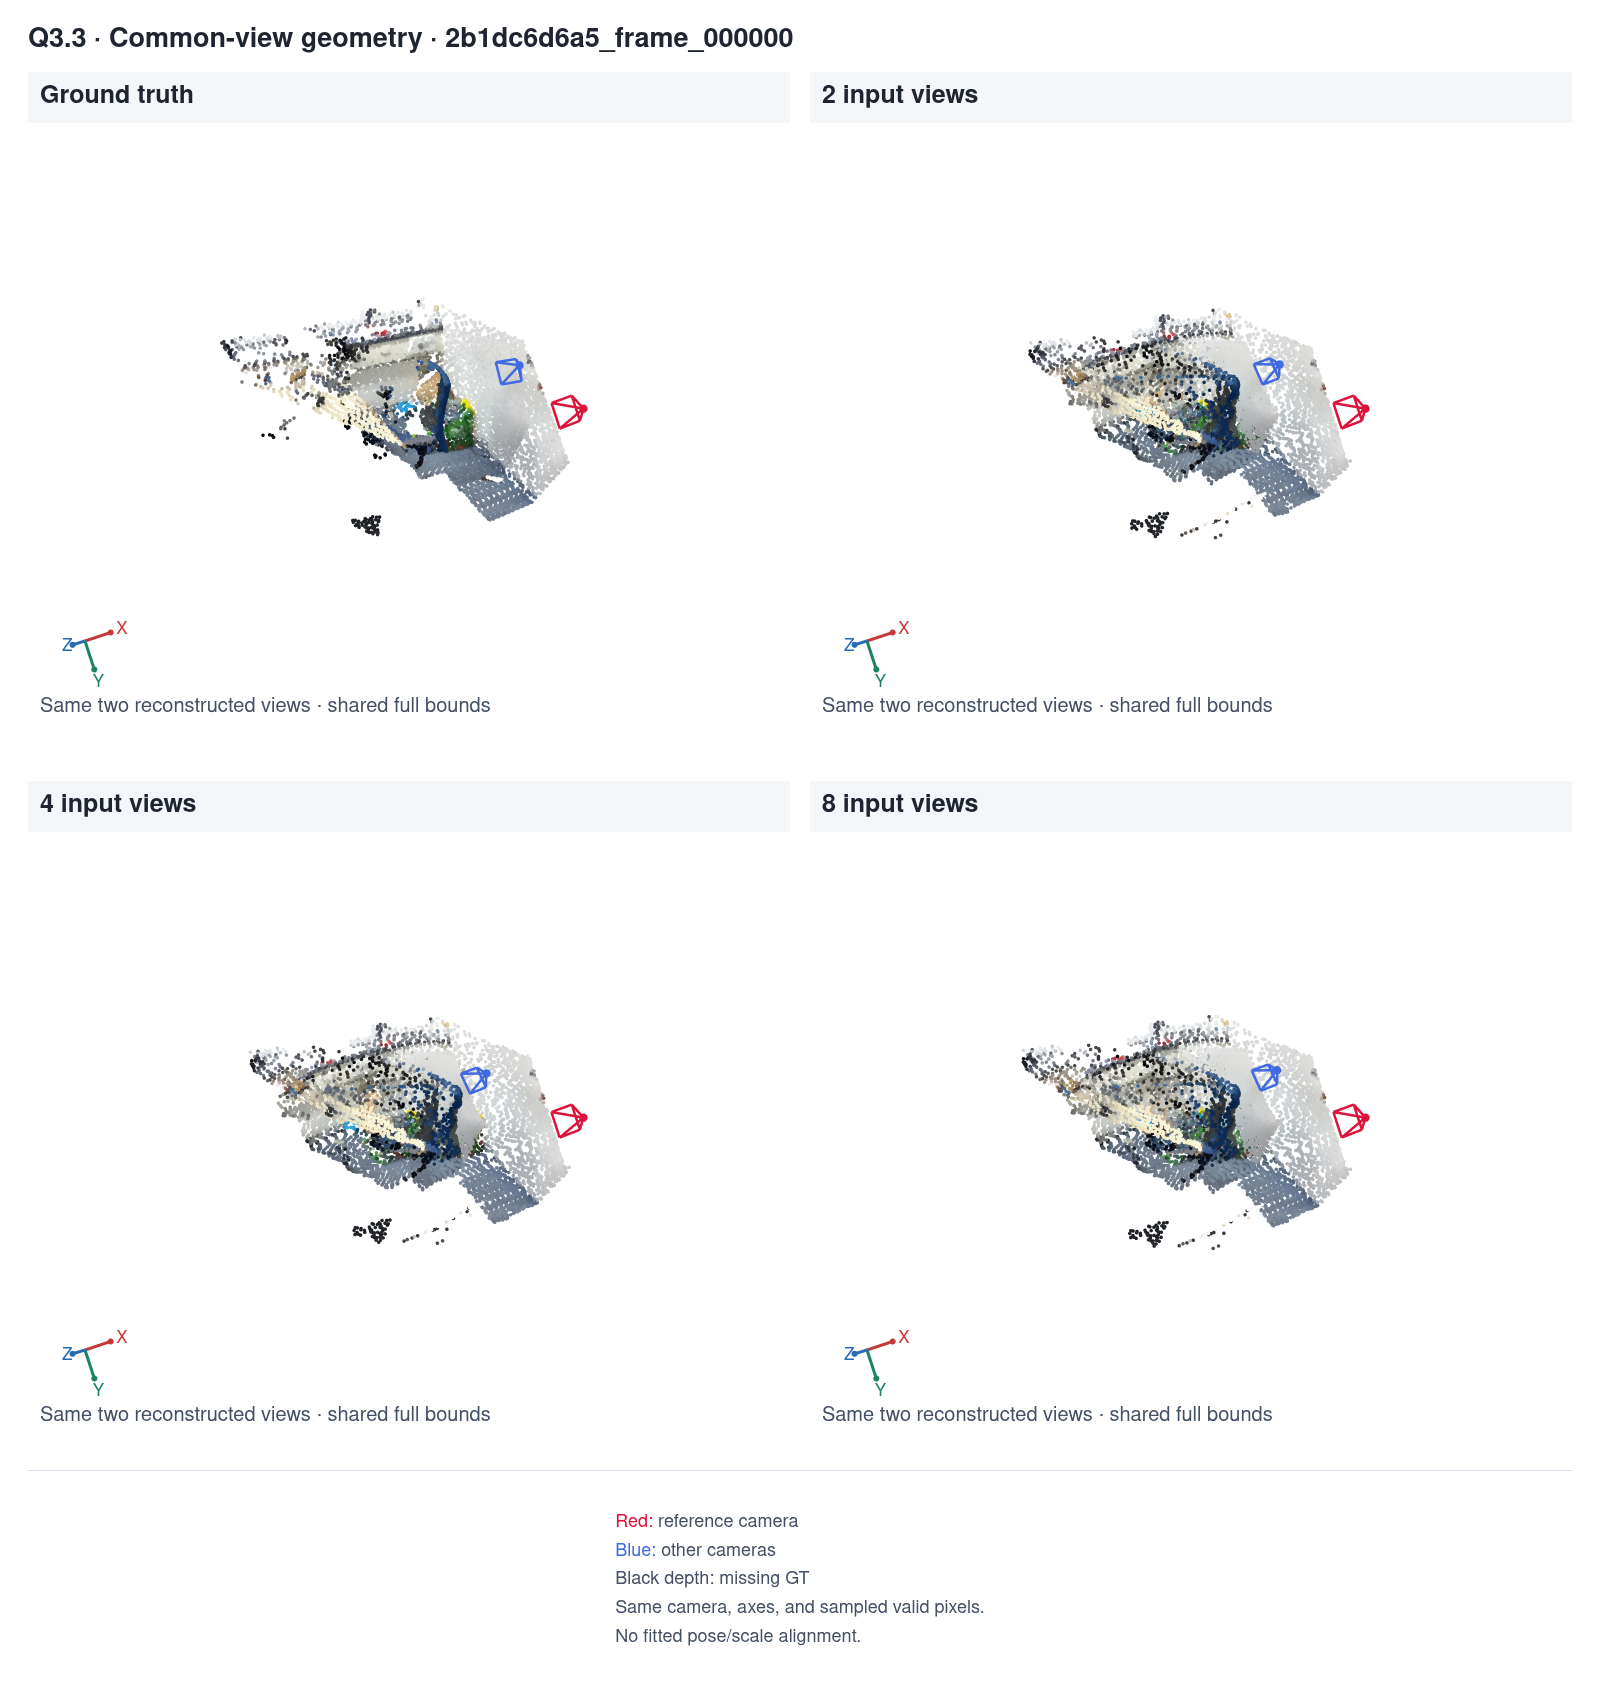
Extra views sometimes help depth, but the model was trained only with eight inputs. Using fewer views changes both the attention inputs and the selected-view normalization, which may explain some of the uneven results. This experiment covers one checkpoint, one seed, and 28 common pose pairs; it does not separate these effects.
Scoring all eight views gives AbsRel 0.137732 and δ1 0.853530, close to the Q3.2 baseline. The small difference is consistent with BF16 evaluation at batch size one instead of 16.
Result records
Full-precision metrics, run settings, and bonus measurements are linked below.
- Q1 geometry checks
- Q2 settings, overfit, and all nine ablations
- Q3 overfit settings
- Q3 overfit metrics
- Q3 full-training settings
- Q3 full validation metrics
- Q3 full test metrics
- Bonus settings and checkpoint
- Bonus common-view and all-input metrics
- Bonus timing and memory measurements
- Bonus per-scene measurements
- Bonus paired bootstrap statistics