Assignment 5
Geethika Hemkumar (Andrew ID: ghemkuma)
Q1. Classification Model
Test accuracy: 0.977
NOTE: The below class-color mapping is used in the below sample visualizations:
chair: orangevase: magentalamp: cyan
Success Cases for Point Clouds in Test Set
Test Sample 0, Predicted Class: Chair
 Ground Truth |
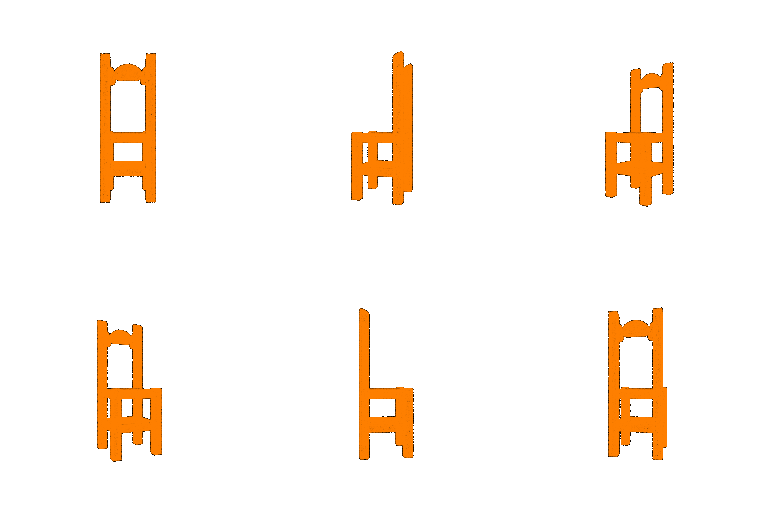 Predicted |
Test Sample 649, Predicted Class: Vase
 Ground Truth |
 Predicted |
Test Sample 800, Predicted Class: Lamp
 Ground Truth |
 Predicted |
Failure Cases
Chair, Test Sample 77
The ground-truth class is chair, but the model predicted the class to be lamp
 Ground Truth |
 Predicted |
Interpretation of failure
A typical chair instance would have a seat that is more easily distinguishable from the rest of the chair, legs that appear as four distinct pegs rather than two solid side panels, and a taller backrest. This chair instance does not have a typical appearance. A lamp usually has a body that rests on a table/surface. The sample's tall and rectangular shape looks more similar to a lamp body than a chair, which may have led to the model to wrongly classify this instance as a lamp.
Vase, Test Sample 618
The ground-truth class is vase, but the model predicted the class to be lamp
 Ground Truth |
 Predicted |
Interpretation of Failure
Vases usually don't have a lid/top, as they are commonly used for holding flowers/plants. The model likely interpreted the top of the vase as a lamp shade, and the cylindrical base as the body of a lamp, leading to an incorrect lamp class prediction.
Lamp, Test Sample 777
The ground-truth class is lamp, but the model predicted the class to be vase
 Ground Truth |
 Predicted |
Interpretation of Failure
This is a chandelier, which looks different from a typical lamp. The shape of this instance looks more like a vase than a lamp, as the main structure of the chandelier looks similar to the body of a vase and the opening at the top of the chandelier can be mistaken for the opening at the top of a vase. The combination of these two instance-specific features may had led the model to wrongly classify this instance as a vase.
Q2. Segmentation Model
Test Accuracy: 0.903
Good Predictions
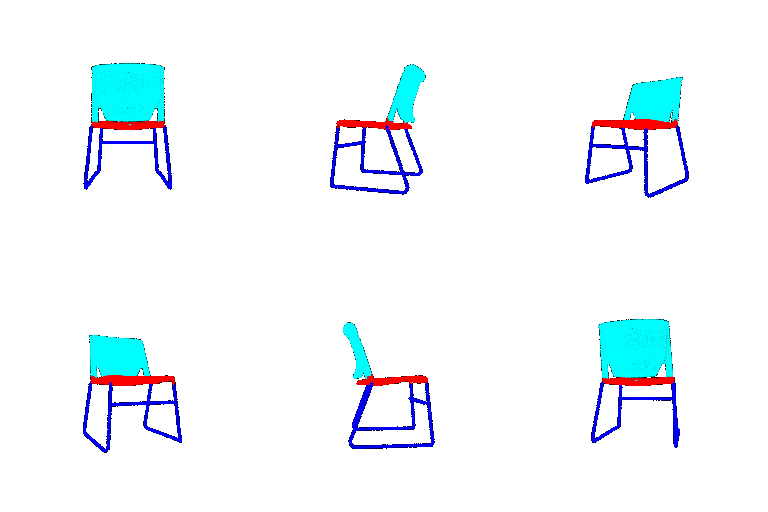
Test Sample 48
Accuracy: 0.992
 Ground Truth |
 Predicted |
Interpretation of Prediction
The predicted segmented point cloud matches the ground truth very well. Similar to the ground truth segmentation, the predicted output shows a clear distinction between the legs of the chair (dark blue), the seat (red), and the backrest (cyan).
Test Sample 320
Accuracy: 0.962
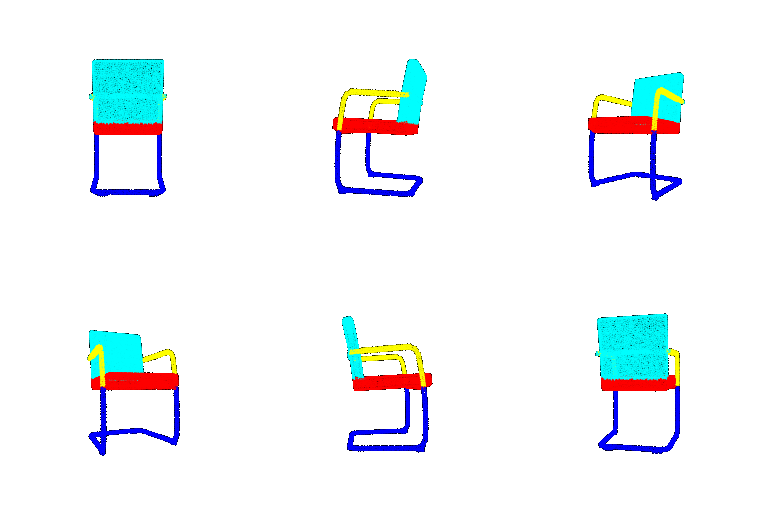 Ground Truth |
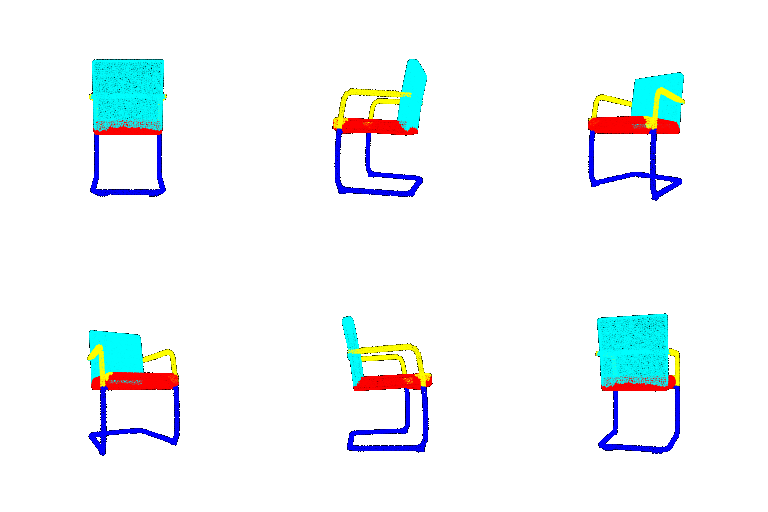 Predicted |
Interpretation of Prediction
The prediction accuracy of this sample is slightly lower compared to the previous one (sample 48). However, the predicted segmented output still matches the ground truth well, showing a clear distinction between the backrest (cyan), seat (red), legs (dark blue), and arms (yellow).
Test Sample 470
Accuracy: 0.927
 Ground Truth |
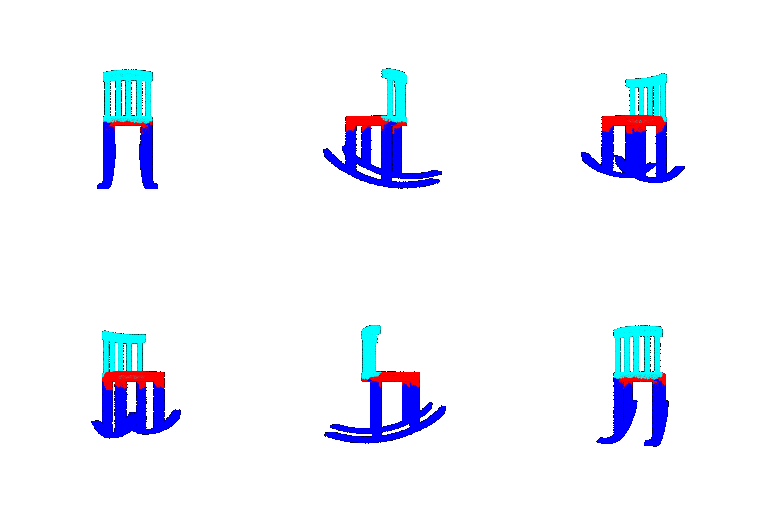 Predicted |
Interpretation of Prediction
Overall, the predicted output is correct. There is a clear separation between the backrest (cyan), seat (red), and legs (dark blue), which matches the ground truth segmentation. However, there are some noticeable errors in the predicted segmented point cloud:
- some of the points near the bottom of the seat were labeled as the the seat class (red) rather than the leg class (dark blue)
- some of the points on the back of the seat were assigned the backrest class (cyan) rather than the seat class (red)
These mispredictions are at the boundaries of the chair parts rather than in places that clearly correspond to a specific part of the chair, indicating that the predicted segmented point cloud captures the ground truth output reasonably well.
Bad Predictions
Test Sample 351
Accuracy: 0.451
 Ground Truth |
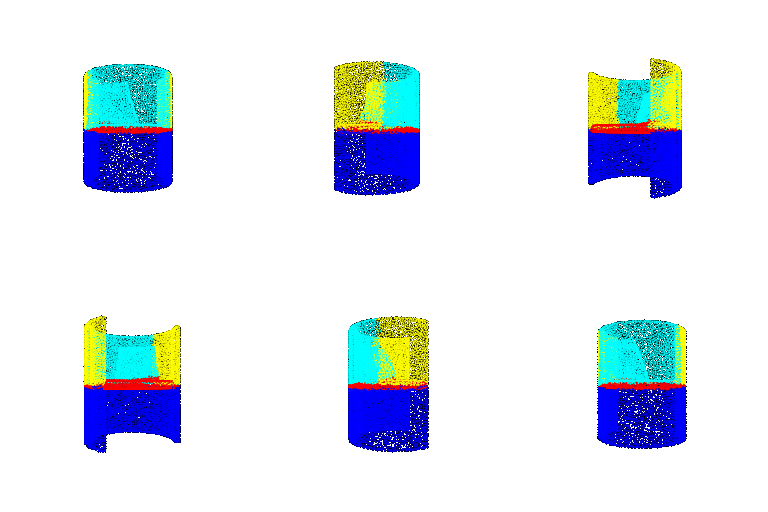 Predicted |
Interpretation of Prediction
The appearance of this chair is quite different from the typical chair example, as the ground truth segmented point cloud doesn't have a part corresponding to the chair legs (dark blue). Since the segmentation model has seen many chair instances that have legs, the bottom half of the semi-circular part of the chair is labeled fully as the leg class (dark blue) rather than a combination of the backrest (cyan) and arm (yellow) classes as in the ground truth label.
One other visibly incorrect aspect of the prediction is annotation of the pillow as part of the backrest (cyan) rather than the seat (red).
Aside from comparison with the ground, both prediction errors highlight semantic ambiguity, as arguably the bottom half of the chair's frame could be classified as either the legs or combination of backrest/arms of a chair and a pillow can be considered either part of a chair's backrest or seat.
Test Sample 605
Accuracy: 0.645
 Ground Truth |
 Predicted |
Interpretation of Prediction
This chair's ground truth segmentation is also different than the common examples. Usually, the seat and backrest are completely above the legs of a chair. In this example however, the backrest and seat are slotted inside the chair legs.
This difference between the common chair example and this specific example is made clear when looking at the difference between the ground truth and predicted outputs. In the predicted output, the backrest (cyan) region does not extend into the legs' (dark blue) region. Additionally, the model predicts the chair arm region to be larger than expected, mislabeling sides of the seat, backrest, and legs as part of the chair arms.
Q3. Robustness Analysis
Experiment 1 - Rotating Input Point Clouds
Explanation of Procedure
The input point clouds are rotated by varying degrees around the z axis using the below rotation matrix:
$$ R= \begin{bmatrix} \cos{d} & -\sin{d} & 0 \\[8pt] \sin{d} & \cos{d} & 0 \\[8pt] 0 & 0 & 1 \end{bmatrix} \\[10pt] deg \in \{0.0^\circ, 15.0^\circ, 30.0^\circ, 45.0^\circ, 90.0^\circ\} $$
I applied this rotation matrix to the input point clouds before classification/segmentation:
$$ pts\_rotated = pts \; @ \; R^T $$
where $pts$ is a tensor of shape $(B, N, 3)$ (B = batch size, N = number of points) and $R$ is a 3x3 rotation matrix.
NOTE: the standard equation for rotating points using rotation matrix $R$ is $R \; @ \; pts$. Using this formulation, it's assumed that the individual points in $pts$ are stored as column vectors. The above equation, $pts \; @ \; R^T$, is the mathematically equivalent formulation when individual points are stored as row vectors.
Classification Results
Checkpoint: best_model, num_points: 10000
Visualizations
| Sample | Ground Truth | 0.0° | 15.0° | 30.0° | 45.0° | 90.0° |
|---|---|---|---|---|---|---|
| 0 |  GT: chair |
 pred: chair (correct) |
 pred: chair (correct) |
 pred: vase (wrong) |
 pred: vase (wrong) |
 pred: vase (wrong) |
| 649 |  GT: vase |
 pred: vase (correct) |
 pred: vase (correct) |
 pred: vase (correct) |
 pred: lamp (wrong) |
 pred: lamp (wrong) |
| 800 |  GT: lamp |
 pred: lamp (correct) |
 pred: lamp (correct) |
 pred: lamp (correct) |
 pred: lamp (correct) |
 pred: vase (wrong) |
| 77 |  GT: chair |
 pred: lamp (wrong) |
 pred: lamp (wrong) |
 pred: lamp (wrong) |
 pred: vase (wrong) |
 pred: vase (wrong) |
| 618 |  GT: vase |
 pred: lamp (wrong) |
 pred: vase (correct) |
 pred: vase (correct) |
 pred: vase (correct) |
 pred: vase (correct) |
| 777 |  GT: lamp |
 pred: vase (wrong) |
 pred: vase (wrong) |
 pred: vase (wrong) |
 pred: vase (wrong) |
 pred: vase (wrong) |
Ground Truth vs. Predicted Labels and Overall Test Set Accuracies Per Rotation Amount
| Sample | 0.0° | 15.0° | 30.0° | 45.0° | 90.0° |
|---|---|---|---|---|---|
| 0 (chair) | chair | chair | vase | vase | vase |
| 649 (vase) | vase | vase | vase | lamp | lamp |
| 800 (lamp) | lamp | lamp | lamp | lamp | vase |
| 77 (chair) | lamp | lamp | lamp | vase | vase |
| 618 (vase) | lamp | vase | vase | vase | vase |
| 777 (lamp) | vase | vase | vase | vase | vase |
| Overall acc (test set) | 0.977 | 0.946 | 0.767 | 0.441 | 0.263 |
Interpretation of Results
As shown in the final row in the above table, the classification test set accuracy degrades as the degree of rotation increases, showing that the trained PointNet classification model is not rotation-invariant. This makes sense, as the implemented PointNet architecture does not incorporate the transformation blocks (even if they were added, there is no formal proof that these blocks enable rotation invariance since they are learned).
Even the predictions for test samples identified to be success cases in Q1 become incorrect as the input point clouds are rotated. For sample 0, the predicted class is correct (chair) for rotations of 0 and 15 degrees, but becomes incorrect (vase) once the input is rotated by higher degree amounts.
The predictions for the "good" examples of the vase and lamp classes are more robust to higher amounts of rotation (the prediction for example 649 only becomes incorrect for 45 and 90 degrees of rotation and the prediction for example 800 is only incorrect for 90 degrees of rotation). A hypothesis for the reason is that typical lamps/vases have simpler shapes compared to typical chair instances.
In general, based on the examples above, the model tends to predict the vase class for heavily rotated input point clouds. A possible reason for this is that vases have a simpler shape than lamps or chairs and hence can be seen as the "default" prediction when the model has not seen similar input data before.
Segmentation Results
Checkpoint: best_model, num_points: 10000
Visualizations
| Sample | Ground Truth | 0.0° | 15.0° | 30.0° | 45.0° | 90.0° |
|---|---|---|---|---|---|---|
| 48 |  |
 acc: 0.992 |
 acc: 0.941 |
 acc: 0.863 |
 acc: 0.709 |
 acc: 0.601 |
| 320 |  |
 acc: 0.962 |
 acc: 0.867 |
 acc: 0.759 |
 acc: 0.666 |
 acc: 0.464 |
| 470 |  |
 acc: 0.927 |
 acc: 0.881 |
 acc: 0.803 |
 acc: 0.761 |
 acc: 0.475 |
| 351 |  |
 acc: 0.451 |
 acc: 0.381 |
 acc: 0.388 |
 acc: 0.289 |
 acc: 0.401 |
| 605 |  |
 acc: 0.645 |
 acc: 0.634 |
 acc: 0.477 |
 acc: 0.415 |
 acc: 0.373 |
Per-Sample Accuracies and Overall Test Set Accuracies Per Rotation Amount
| Sample | 0.0° | 15.0° | 30.0° | 45.0° | 90.0° |
|---|---|---|---|---|---|
| 48 | 0.992 | 0.941 | 0.863 | 0.709 | 0.601 |
| 320 | 0.962 | 0.867 | 0.759 | 0.666 | 0.464 |
| 470 | 0.927 | 0.881 | 0.803 | 0.761 | 0.475 |
| 351 | 0.451 | 0.381 | 0.388 | 0.289 | 0.401 |
| 605 | 0.645 | 0.634 | 0.477 | 0.415 | 0.373 |
| Overall (test set) | 0.903 | 0.821 | 0.689 | 0.600 | 0.458 |
Interpretation of Results
Similar to the classification results of this robustness experiment, the segmentation test set accuracy degrades as the degree of rotation increases. The per-instance accuracies for the "good" examples drop significantly as the rotation amount increases, whereas those for the "bad" examples comparatively don't change as much with the rotation amount. The trained model receives point coordinates of upright chairs during training. Rotation causes a significant deviation from this distribution. This degrades the model's performance, especially for examples that have strong prediction performance with 0 degrees of rotation. The "bad" examples already performed poorly at 0 degrees of input rotation, so input rotation mostly shifts the predictions to a new set of "bad" predictions.
Interestingly, the accuracy for sample 351 increased from 0.289 to 0.401 between 45 and 90 degrees of rotation, but this is unlikely to reflect a real improvement as the prediction accuracy was already weak at 0 degrees of rotation.
Experiment 2 - Adding Gaussian Noise to Input Points
Explanation of Procedure
Based on the same robustness analysis done in the original PointNet paper, Gaussian noise is added to each input point in the point clouds.
The tensor of per-point noise is generated for the full $(B, N, 3)$ test set beforehand. A fixed seed is used for torch.normal so that the generated noise stays consistent across executions of the script.
The noise is added to the input points as follows:
$$noisy\_pts = pts + noise$$
where:
- $pts$ is a $(B, N, 3)$ tensor with the $B$ original test set point clouds
- $noise$ is a $(B, N, 3)$ tensor of Gaussian noise drawn from $N(0.0, \sigma)$
$\sigma$ is varied among $\{0, 0.01, 0.02, 0.04, 0.08, 0.16\}$.
Classification Results
Checkpoint: best_model, num_points: 10000
Visualizations
| Sample | Ground Truth | σ = 0.0 | σ = 0.01 | σ = 0.02 | σ = 0.04 | σ = 0.08 | σ = 0.16 |
|---|---|---|---|---|---|---|---|
| 0 | GT: chair |
 pred: chair (correct) |
 pred: chair (correct) |
 pred: chair (correct) |
 pred: chair (correct) |
 pred: chair (correct) |
 pred: vase (wrong) |
| 649 | GT: vase |
 pred: vase (correct) |
 pred: vase (correct) |
 pred: vase (correct) |
 pred: vase (correct) |
 pred: vase (correct) |
 pred: vase (correct) |
| 800 | GT: lamp |
 pred: lamp (correct) |
 pred: lamp (correct) |
 pred: lamp (correct) |
 pred: vase (wrong) |
 pred: vase (wrong) |
 pred: vase (wrong) |
| 77 | GT: chair |
 pred: lamp (wrong) |
 pred: lamp (wrong) |
 pred: lamp (wrong) |
 pred: vase (wrong) |
 pred: vase (wrong) |
 pred: vase (wrong) |
| 618 | GT: vase |
 pred: lamp (wrong) |
 pred: lamp (wrong) |
 pred: lamp (wrong) |
 pred: vase (correct) |
 pred: vase (correct) |
 pred: vase (correct) |
| 777 | GT: lamp |
 pred: vase (wrong) |
 pred: vase (wrong) |
 pred: vase (wrong) |
 pred: vase (wrong) |
 pred: vase (wrong) |
 pred: vase (wrong) |
Ground Truth vs. Predicted Labels and Overall Test Set Accuracies Per Noise Level
| Sample | σ = 0.0 | σ = 0.01 | σ = 0.02 | σ = 0.04 | σ = 0.08 | σ = 0.16 |
|---|---|---|---|---|---|---|
| 0 (chair) | chair | chair | chair | chair | chair | vase |
| 649 (vase) | vase | vase | vase | vase | vase | vase |
| 800 (lamp) | lamp | lamp | lamp | vase | vase | vase |
| 77 (chair) | lamp | lamp | lamp | vase | vase | vase |
| 618 (vase) | lamp | lamp | lamp | vase | vase | vase |
| 777 (lamp) | vase | vase | vase | vase | vase | vase |
| Overall acc (test set) | 0.977 | 0.974 | 0.964 | 0.918 | 0.795 | 0.184 |
Interpretation of Results
As shown in the last row of the above table, the overall classification test set accuracy degrades as the noise level increaess. In the sampled examples, nearly every flipped prediction becomes “vase”, and by $\sigma$ = 0.16 all six samples are predicted as vase, suggesting the model defaults to this class once details are lost. Notably, sample 618 (vase) becomes “correct” at $\sigma$ $\geq$ 0.04 only because of this bias.
Example 0, which yields a correct chair prediction for an input point cloud with no added noise, remains correct through $\sigma=0.08$ and flips to the vase class at $\sigma=0.16$. The chair-specific details such as the gaps between the legs of the chair are lost as the noise level increases and almost completely disappear at $\sigma=0.16$. Example 649 (vase) remains correct across noise levels, which matches the general trend of predictions becoming "vase" at high noise levels. Finally, example 800 (lamp) remains correct through $\sigma=0.02$ and flips to the vase class at $\sigma=0.04$. The lamp shape is still distinguishable at $\sigma=0.04$, suggesting that the model is sensitive to changes beyond global structure due to increased noise levels.
Segmentation Results
Checkpoint: best_model, num_points: 10000
Visualizations
| Sample | Ground Truth | σ = 0.0 | σ = 0.01 | σ = 0.02 | σ = 0.04 | σ = 0.08 | σ = 0.16 |
|---|---|---|---|---|---|---|---|
| 48 | |
 acc: 0.992 |
 acc: 0.989 |
 acc: 0.985 |
 acc: 0.975 |
 acc: 0.934 |
 acc: 0.758 |
| 320 | |
 acc: 0.962 |
 acc: 0.967 |
 acc: 0.967 |
 acc: 0.950 |
 acc: 0.866 |
 acc: 0.701 |
| 470 | |
 acc: 0.927 |
 acc: 0.932 |
 acc: 0.938 |
 acc: 0.910 |
 acc: 0.790 |
 acc: 0.762 |
| 351 | |
 acc: 0.451 |
 acc: 0.449 |
 acc: 0.460 |
 acc: 0.475 |
 acc: 0.436 |
 acc: 0.263 |
| 605 | |
 acc: 0.645 |
 acc: 0.661 |
 acc: 0.685 |
 acc: 0.699 |
 acc: 0.637 |
 acc: 0.571 |
Per-Sample Accuracies and Overall Test Set Accuracies Per Noise Level
| Sample | σ = 0.0 | σ = 0.01 | σ = 0.02 | σ = 0.04 | σ = 0.08 | σ = 0.16 |
|---|---|---|---|---|---|---|
| 48 | 0.992 | 0.989 | 0.985 | 0.975 | 0.934 | 0.758 |
| 320 | 0.962 | 0.967 | 0.967 | 0.950 | 0.866 | 0.701 |
| 470 | 0.927 | 0.932 | 0.938 | 0.910 | 0.790 | 0.762 |
| 351 | 0.451 | 0.449 | 0.460 | 0.475 | 0.436 | 0.263 |
| 605 | 0.645 | 0.661 | 0.685 | 0.699 | 0.637 | 0.571 |
| Overall (test set) | 0.903 | 0.900 | 0.891 | 0.863 | 0.781 | 0.610 |
Interpretation of Results
Similar to the classification results of this robustness experiment, the overall segmentation test set accuracy declines as the noise level increases. The overall segmentation test set accuracy degrades less significantly at high noise levels compared to the overall classification test set accuracy for this robustness experiment (at $\sigma=0.16$, the overall classification test set accuracy is 0.184 whereas the overall segmentation test accuracy is 0.610 at $\sigma=0.16$).
The accuracies of the "good" examples (48, 320, 470) all stay above 0.9 through $\sigma=0.04$. The prediction accuracies for samples 48 and 320 decline most sharply between $\sigma=0.08$ and $\sigma=0.16$, and the prediction accuracy for sample 470 declines most sharply between $\sigma=0.04$ and $\sigma=0.08$.
In some cases the per-sample accuracies increase slightly when low levels of noise are added. The accuracy of sample 605 increases from 0.645 to 0.661 as the noise level changes from $\sigma=0$ to $\sigma=0.01$. A similar trend (but less in magnitude) occurs for sample 320 as the noise level changes from $\sigma=0$ to $\sigma=0.01$. However, the overall test accuracy trend shows a gradual decrease as noise levels increase. Hence, these sample-specific trends are more likely due to randomness rather than a more notable trend.