1. Exploring Loss Functions
1.1 Fitting a voxel grid
Trained on the subset dataset
Optimized Voxel Grid
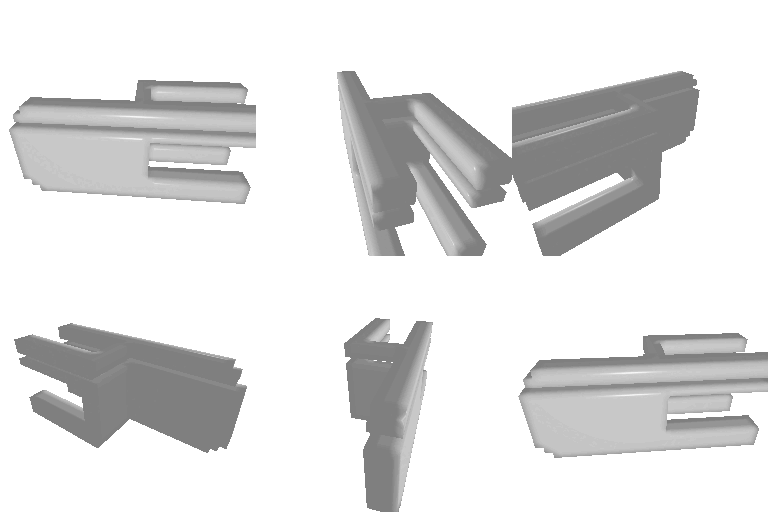
Ground-Truth Voxel Grid

1.2 Fitting a point cloud
Trained on the full dataset
Optimized Point Clouds
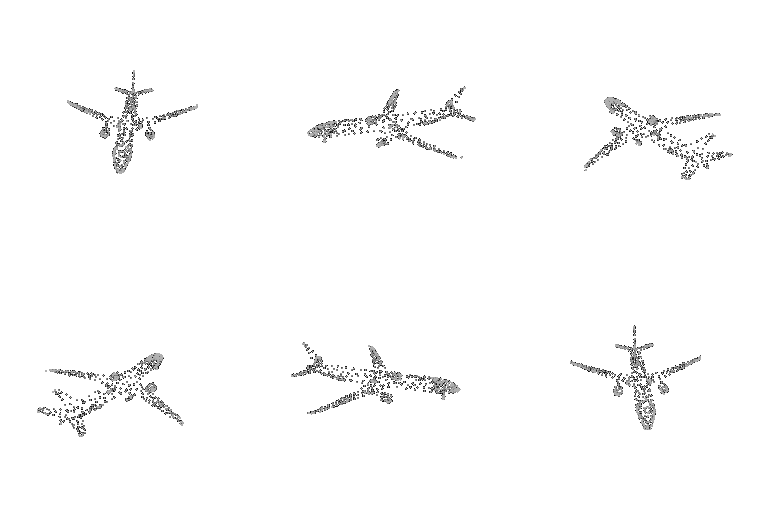
Ground-Truth Point clouds

1.3 Fitting a mesh
Trained on the full dataset
Optimized Mesh
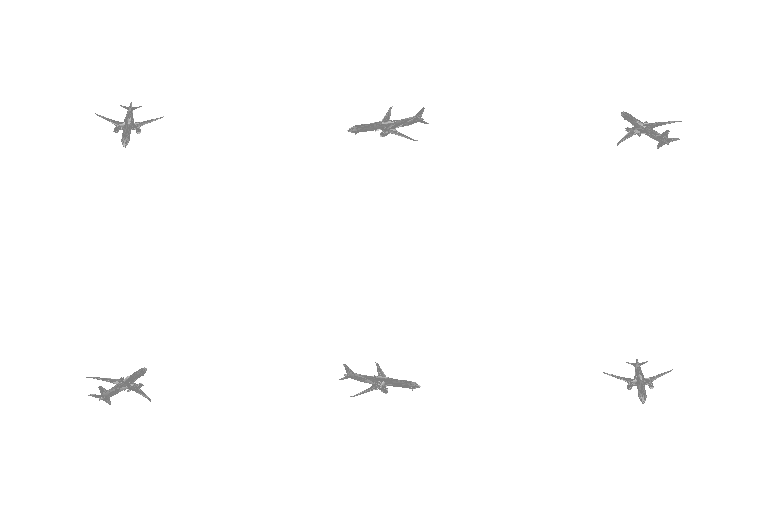
Ground-Truth Mesh

2. Reconstructing 3D from single view
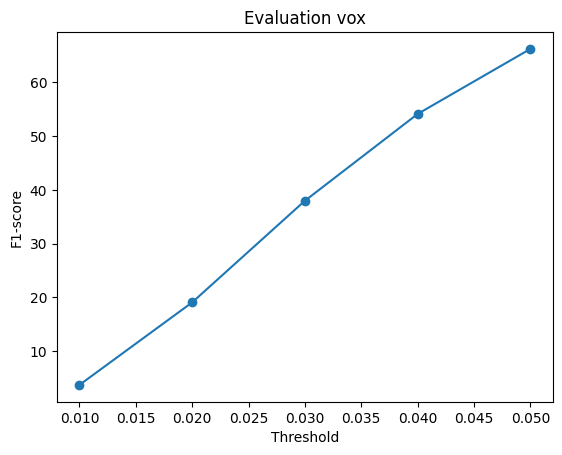
2.1 Image to voxel grid
avg F1@0.05: 66.213
comments: I had to reduce the isovalue from 0.5 to 0.3 otherwise the sometimes the mes was completely empty. The model is not confident in its prediction when ground truth meshes are really small
Input images:


Groud Truth voxels


Predicted voxels


2.2 Image to Point Clouds
avg F1@0.05: 74.761
comments: A lot of point clouds are concentrated at the joint near the hind legs, backrest and the seat. This seems to be a local minima based on how the points are initialized.
Sample 2 (F1@0.05: 89.15) got an input image from the side, which I believe made the model uncertain about how much empty space is there in the back rest, I am surprised that this got such a high F1 score.
Sample 3 (F1@0.05: 60.19) got an image of the back of a closed designer chair, it was not able to identify that the cair was round (ig it should have picked that up based on how the light gradually changes, but I'll never know) thus, making the pridiction boxier than it should be.
Input images:


Ground Truth point clouds:


Predicted point clouds:


2.3 Image to Mesh
avg F1@0.05: 68.7
comments: The predictions give decent shapes but are terrible in their smoothening. I think this will improve if I increase the weight for smoothening.
Input images:


Ground Truth meshes:


Predicted meshes:


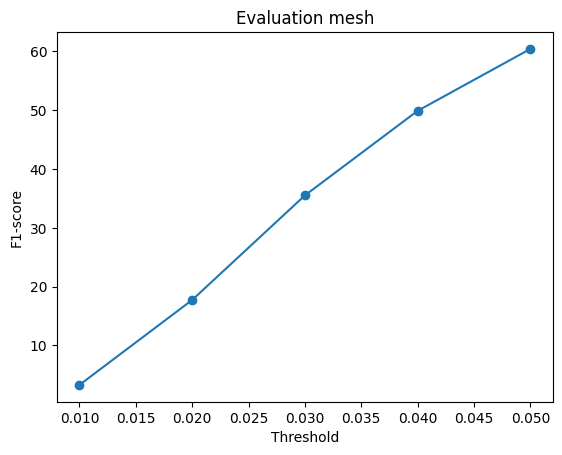
2.4 Analyze the effects of hyparameter variation
I chose to vary w_smooth, as I found the meshes to be very jaggered in the defaul w_smooth = 0.1, I increased the value to w_smooth = 0.5, w_smooth = 1.0 and w_smooth = 2.0
comments: So w_smooth plays a big role in ironing out the meshes. But it also brings to light how the model failed to learn the basic shape the third sample, as the shape matches the shape of the first sample.
Another odd behaviour is that the avg F1 score keeps decreasing with increasing w_smooth. Perhpas the model is overfitting to the training data with the smoothening term.
It is also interesting to see that the model is predicting two horns for every one of the chairs.
avg F1@0.05: 65.649
Ground Truth meshes:
Predicted meshes:
Predicted meshes with w_smooth = 0.5:


avg F1@0.05: 64.430
Predicted meshes with w_smooth = 1.0:


avg F1@0.05: 60.438
Predicted meshes with w_smooth = 2.0:


2.5 Visualization of what the model is learning
I want to undersatnd how the point cloud model is working, so I experimented with it. since the model only has discrete outputs for the coordinates, I thought it would be interesting to see how the model is learns with a a lot of itererations early on.
I saved the model after 1, 3, 4, 7 and 20 iterations. This makes it clear why the there are huge pockets in the joints mentioned earlier. The initialization of the model prooduces a lot of points which are in the center, and very few points which are farther away. As the model learns to push these points onto the surface, bringing them closer to the actual mesh, the bulk at the point clouds get deposited at the pockets.
 Iter 1 |
 Iter 3 |
 Iter 4 |
 Iter 7 |
 Iter 20 |
Iter 500 |
Exploring other Datasets
3.3 Using 3 class dataset
Two models were trained for this comparison. One was trained only on the chairs dataset. The other was trained on the full dataset.
For each of the model, the F1@0.05 scores were computed on the full dataset and the chairs only dataset.
Model 1: Trained only on the chairs dataset
Full dataset avg F1@0.05: 70.042
Chairs only dataset avg F1@0.05: 74.761
Model 2: Trained on the full dataset
Full dataset avg F1@0.05: 86.58
Chairs only dataset avg F1@0.05: 73.17
Using the full dataset, The original network which was only trained on the chairs dataset
Looking at the final scores, it seems like that the model learns to generalize better with full dataset, preventing overfitting to the chairs. But looking at the outputs, it seems to produce the same output for each category instead of learning the true shape of each object.
F1@0.05 on the chairs-only test set: chairs-only model ≈ 74.7, 3-class model 73.17. On the 3-class test set the 3-class model gets 84.00.
| Sample | Input | Ground truth | Trained on chairs | Trained on 3 classes | Comments |
|---|---|---|---|---|---|
| 0 (plane) |
 |
 |
 |
 |
Both models have similar predictions for plane sample 0 and 100. |
| 100 (plane) |
 |
 |
 |
 |
The chair model also produces the pockets of point clouds at the wing joints. |
| 500 (car) |
 |
 |
 |
 |
Both model predict similar shapes for the cars. |
| 700 (monster truck) |
 |
 |
 |
 |
The model has overfit to the normal car shape and has produced a generic car shape instead of creating a monster truck like shape. |
| 1100 (chair) |
 |
 |
 |
 |
Some similarity in the shape, but is missing the armrests entirely. Seems to have overfit to a chair of similar size. |
| 1200 (chair) |
 |
 |
 |
 |
A larger chair, and approximates the size of the chair, but doens't capture the long hind legs / rocking chair like structure. |