Test sets: 953 classification objects and 617 segmentation chairs. Standard evaluations use 10,000 points per object. Checkpoints were selected using held-out training objects.
Q1. Classification
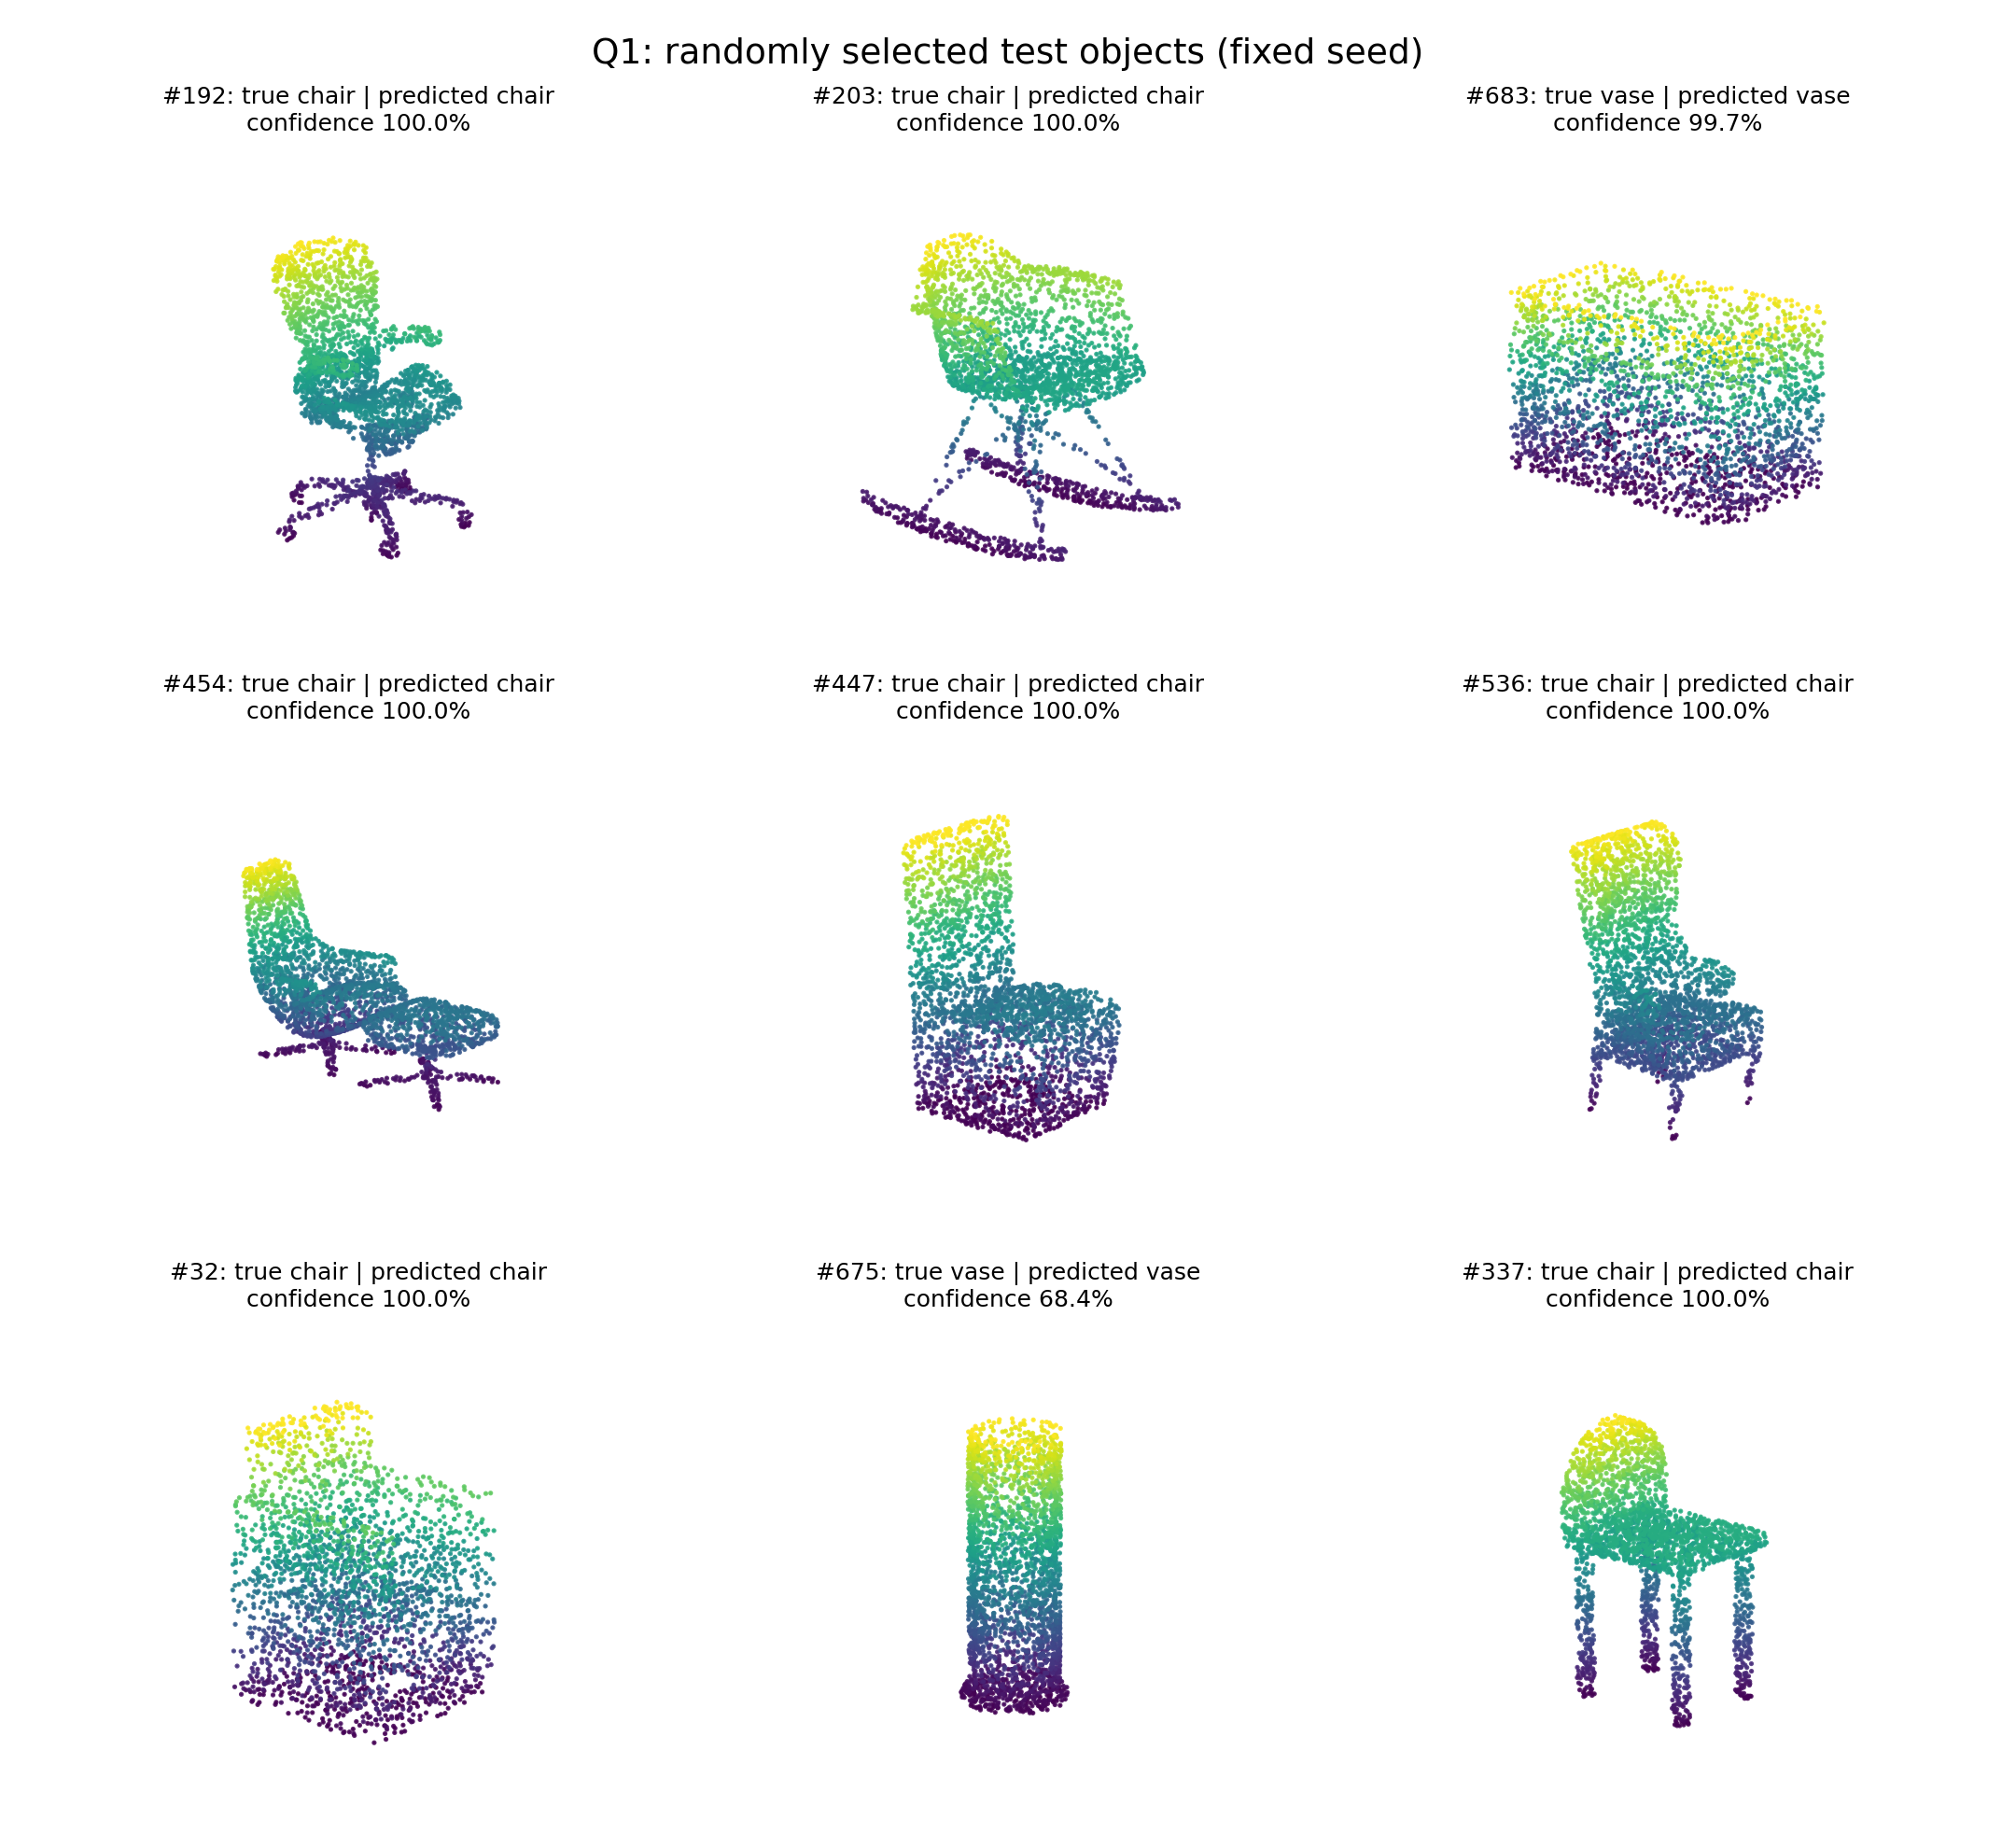
Test accuracy: 95.17% (907/953).
Random test objects with true classes and predicted classes; color represents height.
One failure per class
Chair #406 → lamp
Chair #406 → lamp — three views of the same object.
The rounded back and thin supports resemble a broad lamp top and stand. Global pooling may miss the relationship between the chair’s seat, back, and legs.
Vase #619 → lamp
Vase #619 → lamp — three views of the same object.
The flower adds a narrow stem and flared top above the vase. This resembles a lamp’s base, stem, and shade.
Lamp #758 → vase
Lamp #758 → vase — three views of the same object.
The rounded body and curved upper structure resemble a decorative vase or flower arrangement. Its unusual shape differs from a simple lamp stand.
Q2. Segmentation
Test point accuracy: 90.25%.
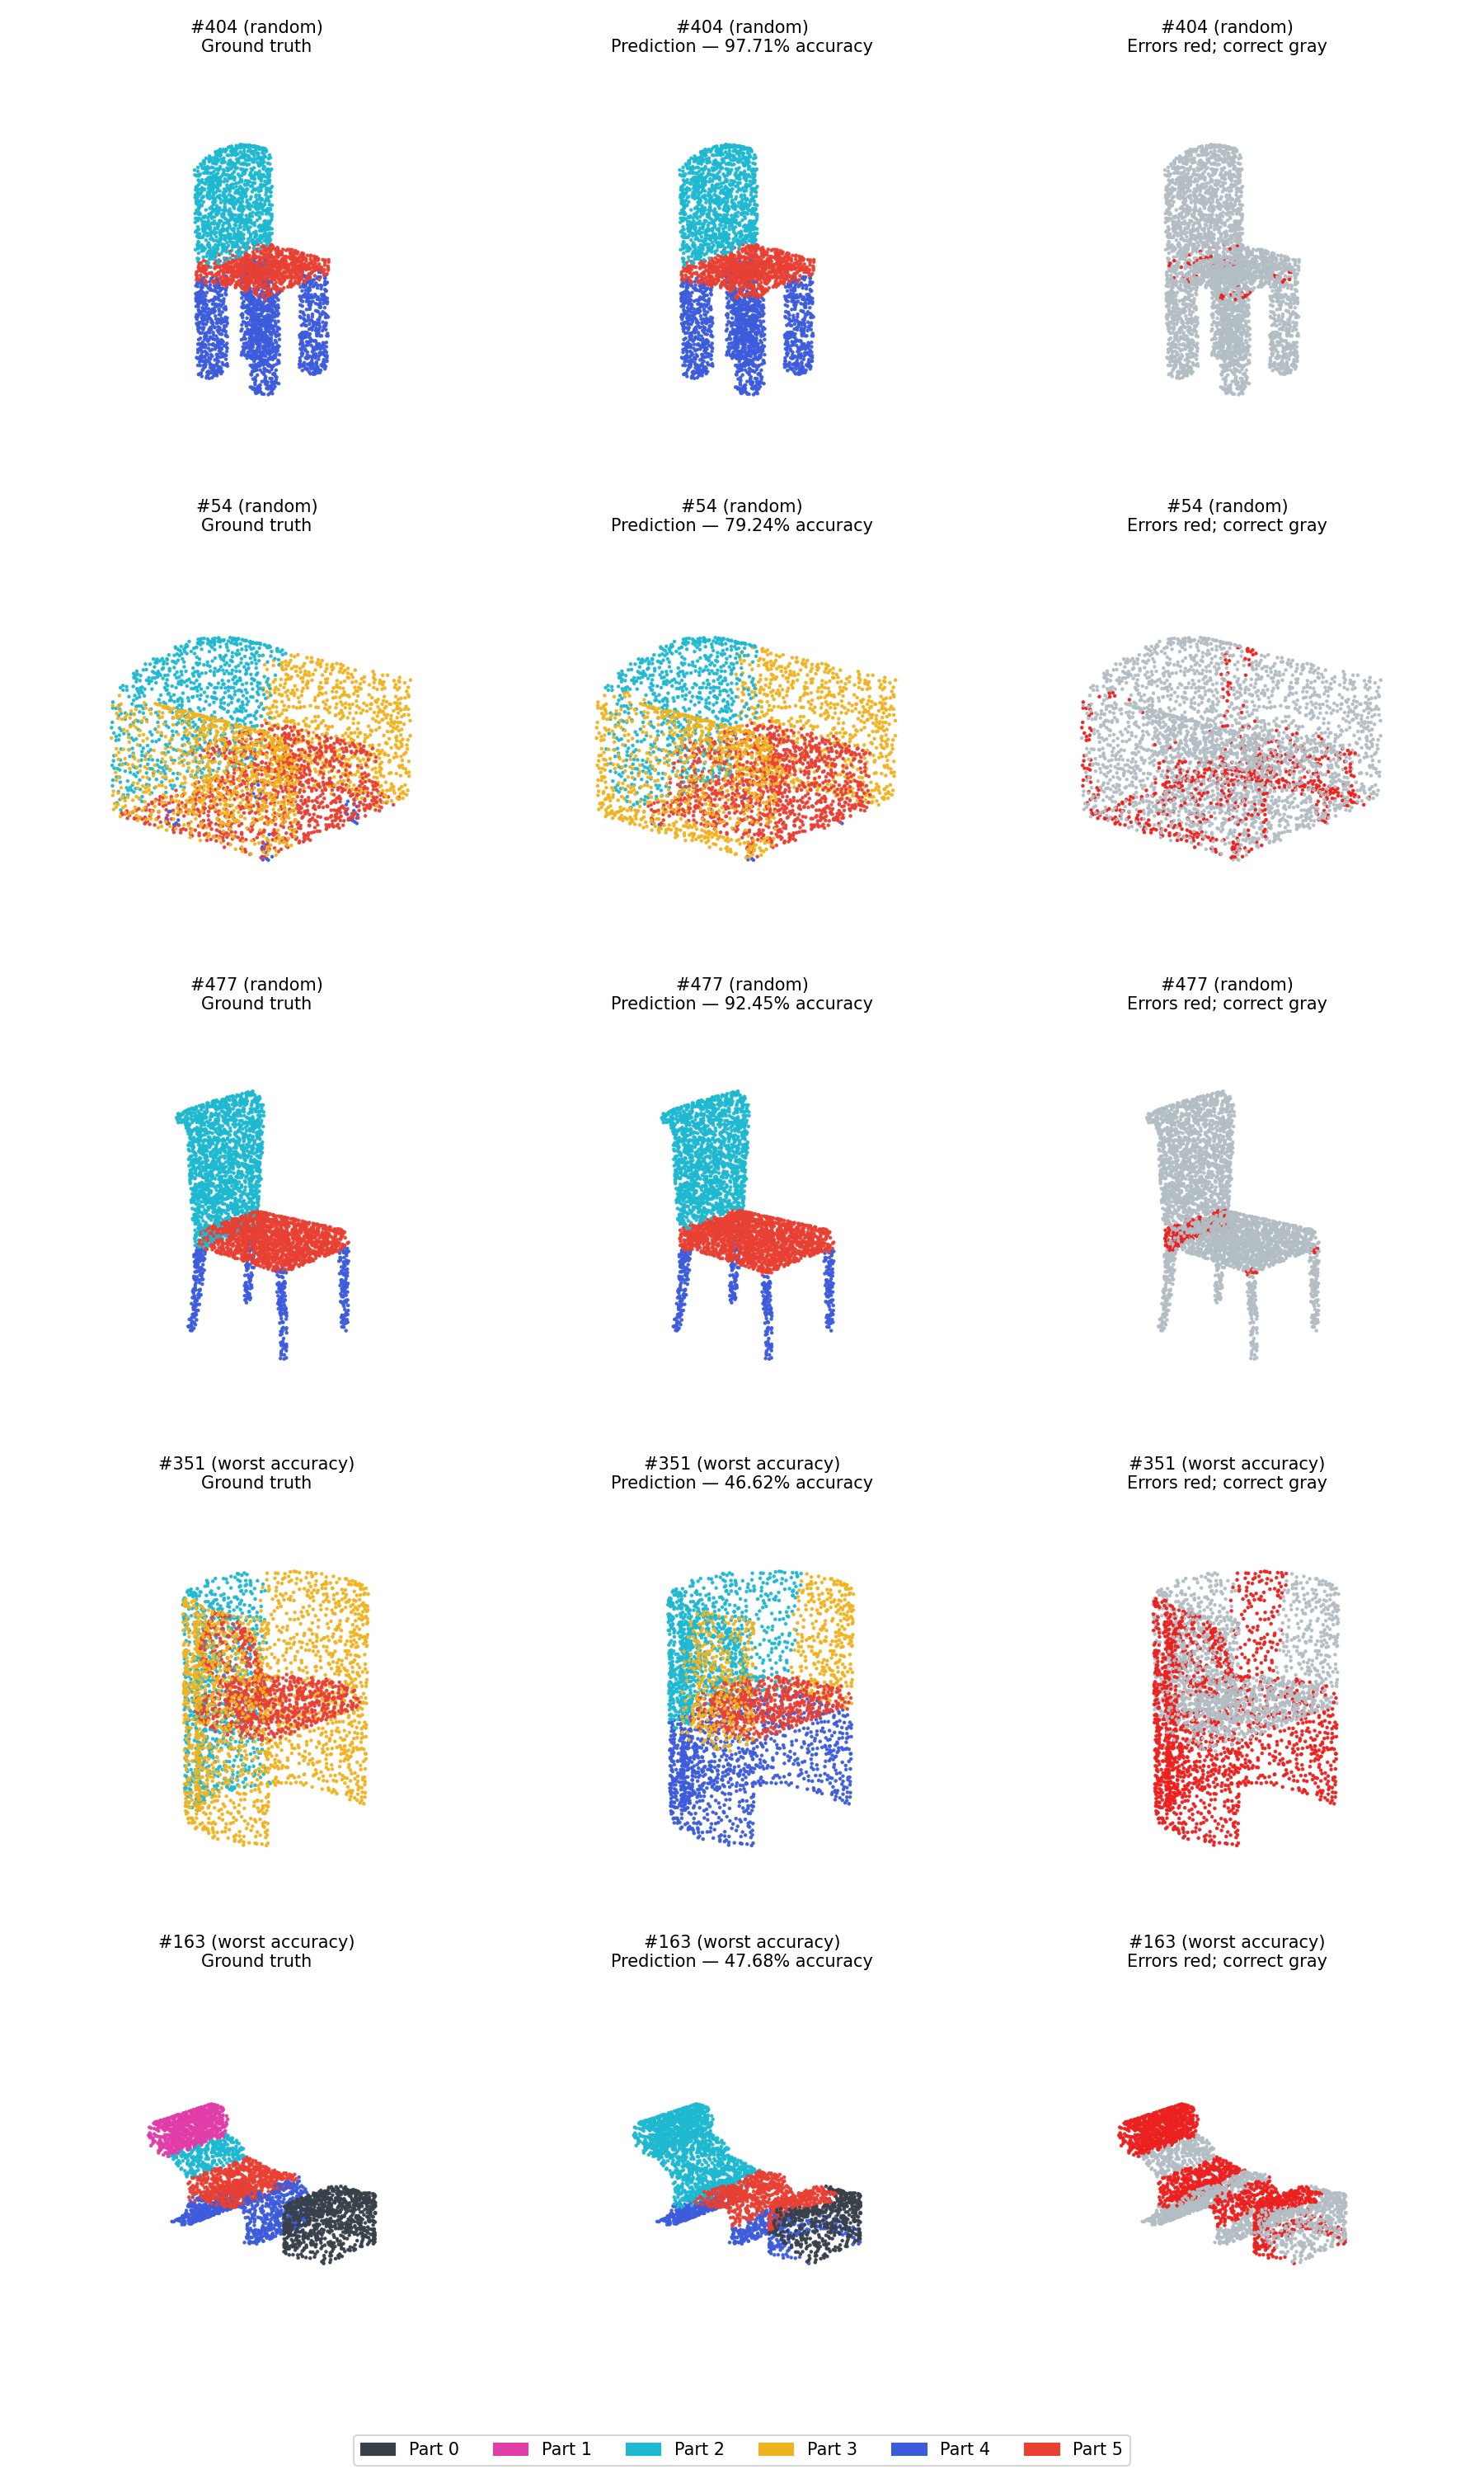
Five chairs: ground truth, prediction, and errors (red). Colors identify numeric part labels 0–5.
Object
Selection
Point accuracy
Interpretation
#404
Random
97.71%
The back, seat, and legs are clearly separated. Remaining errors cluster near their junctions.
#54
Random
79.24%
Connected side and seat surfaces make boundaries ambiguous. Most mistakes occur around the lower seat and side regions.
#477
Random
92.45%
The main part layout is correct. Errors concentrate near the back-to-seat boundary.
#351
Poor prediction
46.62%
Large solid side panels are mislabeled as leg-like regions. The error affects broad surfaces, not only boundaries.
#163
Poor prediction
47.68%
The reclined layout causes seat/support confusion. The rare upper pad is labeled as back-like Part 2 instead of Part 1.
Objects #351 and #163 are the two lowest-accuracy cases. Part 1 has zero recall overall; high point accuracy therefore does not imply every part is learned.
Q3. Robustness Analysis
Experiment 1: Rotation
Keep both PointNet checkpoints fixed. Rotate every test cloud about vertical y or horizontal x, retaining all points and their labels. Report accuracy and loss from the Q1/Q2 baselines in percentage points (pp).
Axis
Angle
Classification
Drop (pp)
Segmentation
Drop (pp)
None
0°
95.17%
0.00
90.25%
0.00
y
15°
93.60%
1.57
87.83%
2.42
y
30°
78.91%
16.26
81.10%
9.15
y
45°
62.75%
32.42
73.06%
17.19
y
90°
43.13%
52.05
58.35%
31.91
y
180°
30.85%
64.32
62.44%
27.81
x
15°
91.82%
3.36
84.44%
5.81
x
30°
63.17%
32.00
74.09%
16.17
x
45°
35.05%
60.13
64.86%
25.39
x
90°
23.92%
71.25
24.93%
65.32
x
180°
67.58%
27.60
35.98%
54.27
Classification: the same three objects at baseline, y 45°, x 45°, and x 90°; titles show predictions.Segmentation: three Q2 objects with transformed ground truth and predictions under the same rotations.
Both models depend strongly on orientation. A 90° horizontal tilt loses 71.25 pp in classification and 65.32 pp in segmentation. Point-order invariance does not provide rotation invariance, and training used no rotation augmentation. Large part-label changes on the rotated chairs suggest reliance on the usual upright layout; some symmetric shapes remain correctly classified.
Experiment 2: Point Count
Uniformly sample points without replacement, independently per object, using seeds 42, 43, and 44. Within each seed, smaller sets are nested subsets. Segmentation scores only retained points with aligned labels. Values below are mean ± sample standard deviation across the three seeds.
Points
Classification
Drop vs Q1 (pp)
Segmentation
Drop vs Q2 (pp)
10,000
95.17%
0.00
90.25%
0.00
4,096
95.24 ± 0.16%
-0.07
90.45 ± 0.01%
-0.20
2,048
95.45 ± 0.12%
-0.28
90.62 ± 0.01%
-0.36
1,024
95.49 ± 0.18%
-0.31
90.46 ± 0.05%
-0.21
512
95.28 ± 0.46%
-0.10
89.25 ± 0.10%
+1.00
128
94.47 ± 0.70%
+0.70
83.60 ± 0.22%
+6.65
32
71.42 ± 1.15%
+23.75
72.62 ± 0.51%
+17.64
Classification: baseline and 1,024, 128, and 32 points, using seed 42.Segmentation: the same retained points shown with ground truth and predictions, using seed 42.
Classification remains near baseline at 128 points, while segmentation loses 6.65 pp: part labeling needs finer spatial context. Both degrade at 32 points, where distinguishing geometry may be absent. Comparing full-cloud segmentation predictions on those same retained points still gives a 17.73 pp loss, so the decline is not merely due to selecting harder points. A high score on one 32-point example does not imply accurate labeling of its missing points.
Q4. Locality
The compact PointNet++-style model samples 256 then 64 centers. Shared MLPs and max pooling aggregate up to 32 neighbors within radii 0.2 and 0.4, learning local geometry before global pooling. Classification uses the global feature; segmentation interpolates features back to all points with skip connections. Each task uses its best validation checkpoint.
Task
Q1/Q2 baseline
Q4 locality
Gain (pp)
Classification
95.17%
97.38%
+2.20
Segmentation
90.25%
91.19%
+0.94
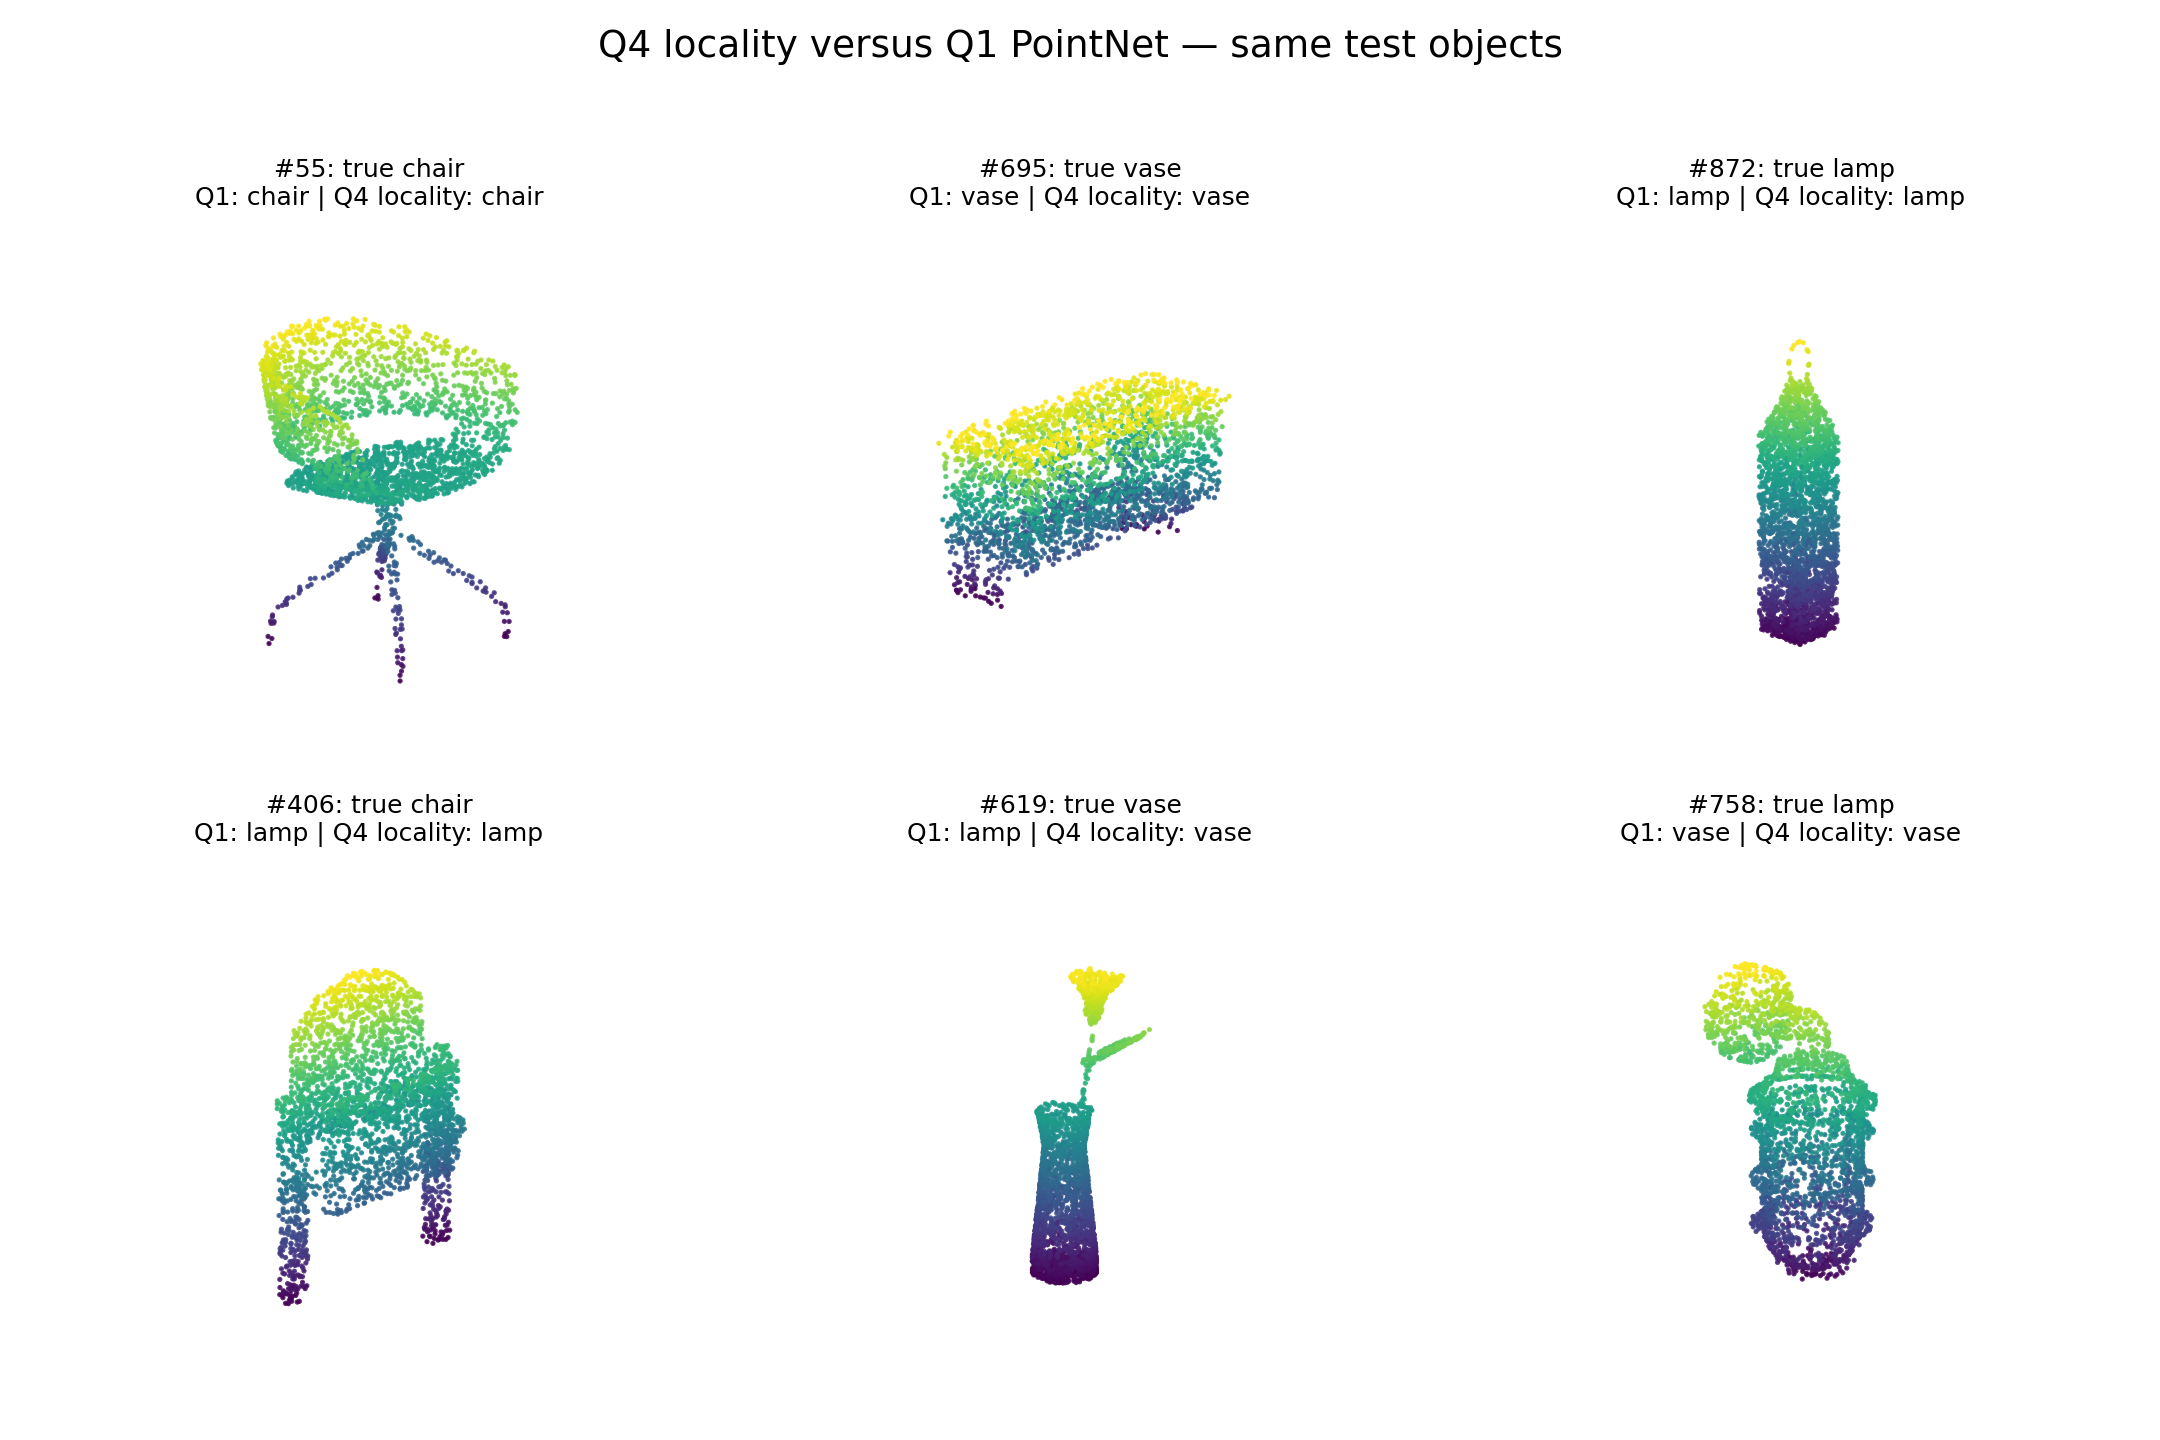
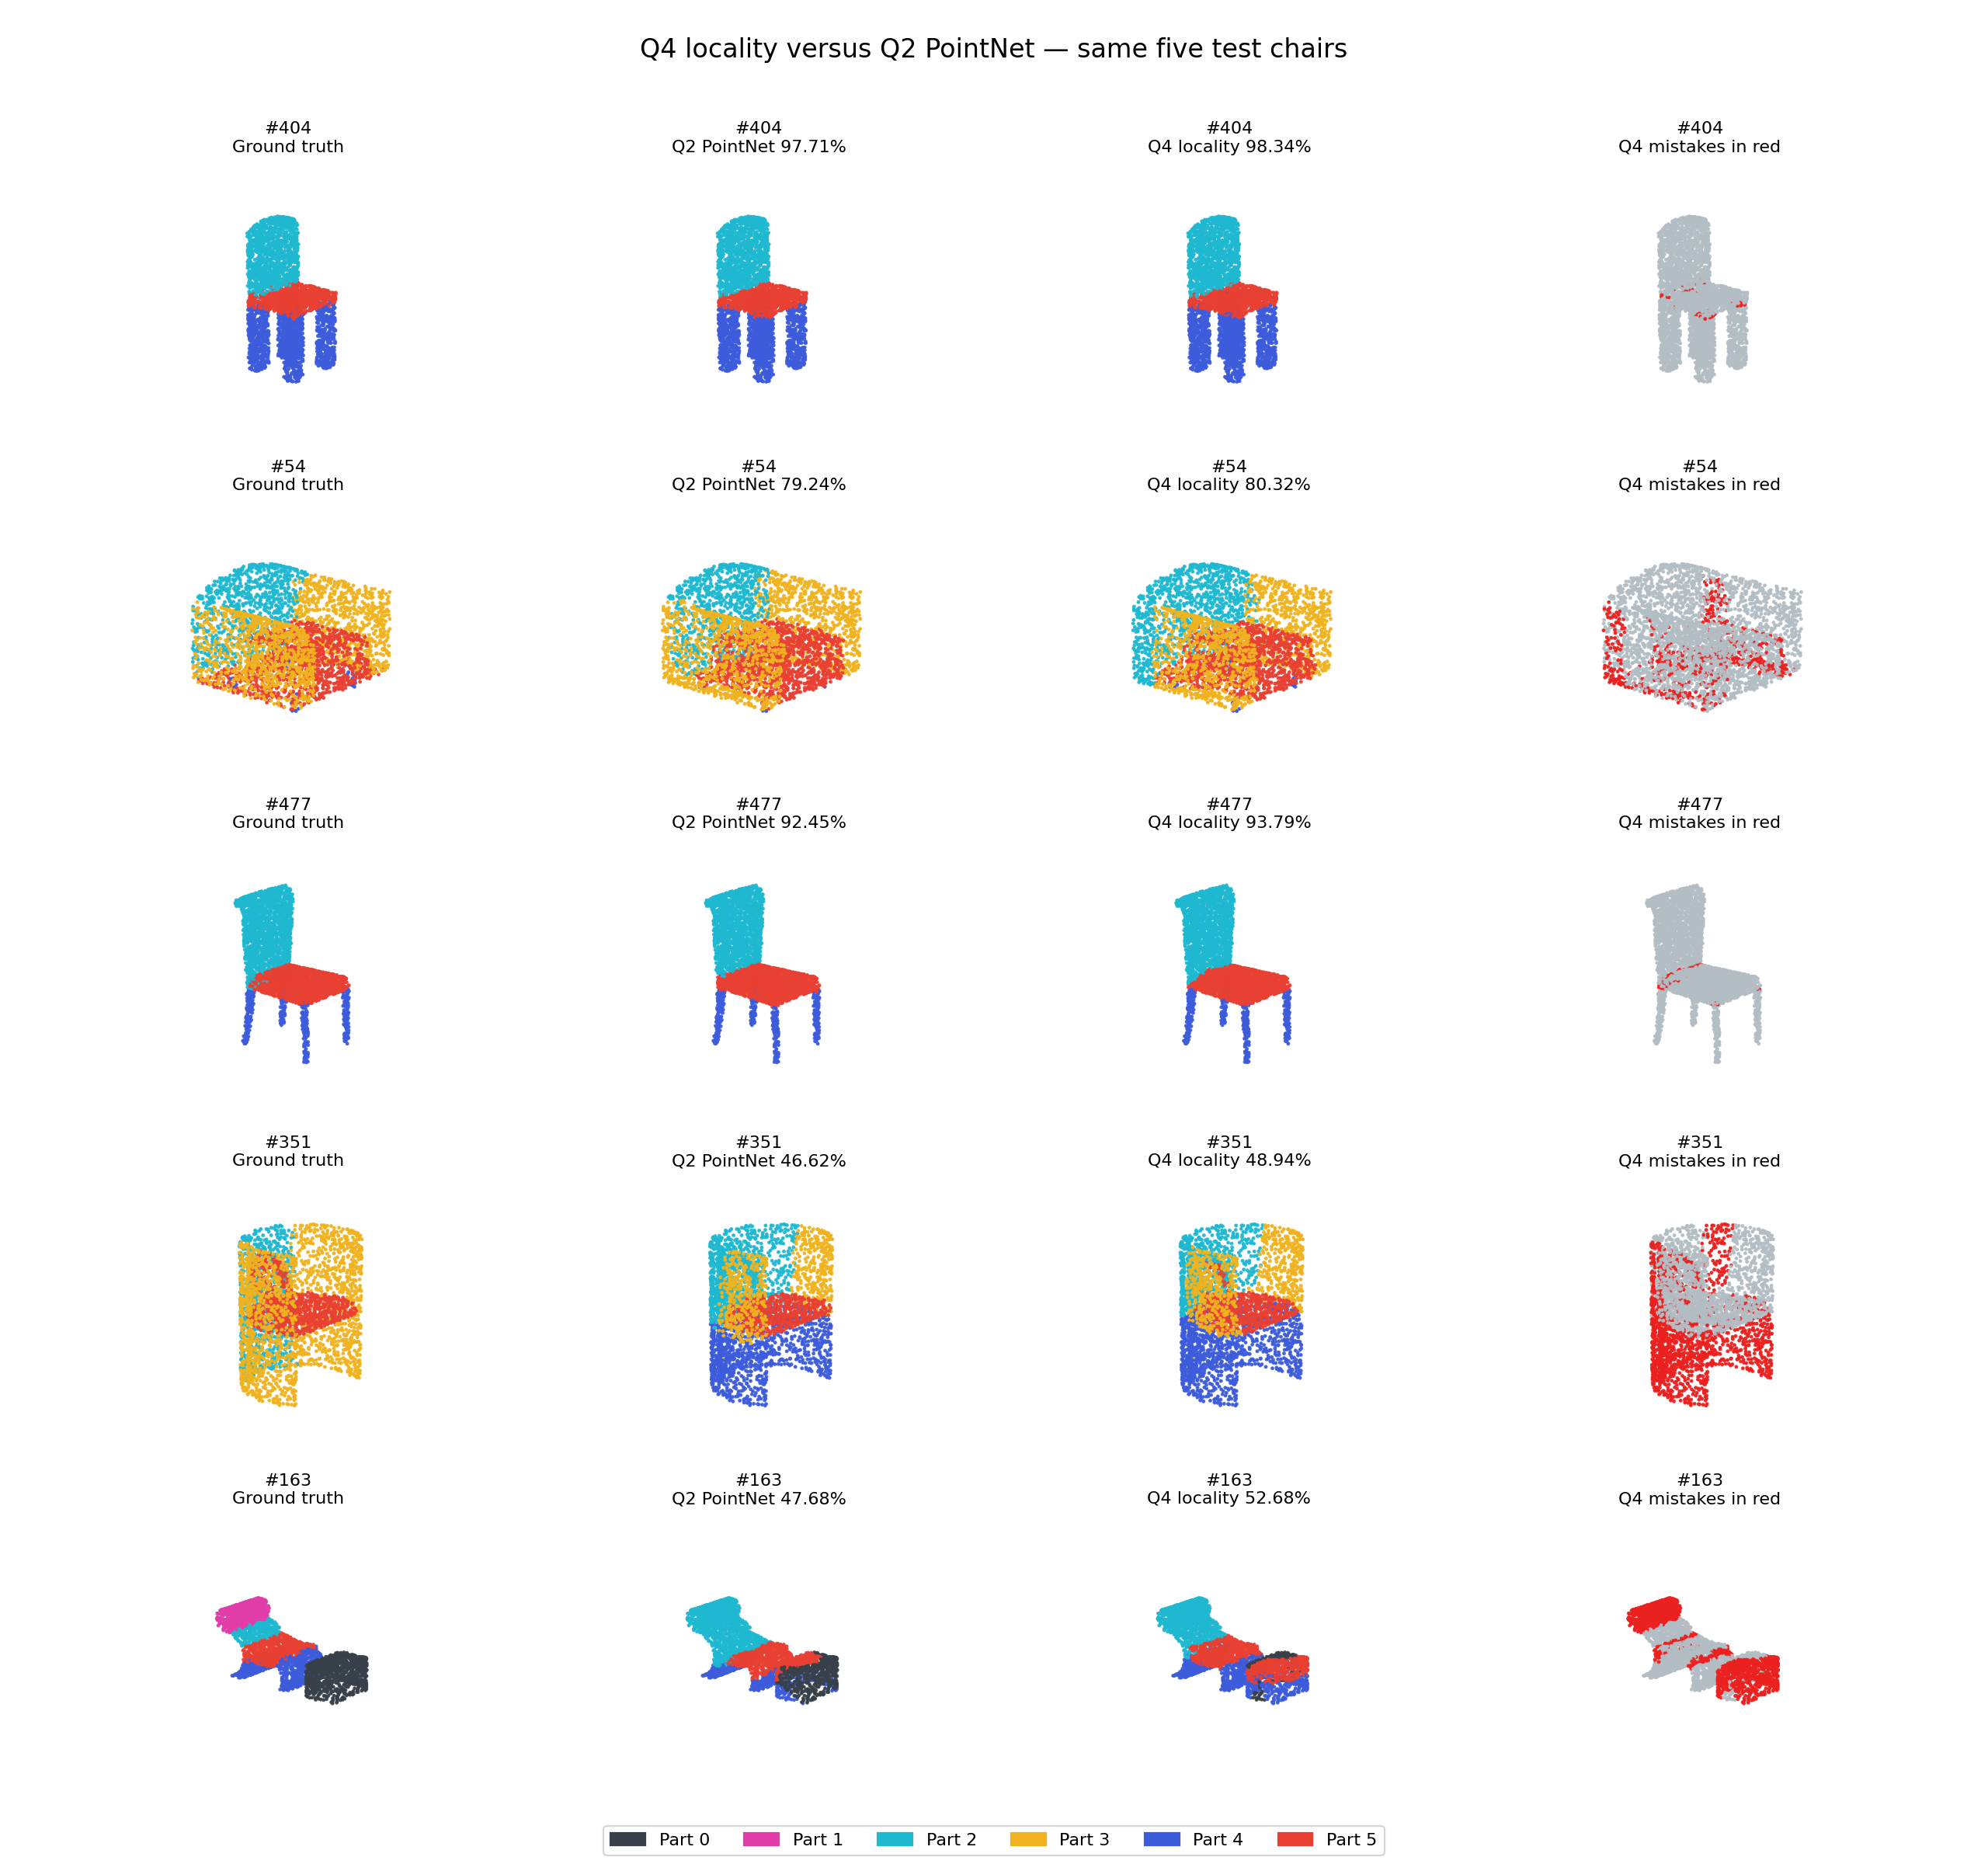
Q1 versus Q4 on the same objects, including all three Q1 failure examples.Q2 versus Q4 on the same five chairs; titles give per-object accuracy.
The locality classifier corrects 33 earlier errors and introduces 12; vase #619 is corrected, while chair #406 and lamp #758 remain wrong. Segmentation improves on all five displayed chairs, but the large side-panel error and rare upper-pad error persist. Overall point accuracy improves, although aggregate mean part IoU falls slightly from 64.33% to 63.84%; locality does not improve every part equally.