16-825 Assignment 2: Single View to 3D

Bo Jiang

1. Exploring Loss Functions

1.1 Fitting a Voxel Grid

Voxel fitting optimization compared with ground truth

1.2 Fitting a Point Cloud

Point cloud fitting optimization compared with ground truth

1.3 Fitting a Mesh

Mesh fitting optimization compared with ground truth

2. Reconstructing 3D from a Single Image

2.1 Image to Voxel Grid

Example 1

2.1 Image to Voxel Grid: input image, prediction, and ground truth for example 1
Input image, predicted 3D reconstruction, and ground truth.

Example 2

2.1 Image to Voxel Grid: input image, prediction, and ground truth for example 2
Input image, predicted 3D reconstruction, and ground truth.

Example 3

2.1 Image to Voxel Grid: input image, prediction, and ground truth for example 3
Input image, predicted 3D reconstruction, and ground truth.

Average F1@0.05: 37.314

Voxel model F1 score by distance threshold
Voxel model F1 score across distance thresholds.

2.2 Image to Point Cloud

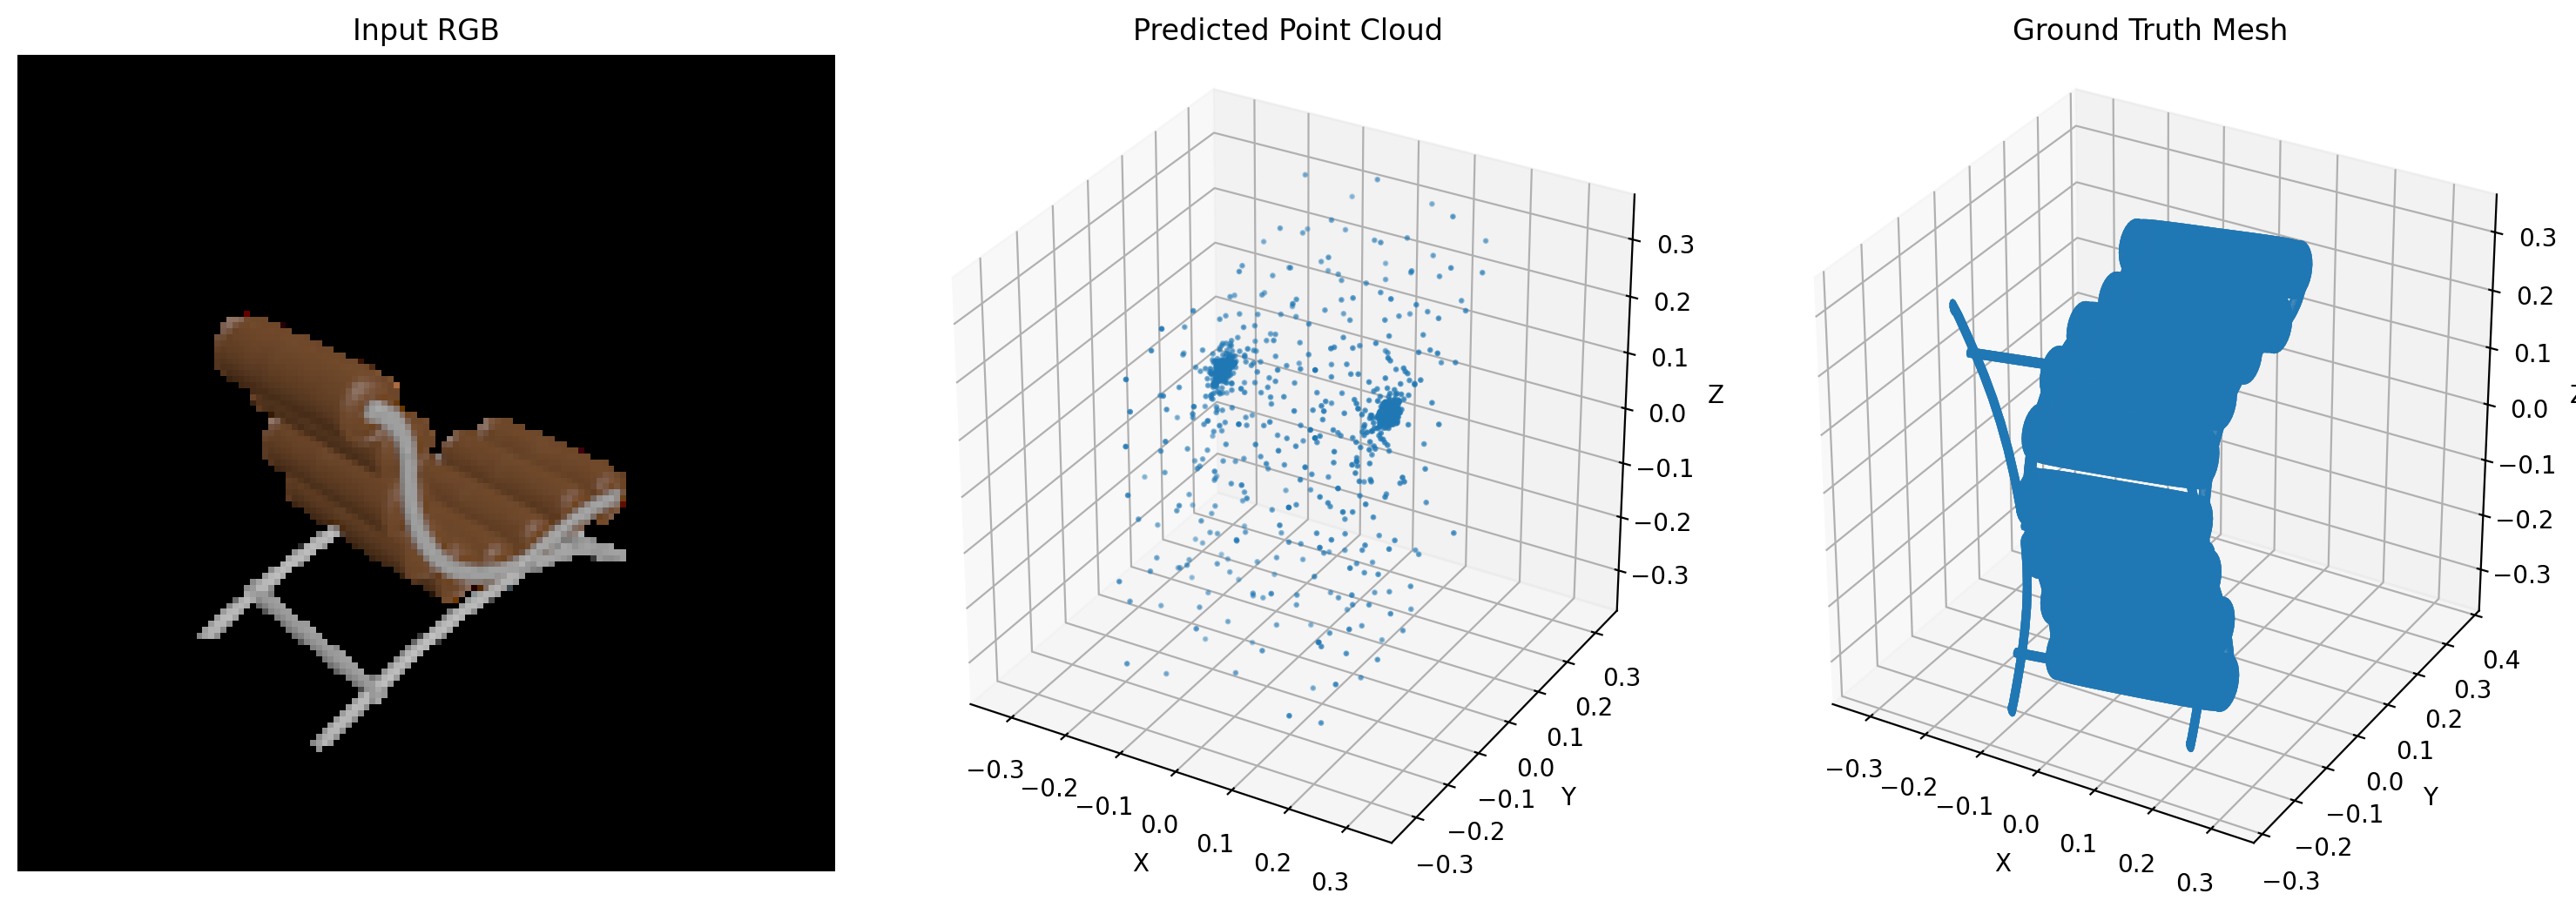
Example 1

2.2 Image to Point Cloud: input image, prediction, and ground truth for example 1
Input image, predicted 3D reconstruction, and ground truth.

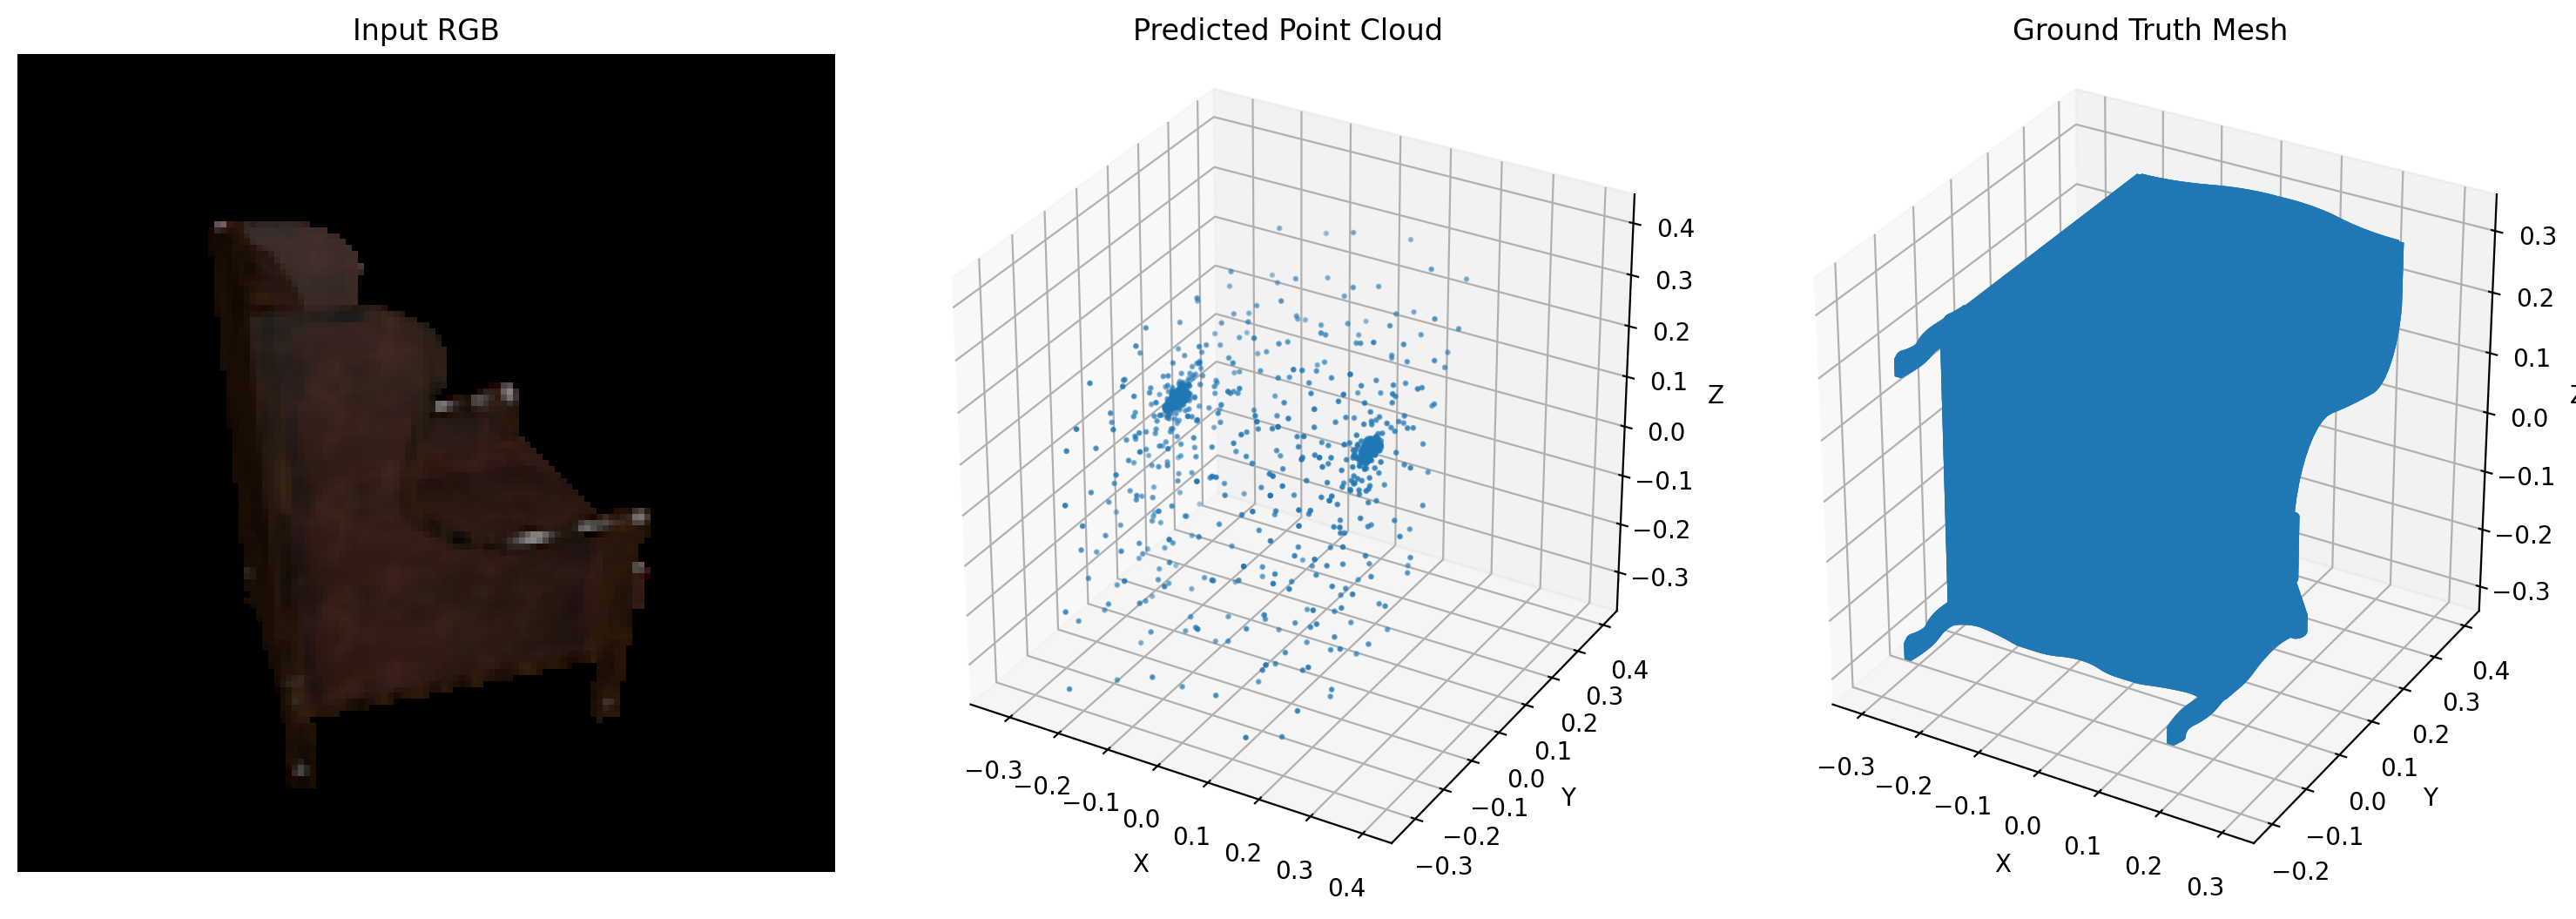
Example 2

2.2 Image to Point Cloud: input image, prediction, and ground truth for example 2
Input image, predicted 3D reconstruction, and ground truth.

Example 3

2.2 Image to Point Cloud: input image, prediction, and ground truth for example 3
Input image, predicted 3D reconstruction, and ground truth.

Average F1@0.05: 77.470

Point-cloud model F1 score by distance threshold
Point-cloud model F1 score across distance thresholds.

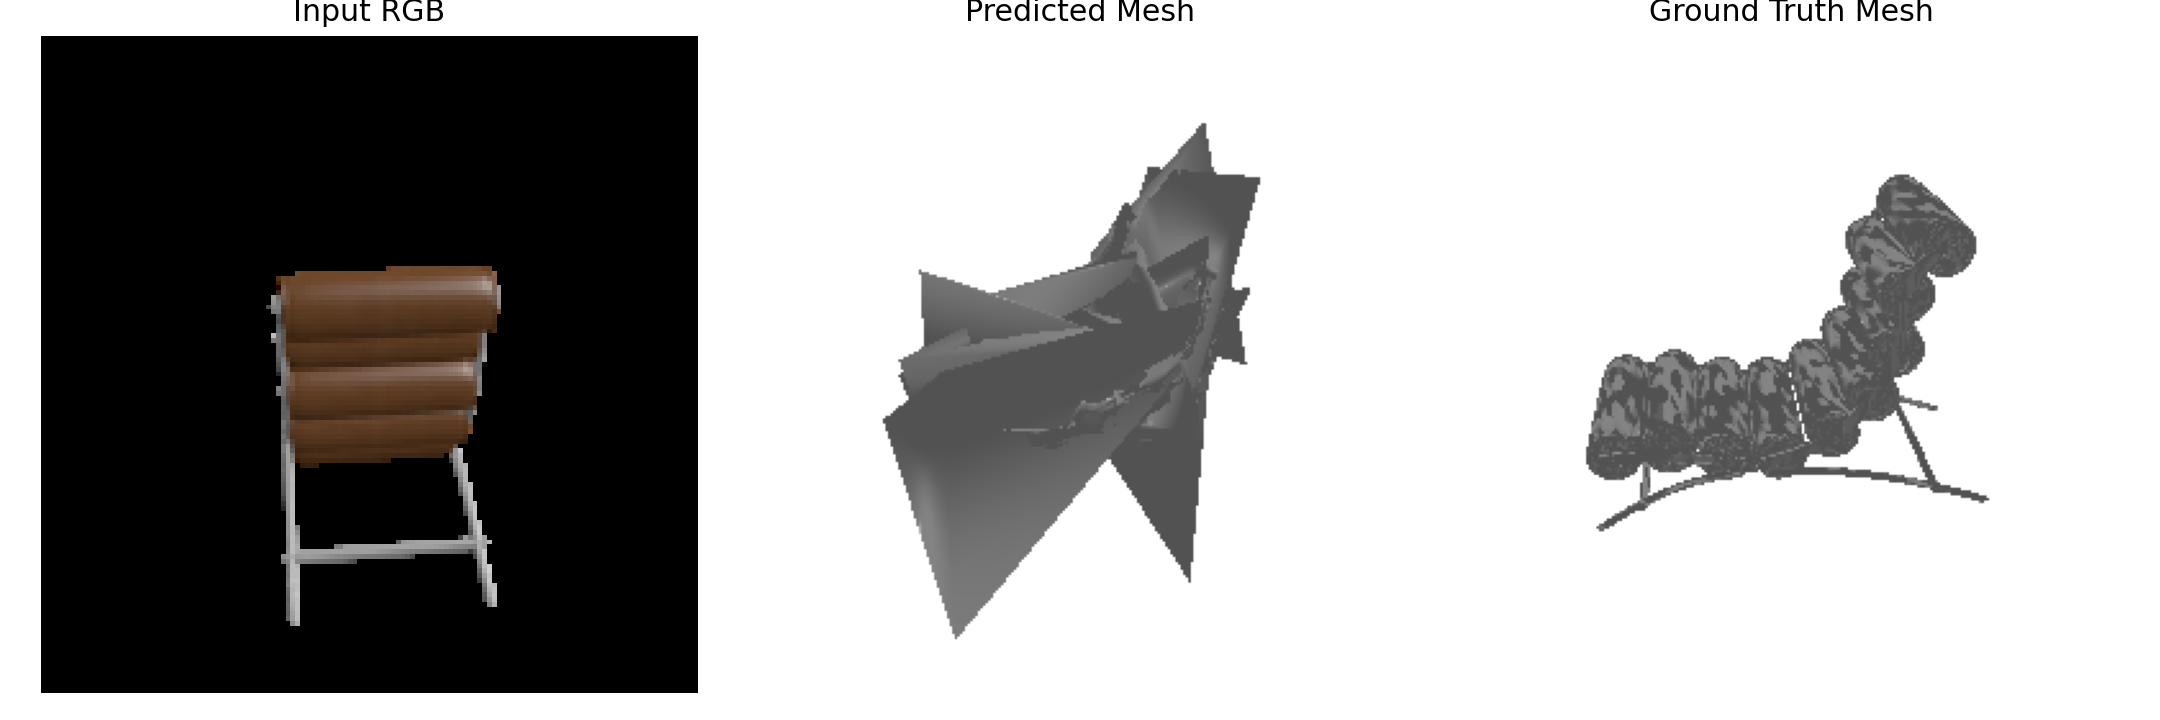
2.3 Image to Mesh

Example 1

2.3 Image to Mesh: input image, prediction, and ground truth for example 1
Input image, predicted 3D reconstruction, and ground truth.

Example 2

2.3 Image to Mesh: input image, prediction, and ground truth for example 2
Input image, predicted 3D reconstruction, and ground truth.

Example 3

2.3 Image to Mesh: input image, prediction, and ground truth for example 3
Input image, predicted 3D reconstruction, and ground truth.

Average F1@0.05: 67.735

Mesh model F1 score by distance threshold
Mesh model F1 score across distance thresholds.

2.4 Hyperparameter Analysis

I varied the mesh Laplacian smoothness weight while keeping the model architecture, learning rate, training steps, and other hyperparameters fixed.

Mesh smoothness weight vs. average F1@0.05 60 64 68 Average F1@0.05 0 0.01 0.1 1.0 w_smooth 66.491 66.237 64.485 61.104
Average test F1@0.05 falls as stronger Laplacian smoothing is applied.
Mesh smoothness weight (w_smooth) Average F1 @ 0.05
0 66.491
0.01 66.237
0.1 64.485
1.0 61.104
Discussion: Average F1@0.05 decreased from 66.491 with no smoothness regularization to 61.104 with w_smooth=1.0. Stronger smoothing likely restricts the local vertex deformations needed to represent thin chair parts and sharper structures such as legs and backrests. The small weight of 0.01 performed close to the unregularized model, suggesting weak smoothing provides little accuracy penalty in this experiment.

2.5 Model Interpretation

I reconstructed the same test object from three different input viewpoints to investigate whether the point-cloud model learns a view-invariant 3D representation. Despite substantial changes in the visible surfaces of the chair, the three predicted point clouds are highly similar in their overall geometry and point distribution. This suggests that the network has learned a representation that is relatively insensitive to camera viewpoint rather than simply reproducing the visible 2D silhouette. However, the predictions also appear more similar to one another than the input views might suggest, and they capture only coarse structure rather than the distinctive armrest and back geometry of this particular chair. This indicates that the model may rely strongly on a learned category-level chair prior: it produces a consistent generic 3D structure across views, but some instance-specific geometric details are lost.

Point-cloud predictions from three different input viewpoints
Point-cloud predictions from different viewpoints of the same object.
Ground-truth mesh used in the interpretation analysis
Ground-truth mesh reference for the interpretation analysis.

3. Additional Experiments

3.1 Experiment

Implicit reconstruction sample at step 0
Implicit reconstruction sample at step 10
Implicit reconstruction sample at step 25