Assignment 5: Point Cloud Classification and Segmentation
16-825 Learning for 3D Vision
All numbers on this page are produced by analysis.py from the saved checkpoints and the full test sets
(953 objects for classification, 617 chairs for segmentation, 10,000 points each). Point clouds are coloured by
height in the classification figures.
Q1. Classification Model (30 pts)
Model. PointNet without the transformation blocks. Every point (x, y, z) passes through the same per-point MLP, implemented as 1×1 convolutions with BatchNorm and ReLU (3 → 64 → 64 → 64 → 128 → 1024). A max-pool over all points then gives a 1024-D global feature that does not depend on the order of the points. A classifier head (1024 → 512 → 256 → 3, BatchNorm, ReLU, dropout 0.3) produces the logits, and a softmax over them is the predicted probability distribution. Training uses all 10,000 points per object, cross-entropy, Adam (lr 1e-3, batch 32) with a cosine decay to 1e-5 over 250 epochs, and no data augmentation (so that Q3 measures the model as trained). As in the starter code, the checkpoint with the best test accuracy is kept. I also report the final epoch so that the selection effect is visible. I fixed one bug in the starter training loop: epoch_loss += loss kept every batch's autograd graph alive until the end of the epoch, so it now accumulates loss.item(). The best checkpoint is from epoch 226 (97.80%). The final epoch reaches 97.38%, so selecting on the test set adds about 0.4 points.
| pred chair | pred vase | pred lamp | |
|---|---|---|---|
| true chair | 616 | 0 | 1 |
| true vase | 0 | 93 | 9 |
| true lamp | 1 | 10 | 223 |

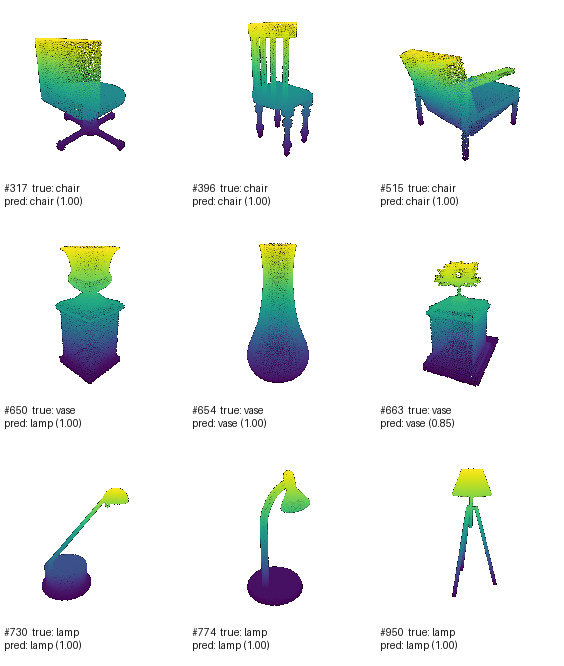
Random test objects
Three random test objects per class, with the predicted class and its softmax probability.
Failure cases
| True class | Test objects | Misclassified | Mistakes (predicted class, confidence) |
|---|---|---|---|
| chair | 617 | 1 | #406 → lamp (1.00) |
| vase | 102 | 9 | #673 → lamp (1.00), #670 → lamp (1.00), #685 → lamp (1.00), #651 → lamp (1.00), #650 → lamp (1.00), #667 → lamp (1.00) … |
| lamp | 234 | 11 | #827 → vase (1.00), #922 → vase (1.00), #916 → vase (0.99), #839 → vase (0.99), #767 → vase (0.98), #869 → chair (0.98) … |
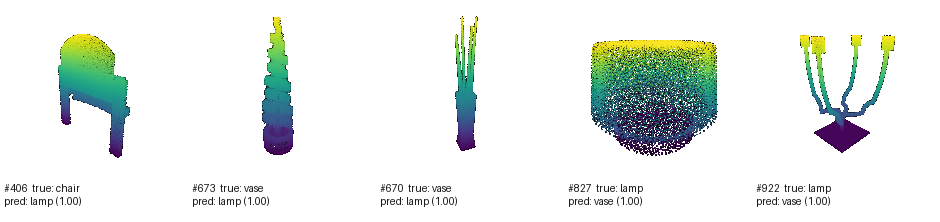
Mistakes are almost all vase ↔ lamp confusions: 19 of the 21 errors. Chairs are recognised 616/617 times. The failures are informative. (1) Chair #406 is an enclosed, hood-like chair: tall and narrow, with a rounded top and solid sides, and no open seat or separate legs in its silhouette. Taken as a whole it is a rounded cap on a narrow body, closer to a lampshade on a stand than to the open back-seat-legs layout of a typical chair. (2) Vases #673 and #670 are tall, thin, rotationally symmetric objects. #670 also has stems sticking out of the top, which is the profile of a lamp stem or of a lamp with several arms. (3) Lamp #827 is a large bowl-shaped shade with no visible stand, so it looks like a wide vase, and lamp #922 is a candelabra whose arms rise out of a base like flowers out of a vase. The common cause is that PointNet's single max-pooled feature records which local shapes occur somewhere in the object but not how they are connected, and vases and lamps share the same vocabulary of parts: a body on a vertical axis, with thin parts on top. Two more factors make it worse. Vases are only 11% of the training set, so ambiguous shapes tend to drift towards lamp: 9 of 102 vases are wrong, against 11 of 234 lamps. And the network is overconfident: most mistakes are made with probability ≥ 0.98, so the softmax score cannot be used to flag them.
Q2. Segmentation Model (30 pts)
Model. The same per-point trunk as Q1. Each point's 64-D local feature (after the second layer) is concatenated with the 1024-D max-pooled global feature, and a per-point head (1088 → 512 → 256 → 128 → 6, 1×1 convolutions with BatchNorm and ReLU) predicts the part of every point. Each point therefore sees only its own coordinates plus one summary of the whole chair. Training uses the same settings as Q1, with per-point cross-entropy.
Part colours: 0 1 2 3 4 5


| Part | Test points | Recall |
|---|---|---|
| part 0 | 20,188 | 91.3% |
| part 1 | 7,865 | 15.4% |
| part 2 | 1,972,401 | 93.4% |
| part 3 | 563,263 | 78.9% |
| part 4 | 1,252,860 | 90.4% |
| part 5 | 2,353,423 | 92.0% |
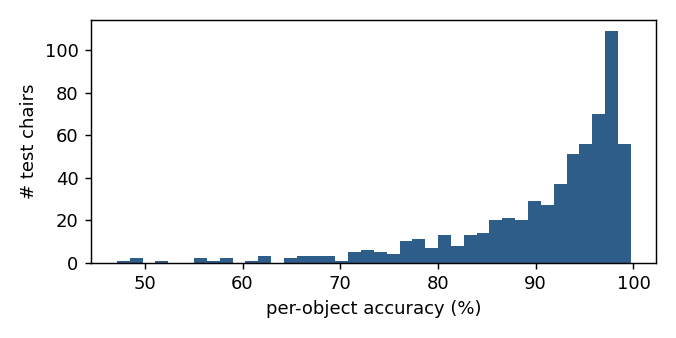
Inferring from the colours, the parts are: back (part 2, cyan), seat (part 5, red), legs or base (part 4, blue) and arms (part 3, yellow), plus two rare parts (part 0, grey, and part 1, magenta, e.g. a headrest or cushion on top; together under 0.5% of the points). Good results (#471 at 99.7%, #526 at 97.3%, #395 at 94.0%) are ordinary chairs whose parts are separated geometrically: the back is a vertical slab above the seat, and the legs are thin and below it. For these, a point's height and its position relative to the whole chair (the global feature) almost determine the label, and the only errors are a thin band of mixed colours at part boundaries, where neighbouring points get inconsistent labels because PointNet labels each point independently. Bad results are sofas and box-shaped armchairs. On #255 (47.1%) the network labels the whole solid block below the cushions as seat (red), while the annotation calls it the base (blue). On #26 (49.5%) it misses the magenta top part completely and mixes seat, arms and back. In these shapes the part boundaries are conventions, not geometric edges, and the parts sit at different heights from a normal chair. A model that labels points mostly by absolute position has nothing else to use. The per-part recall shows the same pattern: the large parts are 90–93% correct, arms (78.9%) are confused with the seat and back they touch, and part 1, with 0.1% of the points, is almost never predicted (15.4%). Overall, two thirds of the test chairs are segmented above 90%, and only 4% fall below 70%.
Q3. Robustness Analysis (20 pts)
Both experiments, plus a third one, evaluate the Q1/Q2 checkpoints without retraining on modified copies of the full test sets, and report accuracy as in Q1/Q2. Each experiment is run on both tasks. For comparison, the tables and plots also include the Q4 Point Transformer, which was trained in the same way (no augmentation). The sample figures show PointNet on three fixed test objects (one per class, all classified correctly at baseline) and on one chair of median segmentation accuracy, so that every row starts from the Q1/Q2 result.
Experiment 1: rotating the input
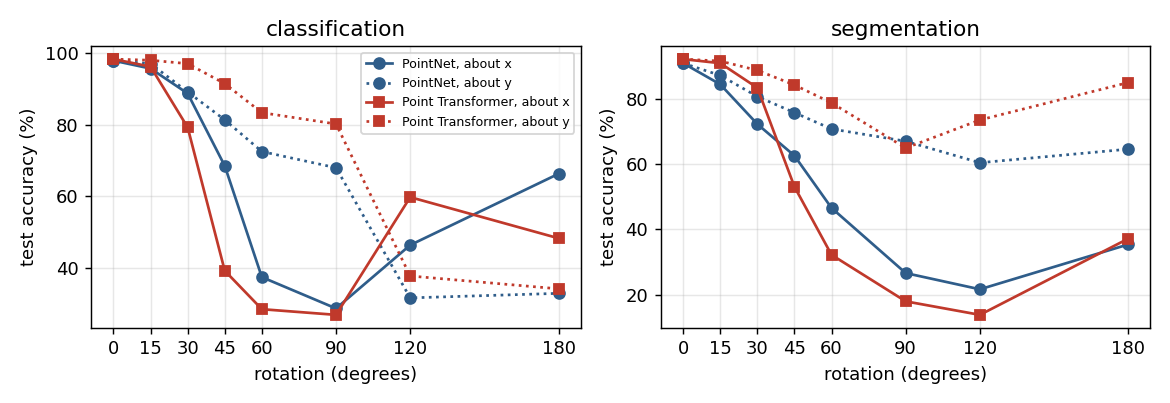
Procedure. Every test cloud is rotated about the origin, where the objects are centred, by 0–180°, either about the x axis (tilting the object forward, so its up axis changes) or about the y axis (spinning it about its own up axis, as a turntable would). The labels stay the same, and the 0° row is the Q1/Q2 result.
Rotation about x (tilting)
| PointNet cls | PointNet seg | Point Transformer cls | Point Transformer seg | |
|---|---|---|---|---|
| 0° | 97.80 | 90.80 | 98.22 | 92.05 |
| 15° | 95.59 | 84.33 | 96.12 | 90.80 |
| 30° | 88.67 | 72.17 | 79.22 | 83.27 |
| 45° | 68.52 | 62.50 | 39.35 | 53.01 |
| 60° | 37.57 | 46.52 | 28.65 | 32.17 |
| 90° | 28.86 | 26.59 | 27.07 | 17.95 |
| 120° | 46.48 | 21.63 | 59.81 | 13.81 |
| 180° | 66.32 | 35.36 | 48.37 | 37.13 |
Rotation about y (the up axis)
| PointNet cls | PointNet seg | Point Transformer cls | Point Transformer seg | |
|---|---|---|---|---|
| 0° | 97.80 | 90.80 | 98.22 | 92.05 |
| 15° | 96.96 | 87.06 | 97.90 | 91.46 |
| 30° | 89.09 | 80.60 | 96.96 | 88.62 |
| 45° | 81.32 | 75.68 | 91.40 | 84.14 |
| 60° | 72.51 | 70.68 | 83.32 | 78.67 |
| 90° | 68.00 | 66.93 | 80.17 | 64.86 |
| 120° | 31.79 | 60.36 | 37.88 | 73.43 |
| 180° | 33.05 | 64.51 | 34.31 | 84.89 |


Interpretation. PointNet without transformation blocks or rotation augmentation is not rotation invariant. Its per-point features are functions of absolute coordinates, so it has effectively learned objects in their canonical pose. Small rotations (≤ 15°) cost 1–7 points, but tilting by 45° about x drops classification to 68.5% and segmentation to 62.5%, and at 90° both collapse (28.9% and 26.6%). Breaking the classification result down by class shows what is being learned. Spinning about the up axis barely affects vases and lamps (86–93% even at 180°), because they are close to rotationally symmetric about that axis. But a chair turned to face backwards (180° about y) is recognised only 1.6% of the time: 579 of 617 are called lamps. The network has learned the direction a chair faces, not just its parts. Segmentation degrades more gracefully under spinning than under tilting (66.9% vs 26.6% at 90°), because a spin keeps every point's height and the network relies heavily on height (legs low, seat in the middle, back high). Tilting scrambles exactly that cue, as the chair figure shows: at 60° the tilted back, now lying horizontally at seat height, is labelled seat, and at 90° the legs, which now point upwards, are partly labelled back. Rotation augmentation during training, or an aligning T-Net, would be the fix.
Experiment 2: number of points per object
Procedure. Instead of all 10,000 points, each test object is represented by a random subset of N points (10,000 down to 20), sampled without replacement. The same indices are used for all objects in one draw, as in the provided eval scripts. Each N is repeated with 3 random draws and the table reports mean ± standard deviation. Segmentation accuracy is computed on the points that were kept.
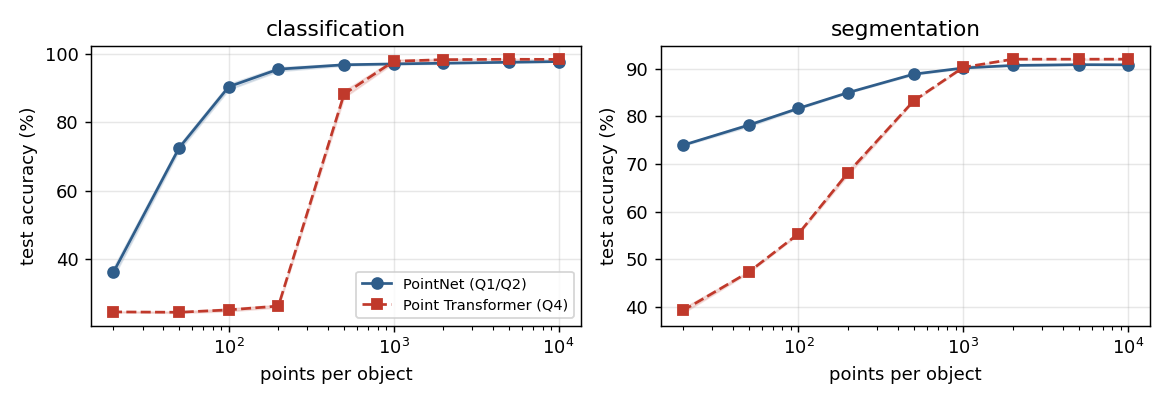
| PointNet cls | PointNet seg | Point Transformer cls | Point Transformer seg | |
|---|---|---|---|---|
| 10,000 points | 97.80 ± 0.00 | 90.80 ± 0.00 | 98.43 ± 0.00 | 91.98 ± 0.03 |
| 5,000 points | 97.59 ± 0.00 | 90.82 ± 0.02 | 98.46 ± 0.05 | 91.97 ± 0.00 |
| 2,000 points | 97.31 ± 0.13 | 90.67 ± 0.02 | 98.36 ± 0.18 | 91.98 ± 0.02 |
| 1,000 points | 97.10 ± 0.13 | 90.13 ± 0.09 | 97.87 ± 0.47 | 90.27 ± 0.04 |
| 500 points | 96.85 ± 0.26 | 88.84 ± 0.11 | 88.25 ± 0.97 | 83.24 ± 0.08 |
| 200 points | 95.56 ± 0.56 | 84.97 ± 0.06 | 26.16 ± 0.36 | 68.20 ± 0.44 |
| 100 points | 90.42 ± 0.80 | 81.67 ± 0.12 | 25.04 ± 0.39 | 55.38 ± 0.13 |
| 50 points | 72.51 ± 0.76 | 78.17 ± 0.29 | 24.34 ± 0.17 | 47.36 ± 0.14 |
| 20 points | 36.10 ± 1.35 | 73.96 ± 0.08 | 24.45 ± 0.09 | 39.31 ± 0.51 |


Interpretation. PointNet is very robust to the number of points down to a few hundred: 97.8% → 96.9% for classification and 90.8% → 88.8% for segmentation at 500 points, 20× fewer than in training. This is what max-pooling predicts. The global feature is set by a small number of critical points that reach the maximum in each channel, and a random subset of a few hundred points still contains near-maximal points for each channel. Each point's own feature does not depend on how many other points there are. Below about 100 points the outline itself disappears: thin legs and stems are represented by 0–2 points, and classification falls to 72.5% at 50 points and 36.1% at 20. The spread across the three draws stays small (at most 1.4 points). Segmentation falls more slowly (74.0% at 20 points), because a point's label is still largely given by its height. The Point Transformer (red) behaves very differently. It matches PointNet down to 1,000 points, its training density, but collapses below it: 88.2% at 500 and 26% at 200, where it calls 857 of the 953 test objects lamps. Its k = 16 neighbourhoods are defined by count, not distance, so in a sparser cloud they cover a much larger region and the local features no longer look like anything seen in training. Locality brings this density sensitivity with it. Training on randomly varied point counts would address it.
Experiment 3 (additional): Gaussian noise on the coordinates
Procedure. Independent Gaussian noise with standard deviation σ (0 to 0.08) is added to every coordinate. The objects are normalised to fit roughly inside [−1, 1]³, so σ = 0.02 is about 1% of an object's extent and σ = 0.08 visibly blurs thin parts such as chair legs and lamp stems.
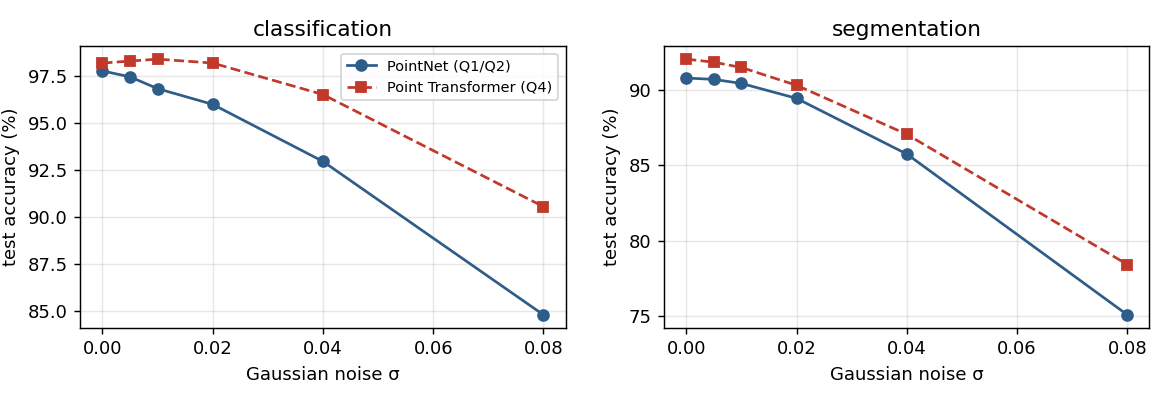
| PointNet cls | PointNet seg | Point Transformer cls | Point Transformer seg | |
|---|---|---|---|---|
| σ = 0.0 | 97.80 | 90.80 | 98.22 | 92.05 |
| σ = 0.005 | 97.48 | 90.71 | 98.32 | 91.85 |
| σ = 0.01 | 96.85 | 90.44 | 98.43 | 91.49 |
| σ = 0.02 | 96.01 | 89.45 | 98.22 | 90.32 |
| σ = 0.04 | 92.97 | 85.76 | 96.54 | 87.06 |
| σ = 0.08 | 84.78 | 75.10 | 90.56 | 78.44 |


Interpretation. Both models tolerate small noise: up to σ = 0.02 (about 1% of the object's extent) PointNet loses only 1.8 points on classification and 1.4 on segmentation. Larger noise hurts in two ways. Max-pooling is driven by extreme points, and noise pushes points outwards, so the global feature drifts. And thin structures such as legs, lamp stems and chair-back slats blur into a cloud that is several noise-widths thick. At σ = 0.08 PointNet is at 84.8% and 75.1%, and the segmentation figure shows the part boundaries dissolving into speckle, because each noisy point is labelled on its own. The Point Transformer degrades less (90.6% and 78.4% at σ = 0.08). Its attention aggregates features over 16 neighbours and its encoder pools over neighbourhoods, which averages out independent per-point noise.
Q4. Bonus: Locality with a Point Transformer (20 pts)
Model. A compact Point Transformer (Zhao et al., ICCV 2021), written from scratch in models_pt.py. Locality enters in two ways. (1) Local vector self-attention: each point attends only to its k = 16 nearest neighbours. The attention weights are a per-channel function γ(φ(xi) − ψ(xj) + δ), where δ = MLP(pi − pj) is a learned encoding of the relative position. A softmax over the neighbours weights the values α(xj) + δ. Unlike PointNet, every feature therefore depends on the local geometry around the point. (2) A hierarchy: four Transition-Down stages each keep ¼ of the points by farthest-point sampling and max-pool an MLP of [pj − pi, fj] over each kept point's 16 neighbours (channels 32 → 64 → 128 → 256 → 512). Receptive fields grow from small patches to the whole object. Classification averages the deepest features and applies an MLP head. Segmentation adds a U-Net-style decoder: Transition-Up layers interpolate coarse features back to the finer points (inverse-distance weights over the 3 nearest coarse points), add skip connections from the encoder, and refine them with a further Point Transformer block. kNN and farthest-point sampling use PyTorch3D's CUDA kernels.
Training. The same optimiser, schedule and epochs as Q1/Q2 (Adam, lr 1e-3, cosine decay, 250 epochs, batch 32, no augmentation). Because attention over 10,000 points is expensive, every training batch uses a fresh random subset of 1,024 points (classification) or 2,048 points (segmentation). At test time the full 10,000-point cloud is split into random, disjoint chunks of that size that cover every point. Classification averages the softmax over the chunks, and segmentation labels each point from its chunk, so the accuracy is measured on exactly the same 10,000 test points as PointNet. To check that any gain is due to locality and not to subset training (a form of augmentation), I also trained PointNet with exactly the same subset training and chunked evaluation (middle row).
| Model | Params (cls / seg) | Classification | Segmentation |
|---|---|---|---|
| PointNet (Q1/Q2), all 10,000 points | 0.81M / 0.87M | 97.80% | 90.80% |
| PointNet trained on the same point subsets as the Point Transformer | same | 97.94 ± 0.05% | 90.75 ± 0.01% |
| Point Transformer (Q4) | 3.14M / 3.96M | 98.32 ± 0.16% | 92.01 ± 0.02% |
The two subset-trained models label a 10,000-point cloud chunk by chunk with a random split, so their accuracy is the mean ± std over 5 random splits. The per-class numbers, the confusion matrix and the examples below use one of those splits.
Point Transformer confusion matrix (per class: chair 99.8%, vase 88.2%, lamp 98.3%):
| pred chair | pred vase | pred lamp | |
|---|---|---|---|
| true chair | 616 | 0 | 1 |
| true vase | 1 | 90 | 11 |
| true lamp | 1 | 3 | 230 |
Classification: where the two models disagree
Of PointNet's 21 mistakes, the Point Transformer fixes 13; it gets 9 objects wrong that PointNet got right.

Segmentation: PointNet vs Point Transformer
Each GIF shows ground truth | PointNet | Point Transformer: Q2's two worst chairs, its median chair, and the chair with the largest gain.


Discussion. Segmentation benefits clearly from locality. The Point Transformer improves overall accuracy from 90.80% to 92.01% (mean over 5 random chunk splits), and the median chair from 94.0% to 95.4%. The controlled baseline shows that this is not due to subset training: PointNet trained and evaluated in exactly the same way reaches 90.75%, so locality accounts for about +1.3 points. The gains are largest exactly where Q2 failed. Part boundaries are cleaner, because each label now depends on the neighbourhood rather than on one point. Box-shaped chairs improve most: #426 goes from 67.1% to 92.0%, where PointNet splits the skirted seat into three parts, and the worst Q2 chair #255 goes from 47.1% to 70.6%. For classification the gain is small: 97.80% → 98.32 ± 0.16%, but PointNet trained on the same subsets already reaches 97.94 ± 0.05%, so most of that difference comes from training on random subsets (a form of augmentation). In the split shown, the Point Transformer fixes 13 of PointNet's 21 mistakes, mostly lamps and the hooded chair #406, and introduces 9 new ones, mostly vases. Lamp accuracy rises from 95.3% to 98.3% while vase accuracy falls from 91.2% to 88.2%, so the remaining errors are still the vase/lamp ambiguity. Costs: about 4× the parameters (3.1M / 4.0M vs 0.8M / 0.9M) and, even on 5–10× fewer points per forward pass, slower training (about 20 s / 32 s per epoch vs 14 s / 20 s on the same GPUs). It also inherits a density sensitivity that PointNet does not have (Q3, experiment 2), and it is more sensitive to tilting, while being more robust to noise and to spinning about the up axis.