Q1 · Exploring loss functions
We optimized source shapes to match target shapes using binary cross-entropy for voxels, a bidirectional Chamfer distance for point clouds, and Chamfer distance plus a mesh smoothness penalty for meshes. Each representation was fit until its loss reached zero at the displayed precision; the figures show the fitted result beside its target.


Q2 · Reconstructing 3D from one image
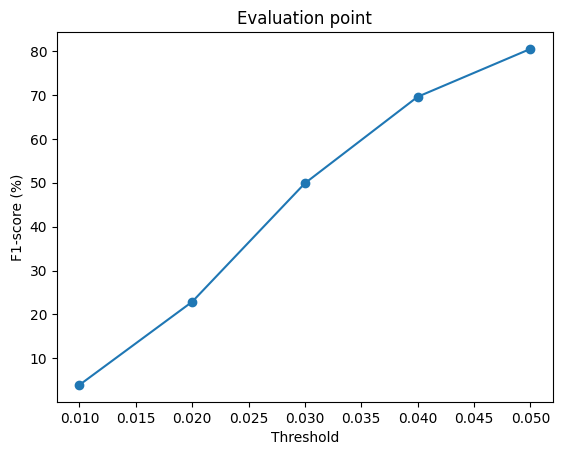
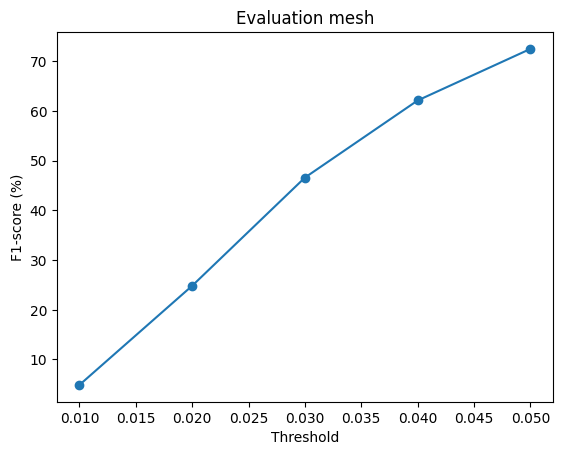
Each model uses a ResNet-18 image encoder with a representation-specific decoder. The voxel model predicts a 32³ occupancy grid; the point model predicts 1,000 points; and the mesh model deforms an icosphere template. Runs were continued from 5,000 to 11,000 total updates using seed 42 and batch size 32. Evaluation used 678 chair test shapes.
| Representation | F1@0.05 | Evaluated | Skipped |
|---|---|---|---|
| Voxel | 63.955 | 677 / 678 | 1 empty predicted surface |
| Point cloud | 80.476 | 678 / 678 | 0 |
| Mesh (`w_smooth=0.1`) | 72.515 | 678 / 678 | 0 |
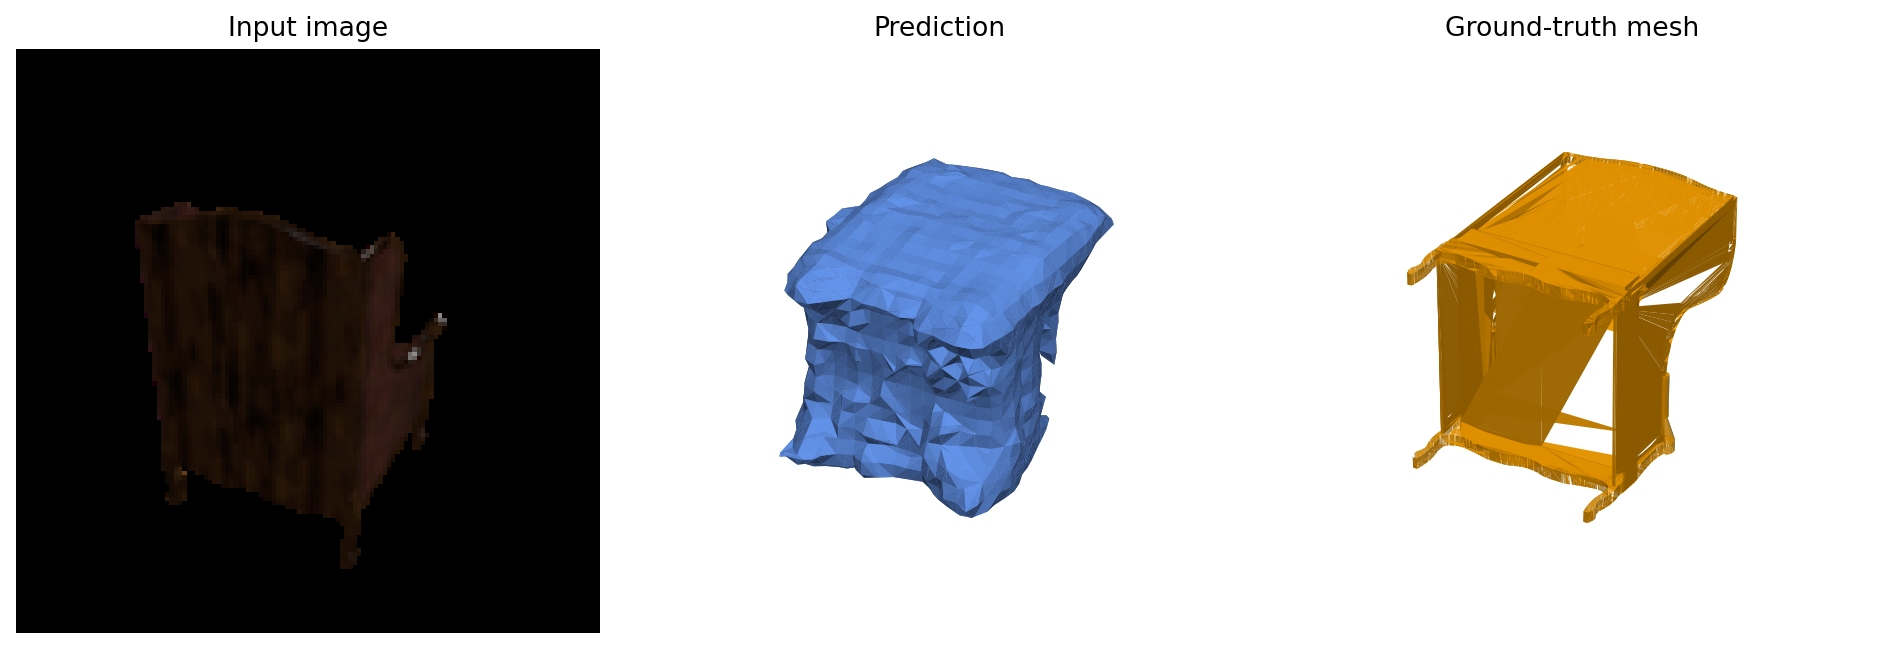
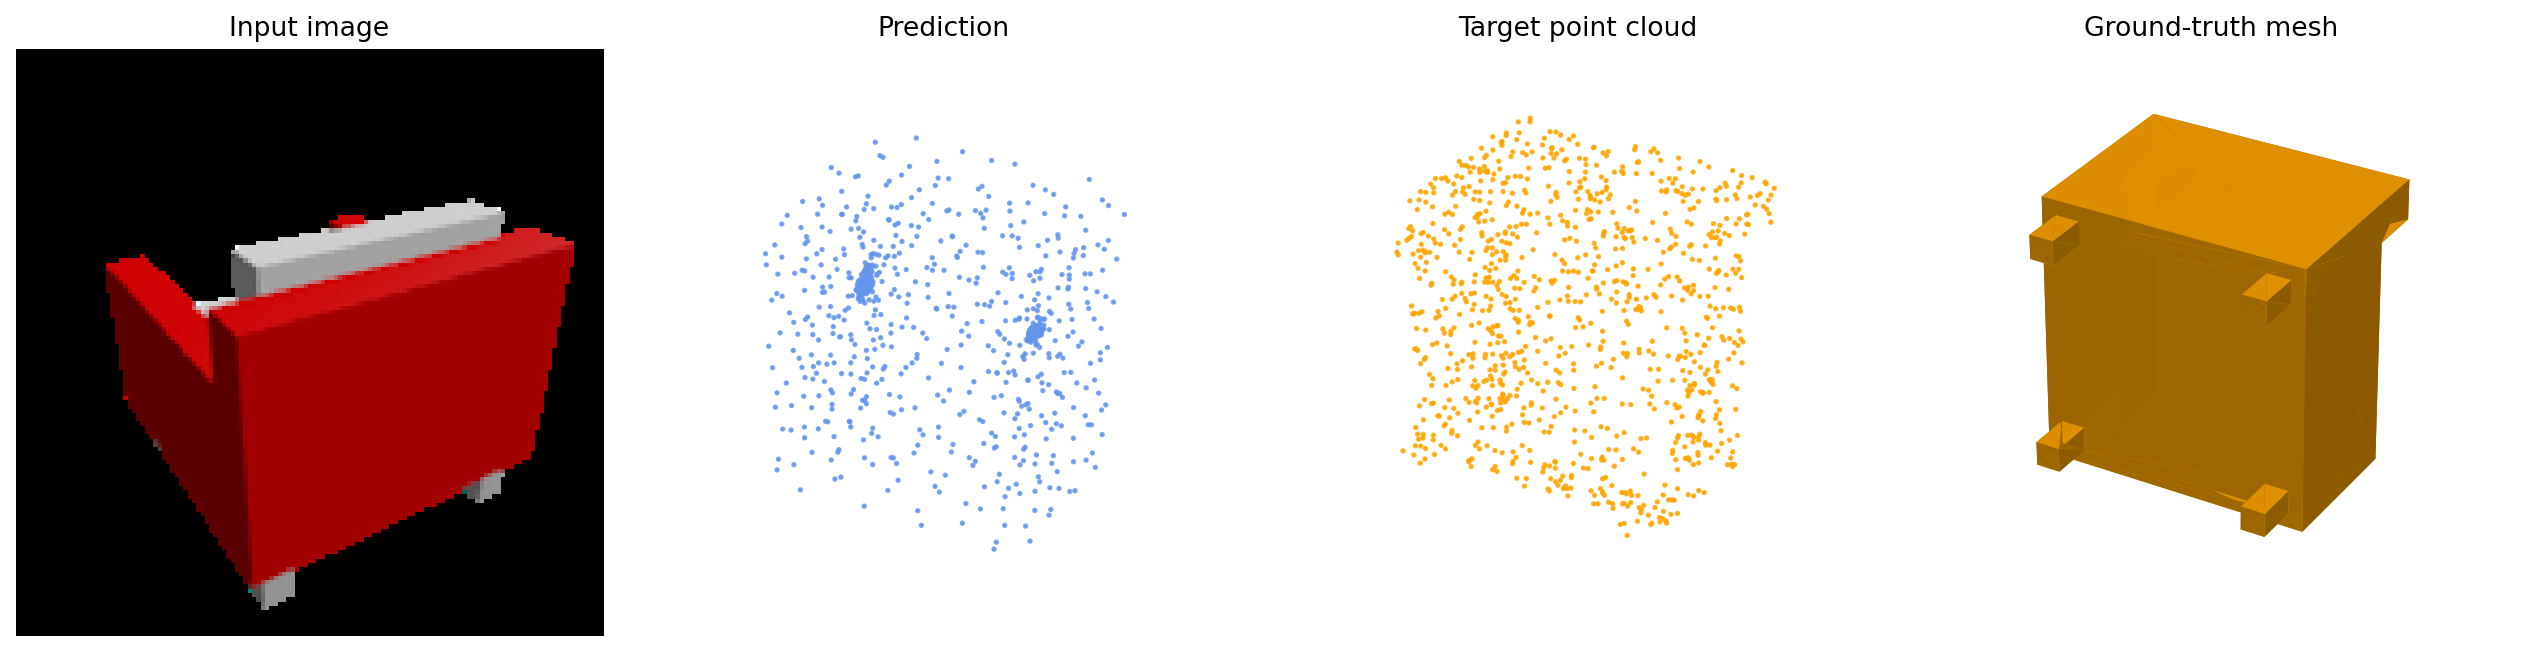
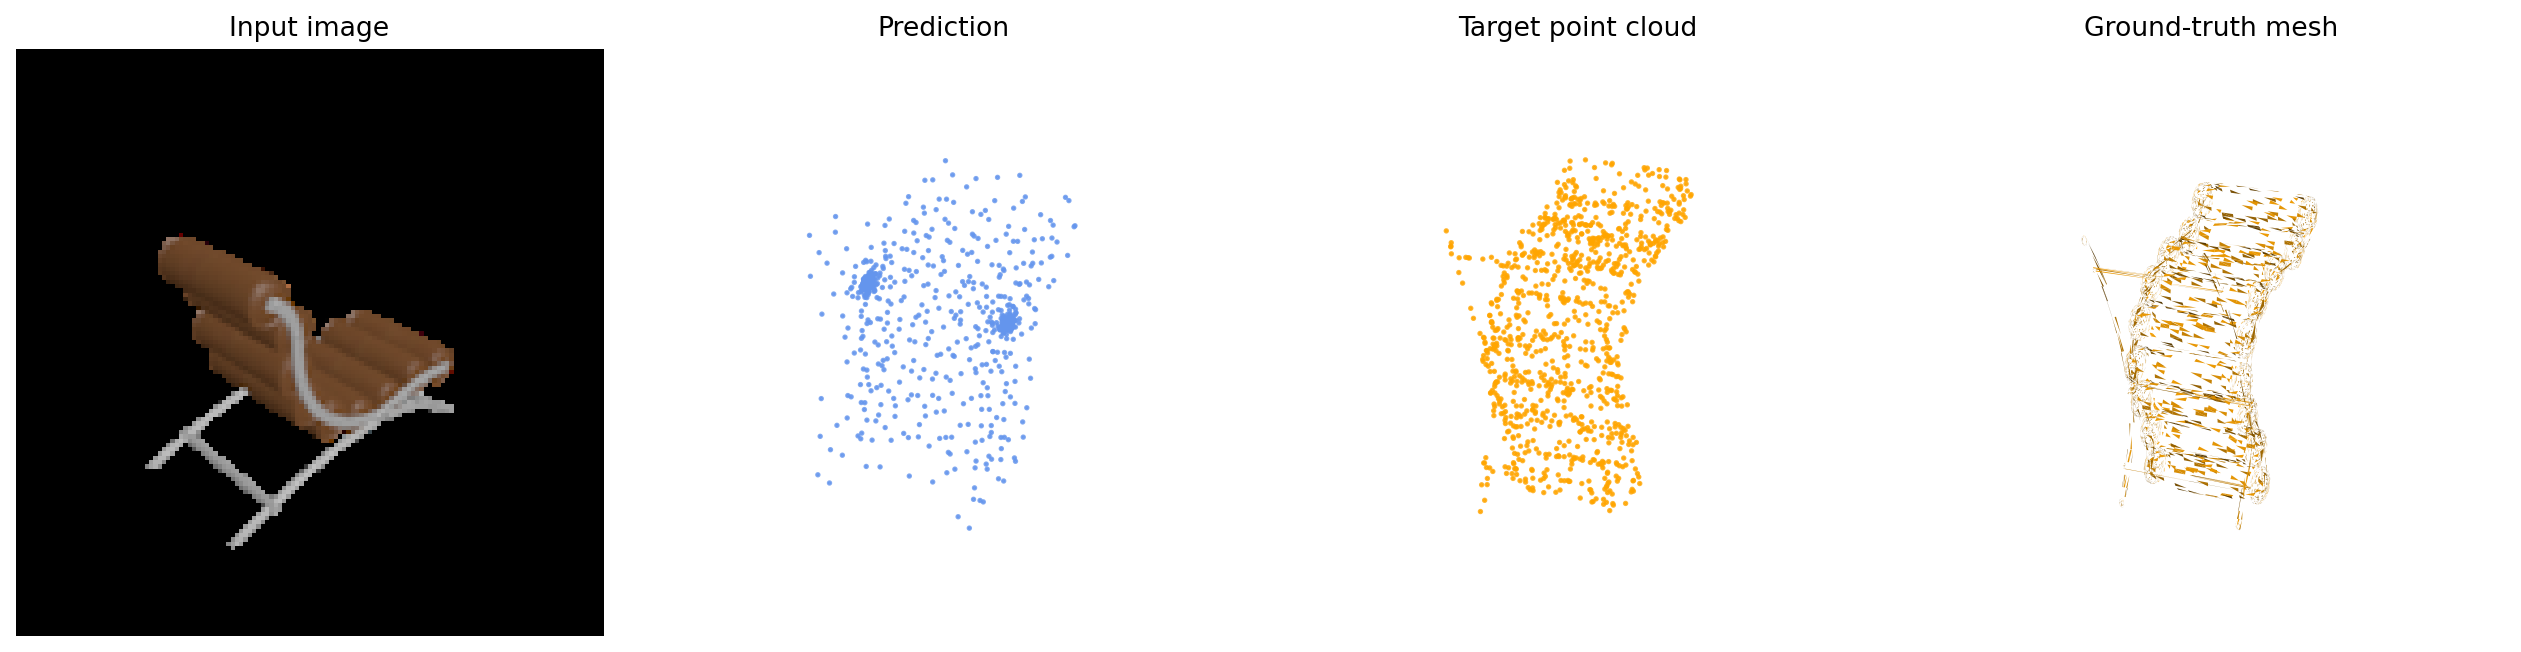
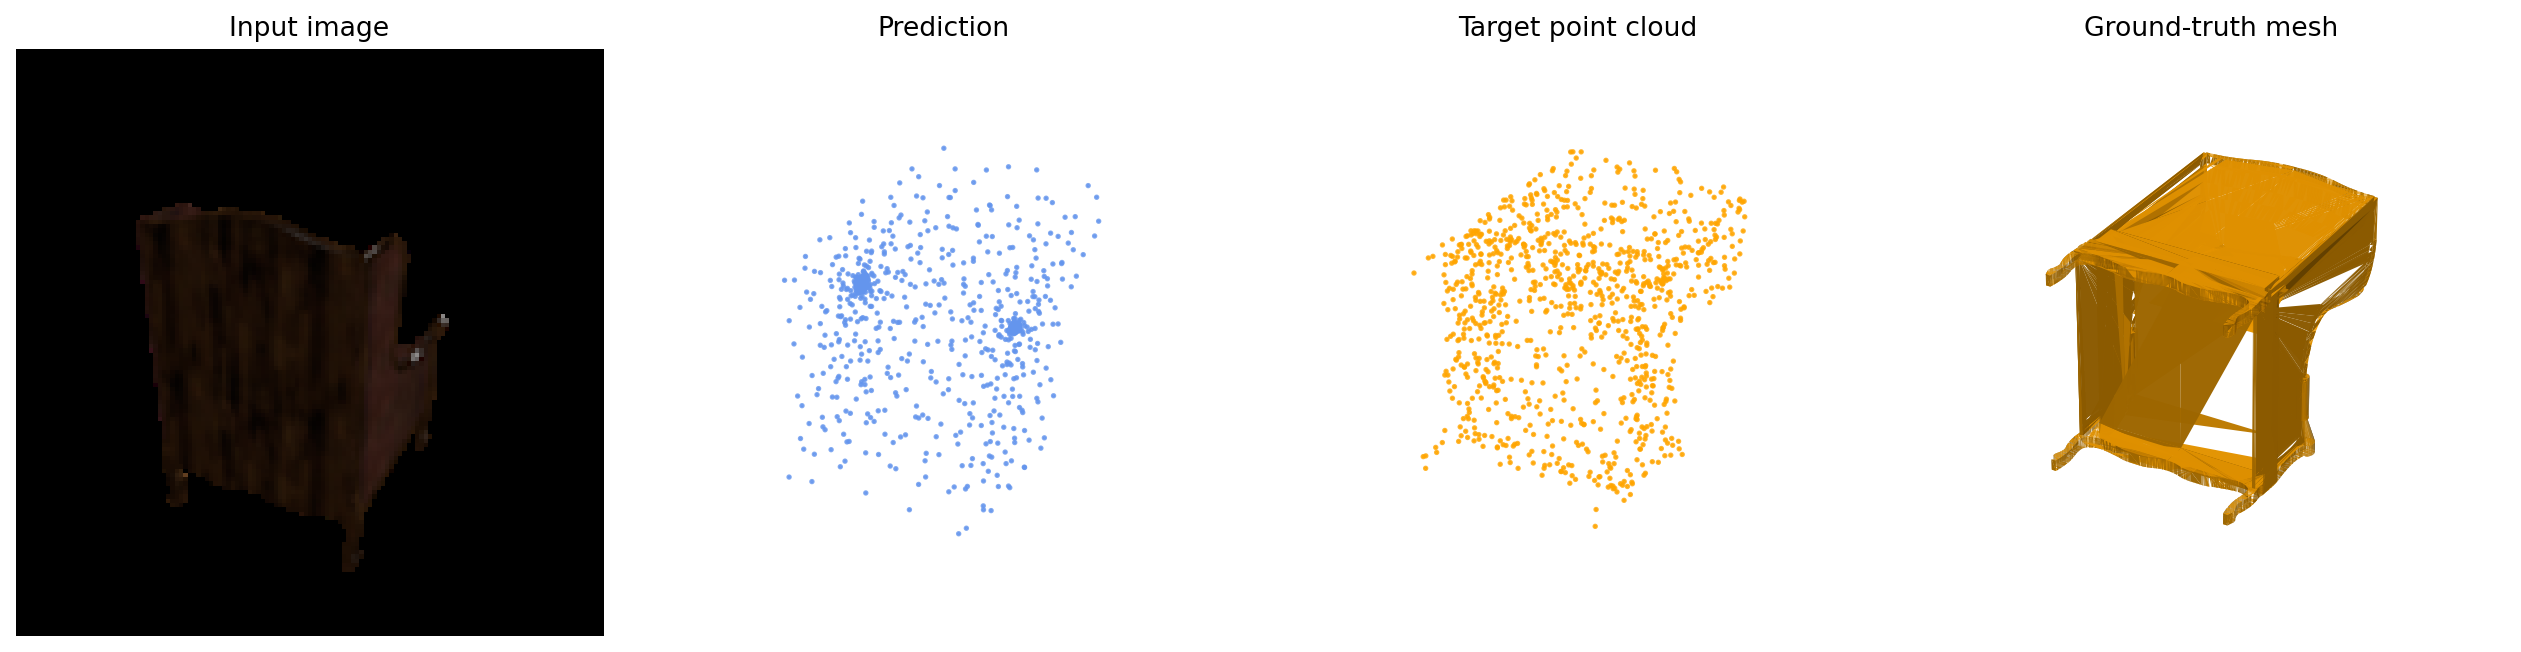
The point-cloud model has the highest F1, followed by mesh and voxel. Chamfer supervision directly aligns sampled surface points, while the voxel model represents shape on a finite grid and must convert its predicted occupancy to a surface for evaluation. That grid can lose fine detail and occasionally fail to produce a surface at the 0.5 threshold. The mesh decoder has a fixed template topology and smoothness regularization, which can limit how well it captures detailed or unusual chair geometry. These are plausible explanations for this run's ranking, not universal claims about the representations.

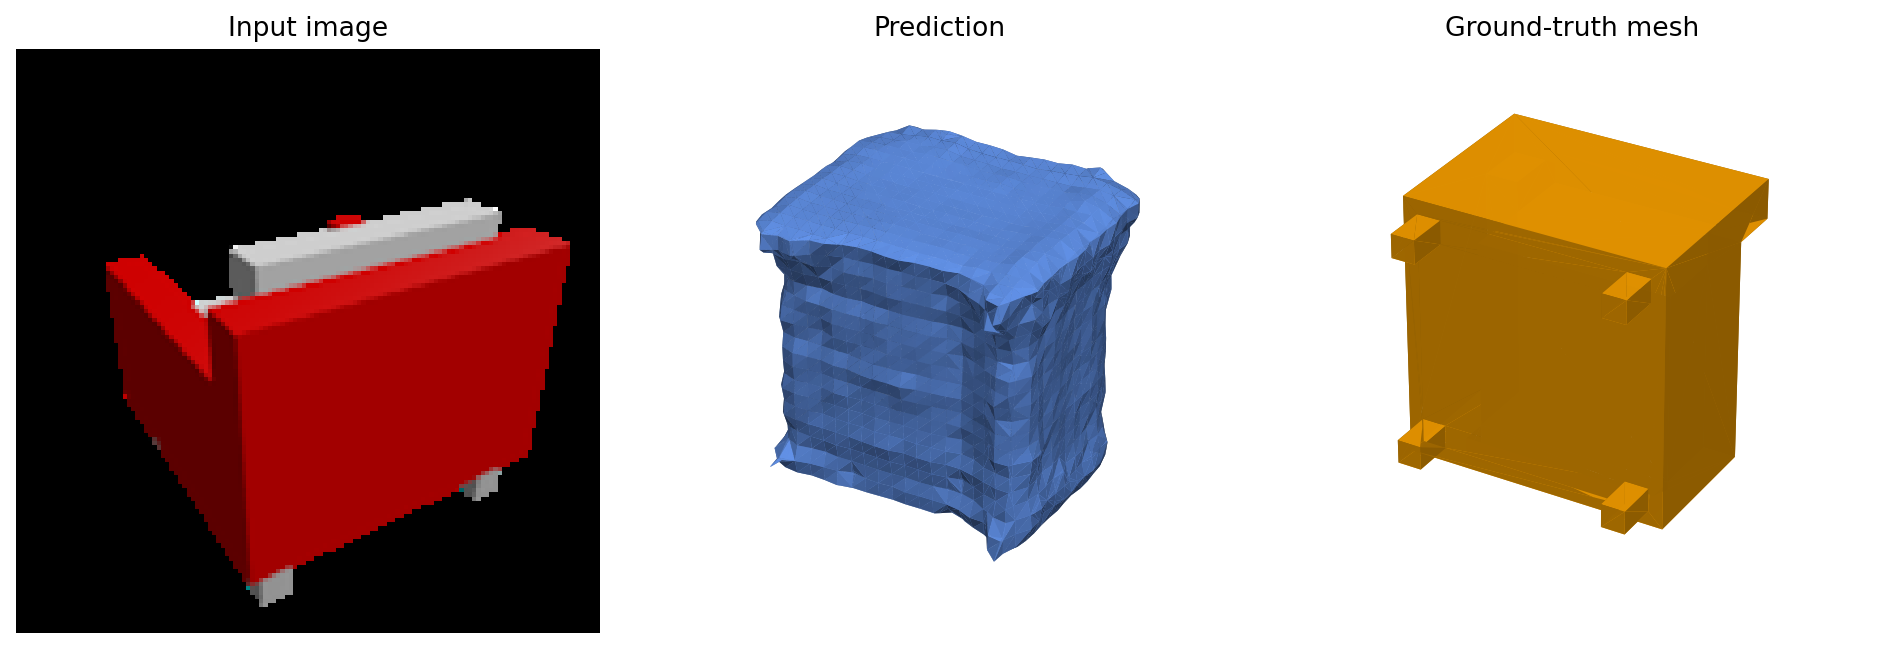
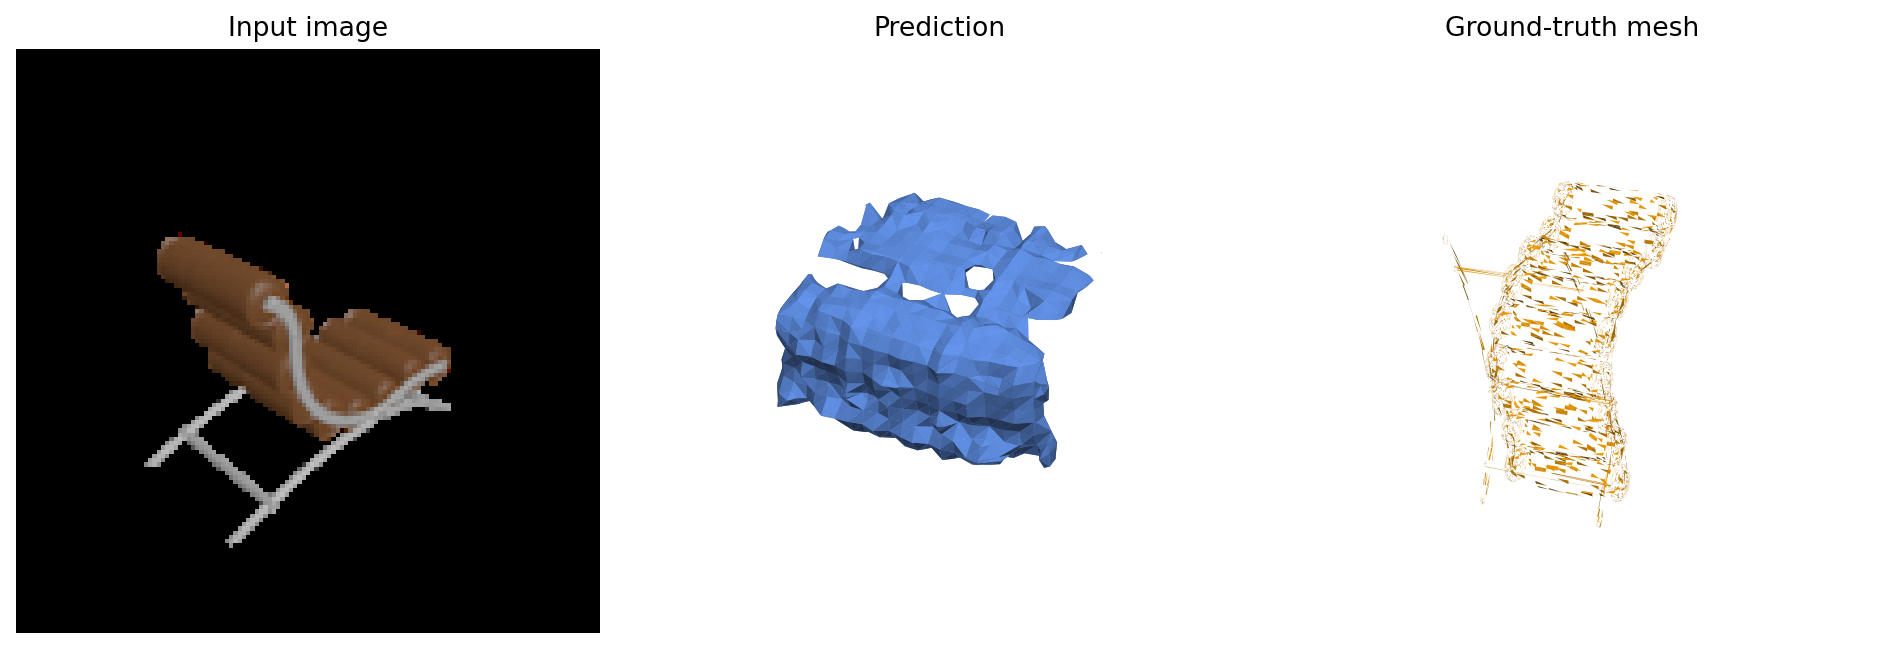
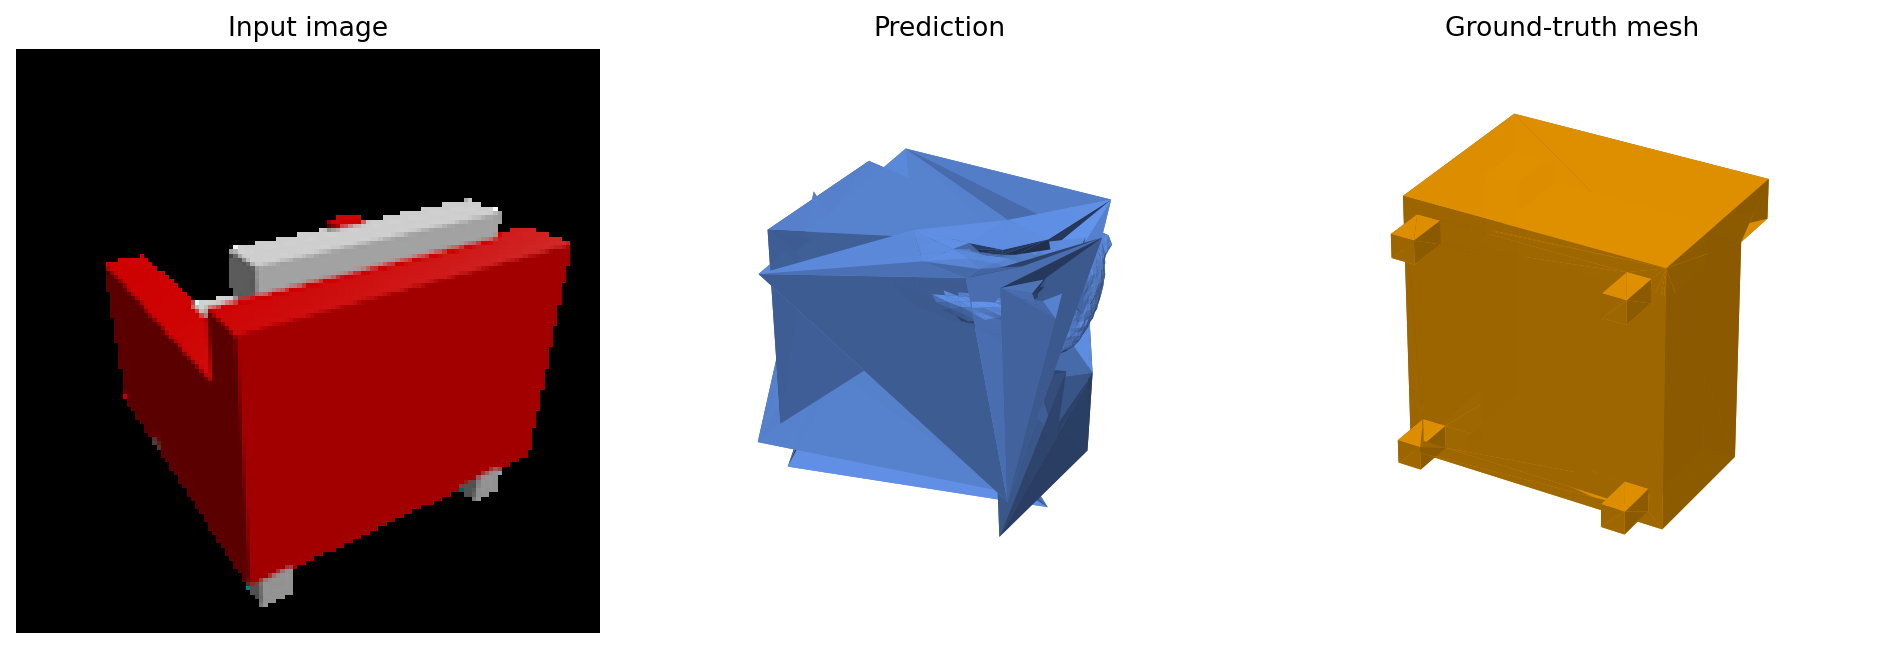
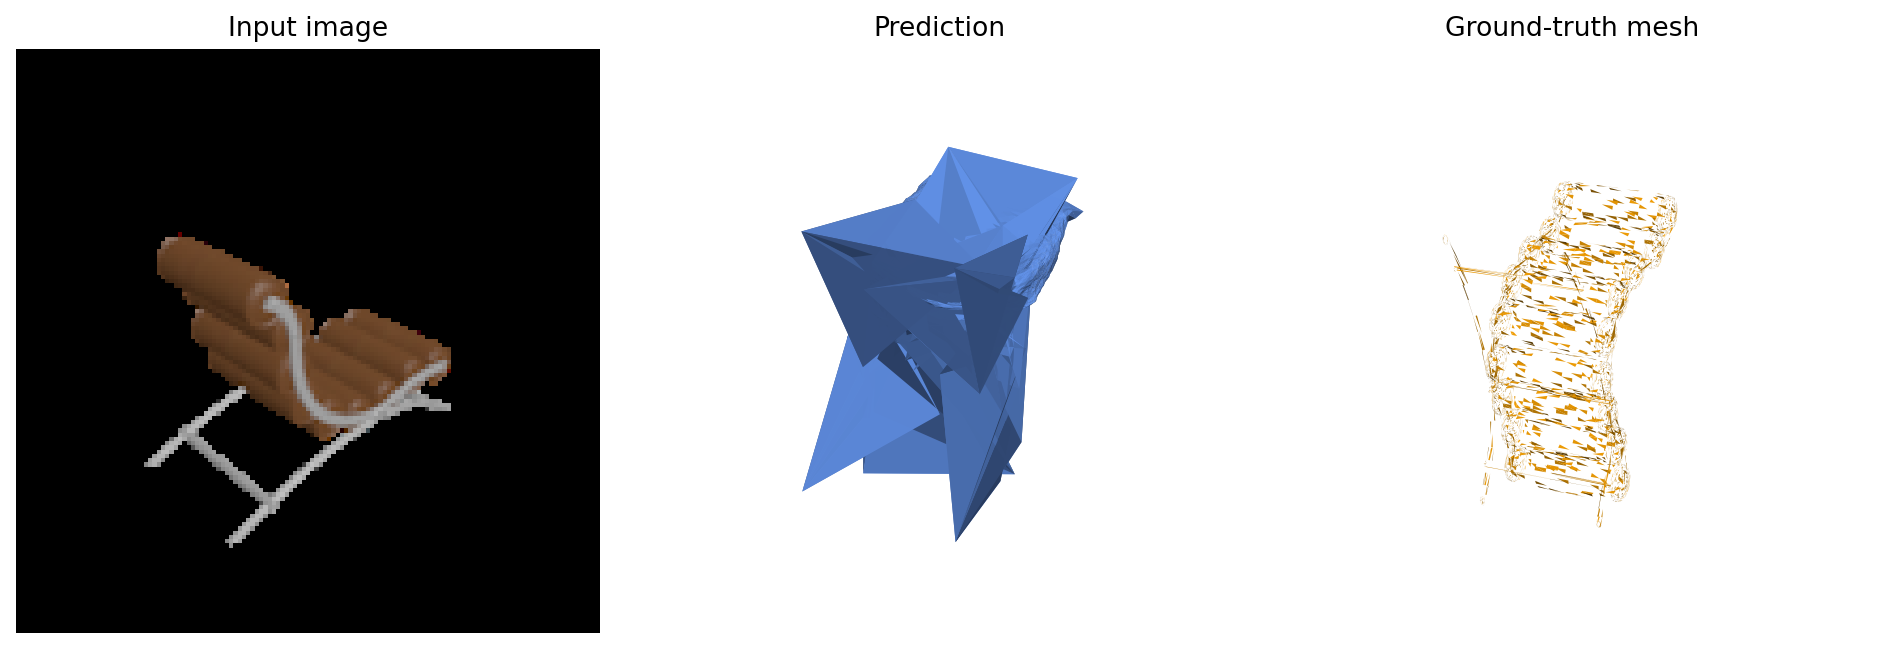
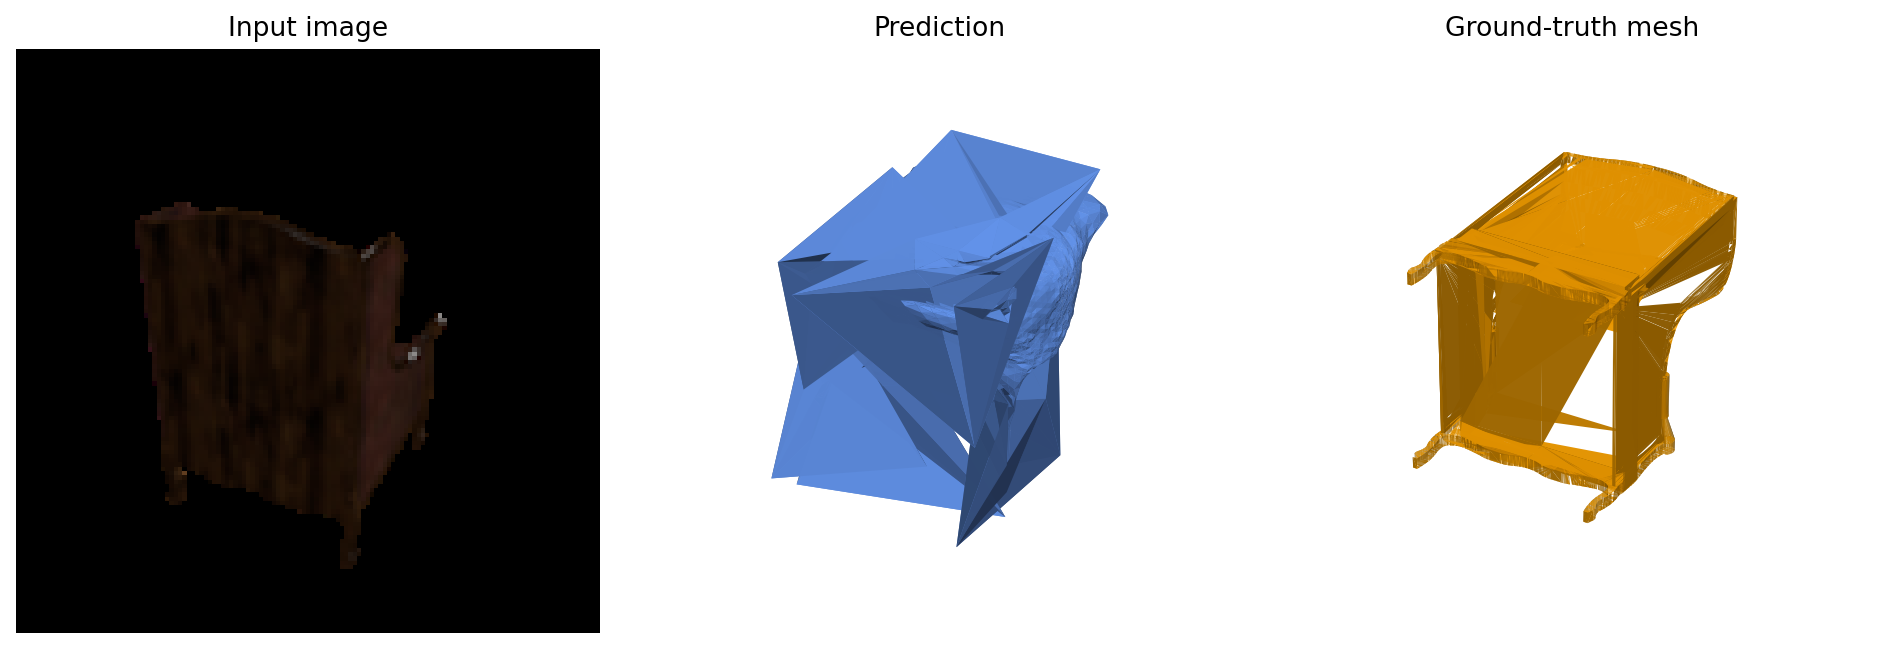
Test examples
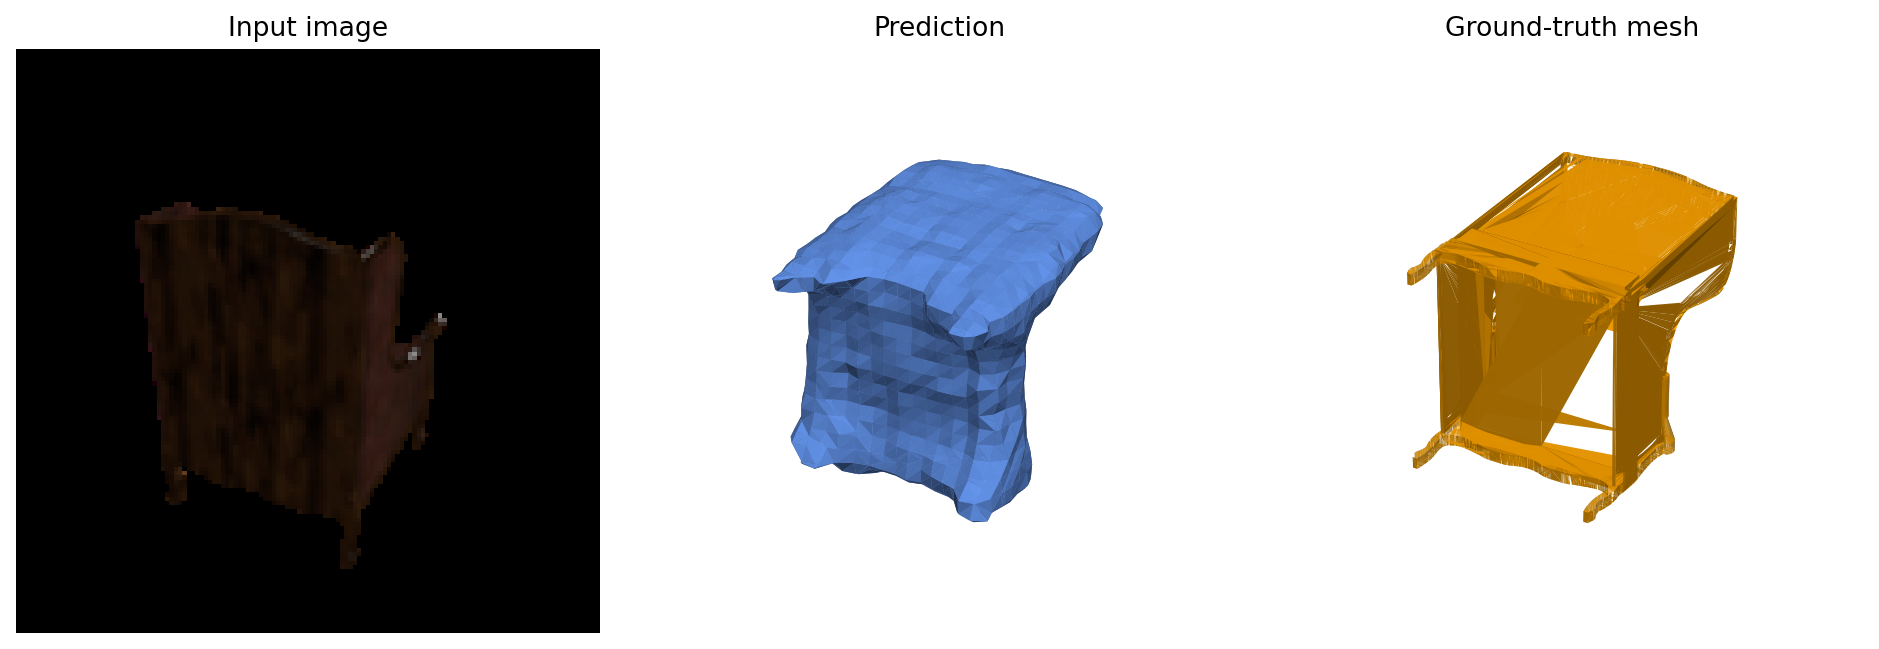
Each panel shows the input image, the model prediction, and its ground-truth mesh (the point-cloud panel also shows target points).
Voxel
Point cloud
Mesh
Q2.4 · Effect of mesh smoothness
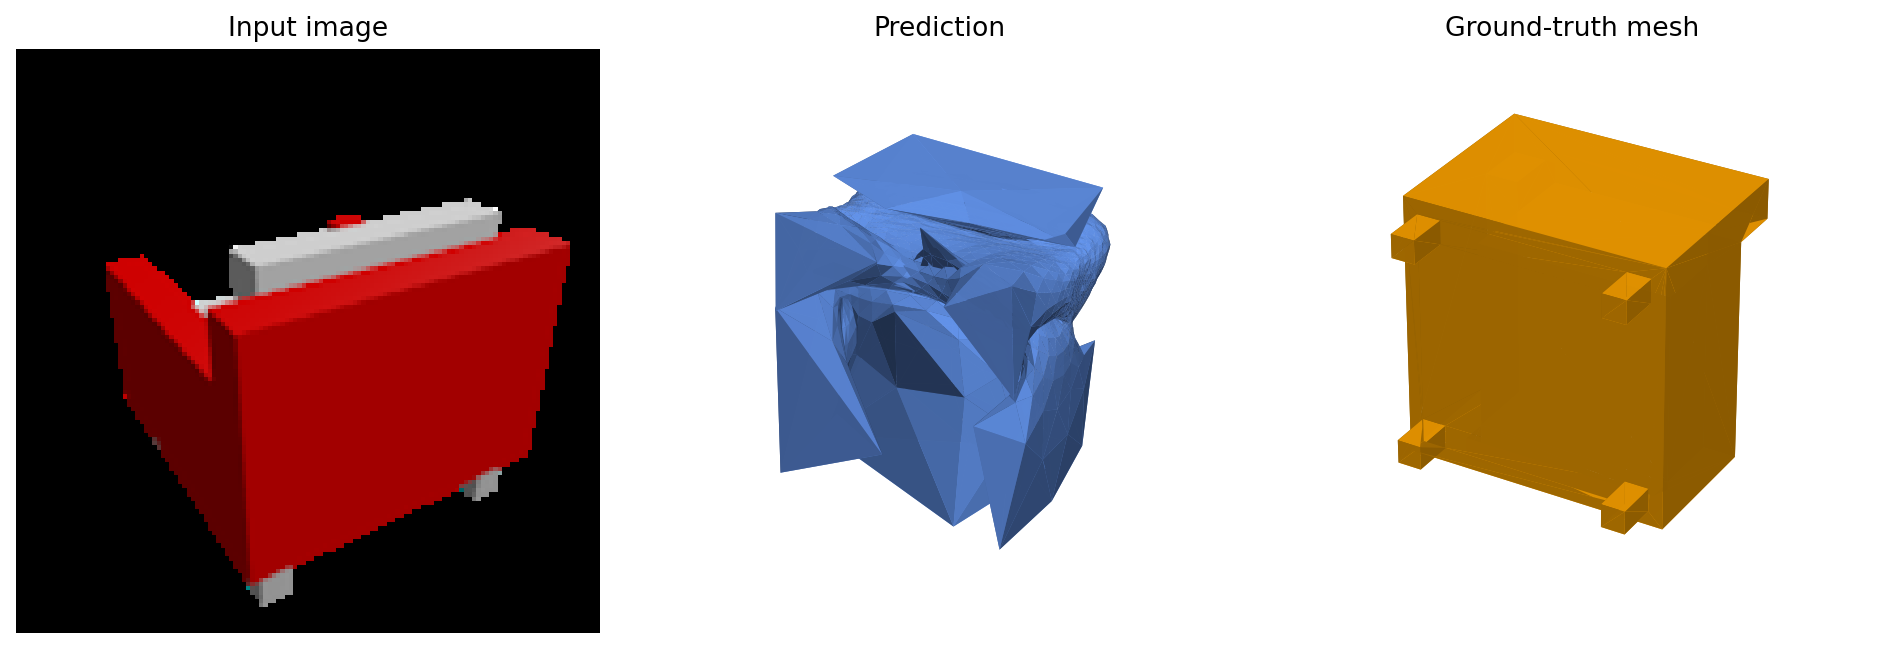
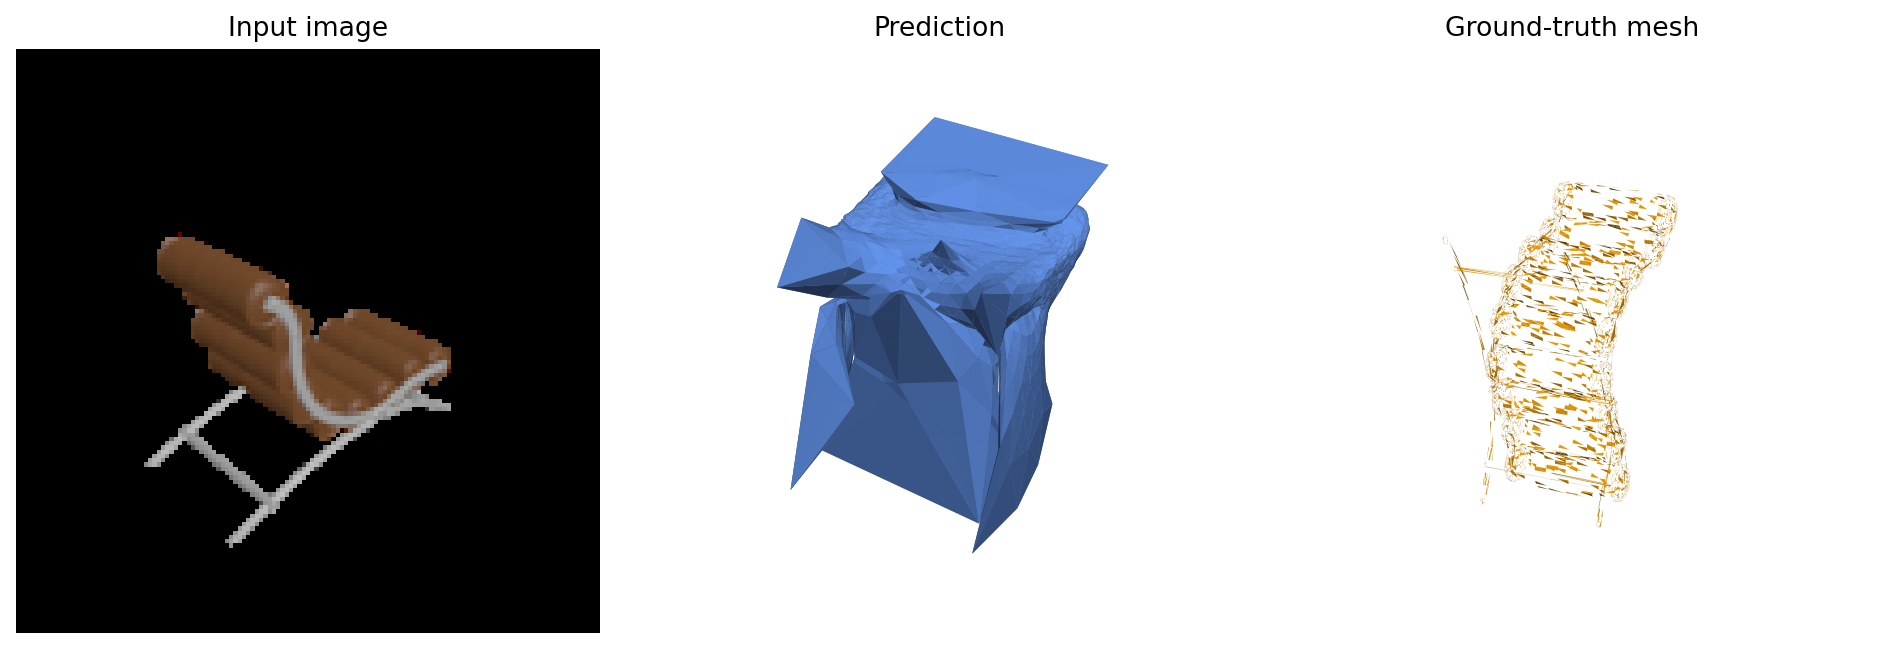
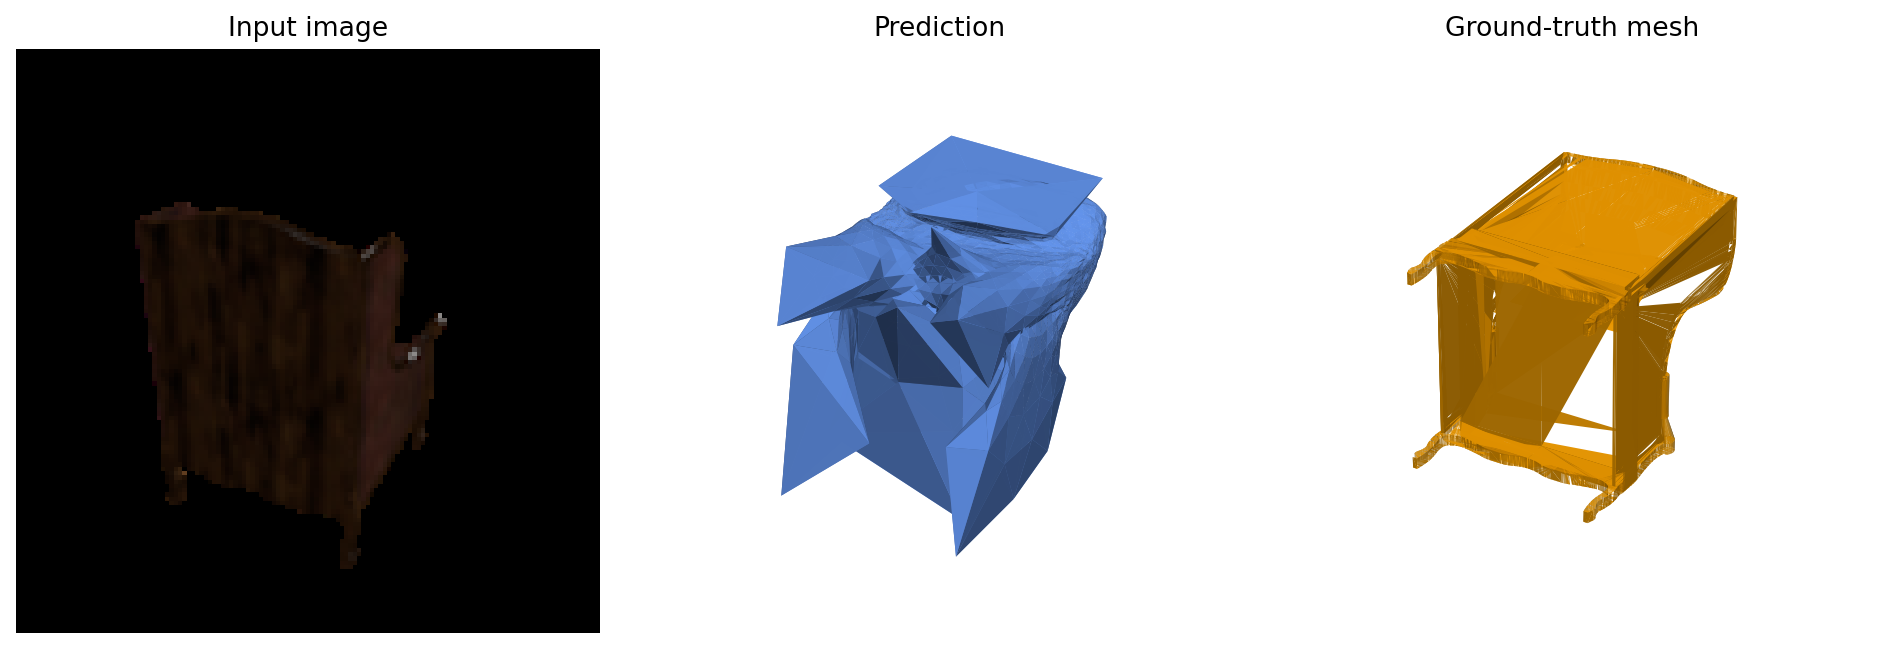
We compare the same mesh model trained for 11,000 updates with smoothness weights 0.1 and 0.5. Increasing the weight reduces F1 from 72.515 to 70.582 (−1.933 points). This is consistent with a regularization tradeoff: stronger smoothness can suppress detail as it penalizes local surface variation. The saved examples remain visibly imperfect for both settings, so the score change is clearer than the visual smoothness difference in these three cases.

Q2.5 · Input-occlusion sensitivity
We occlude each cell of a 4×4 image grid and measure the mean absolute change in predicted voxel occupancy. The heatmap highlights image patches whose removal changes the prediction most. This is a sensitivity visualization: it indicates which image regions affect the output, but does not establish that a region is causally or semantically important.

Q3.3 · Training on one class versus three
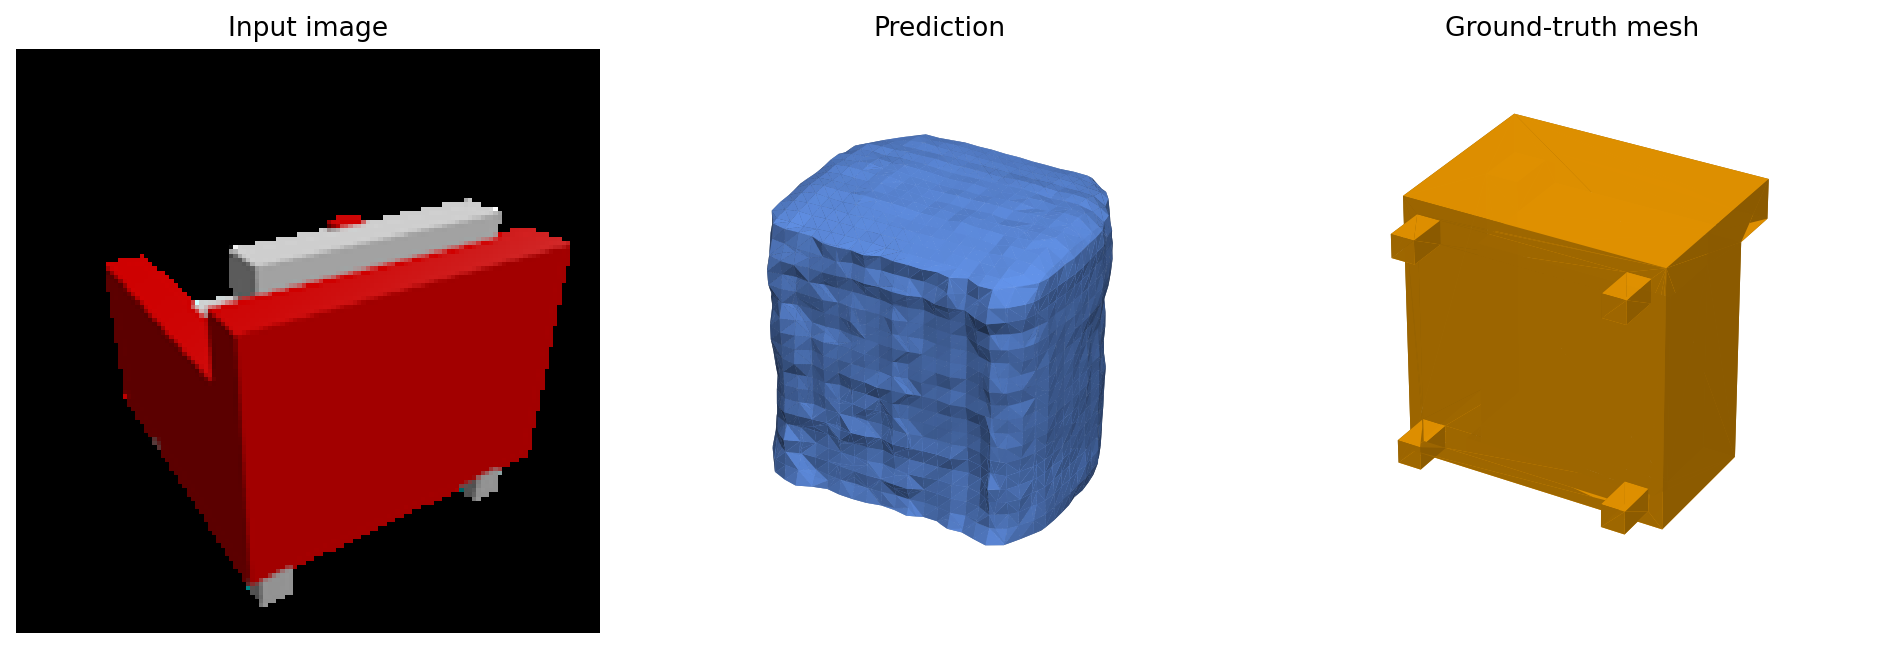
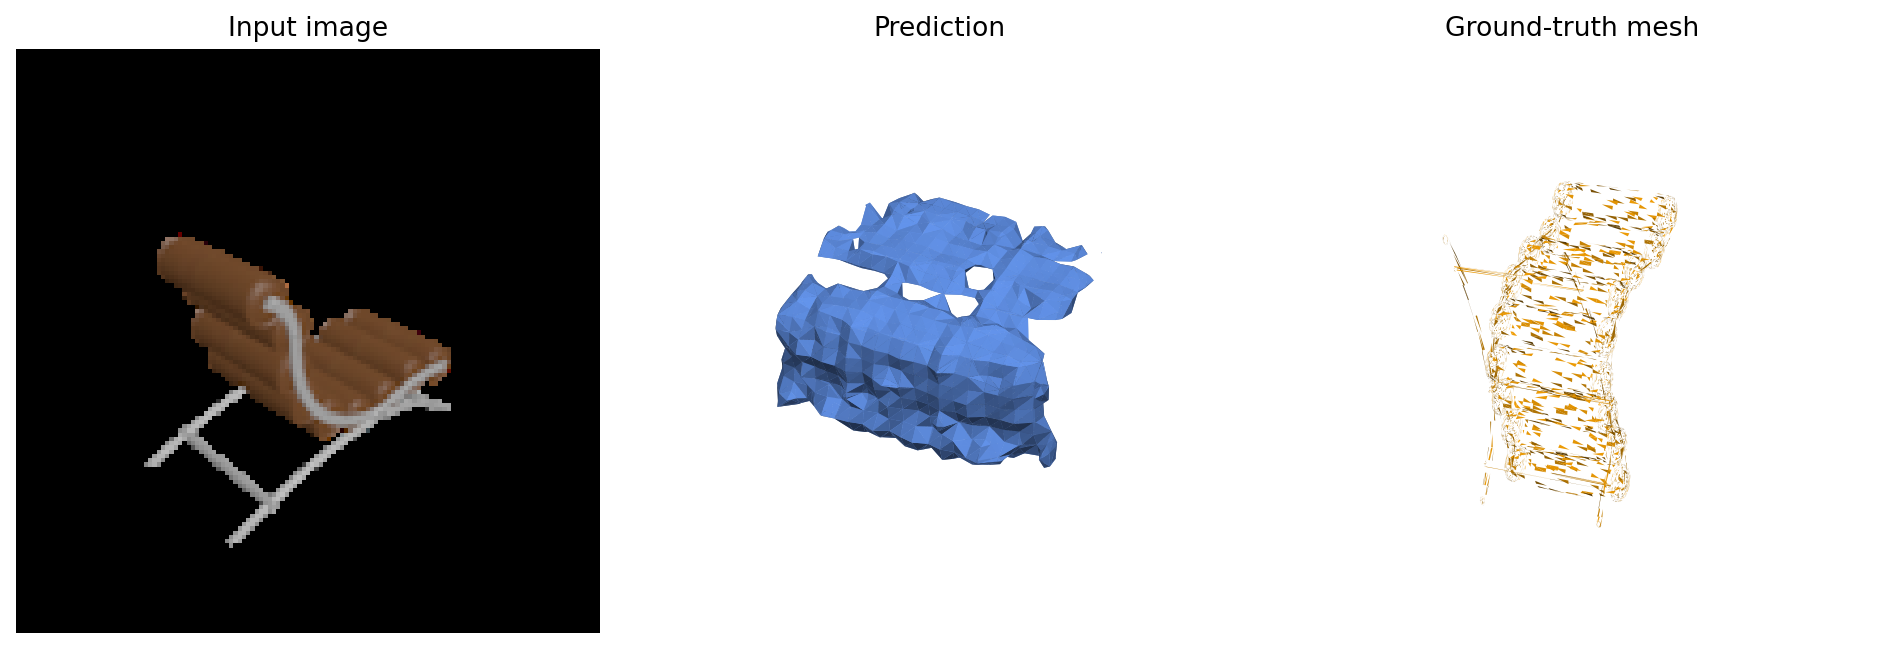
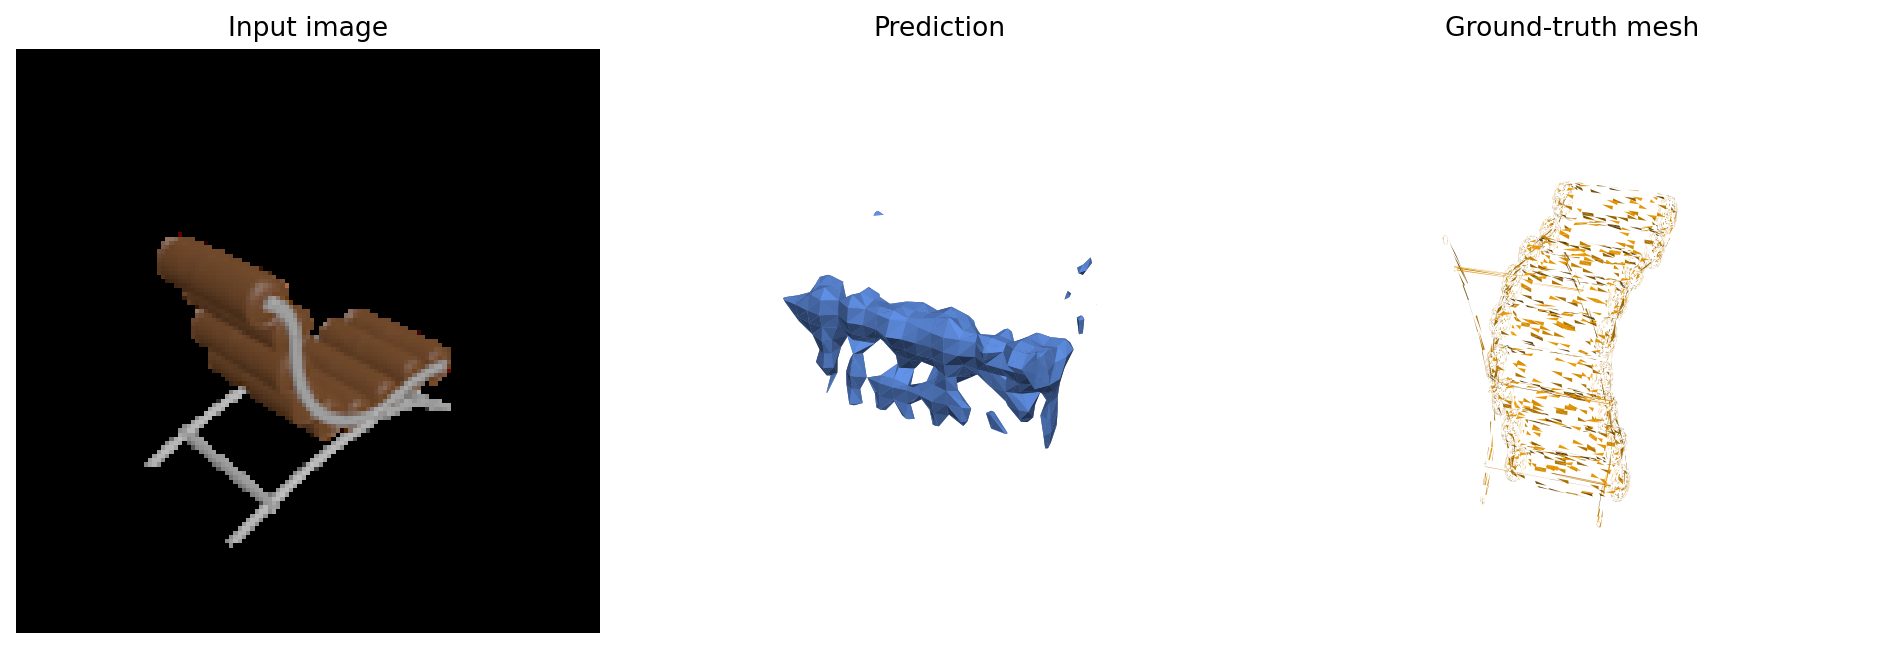
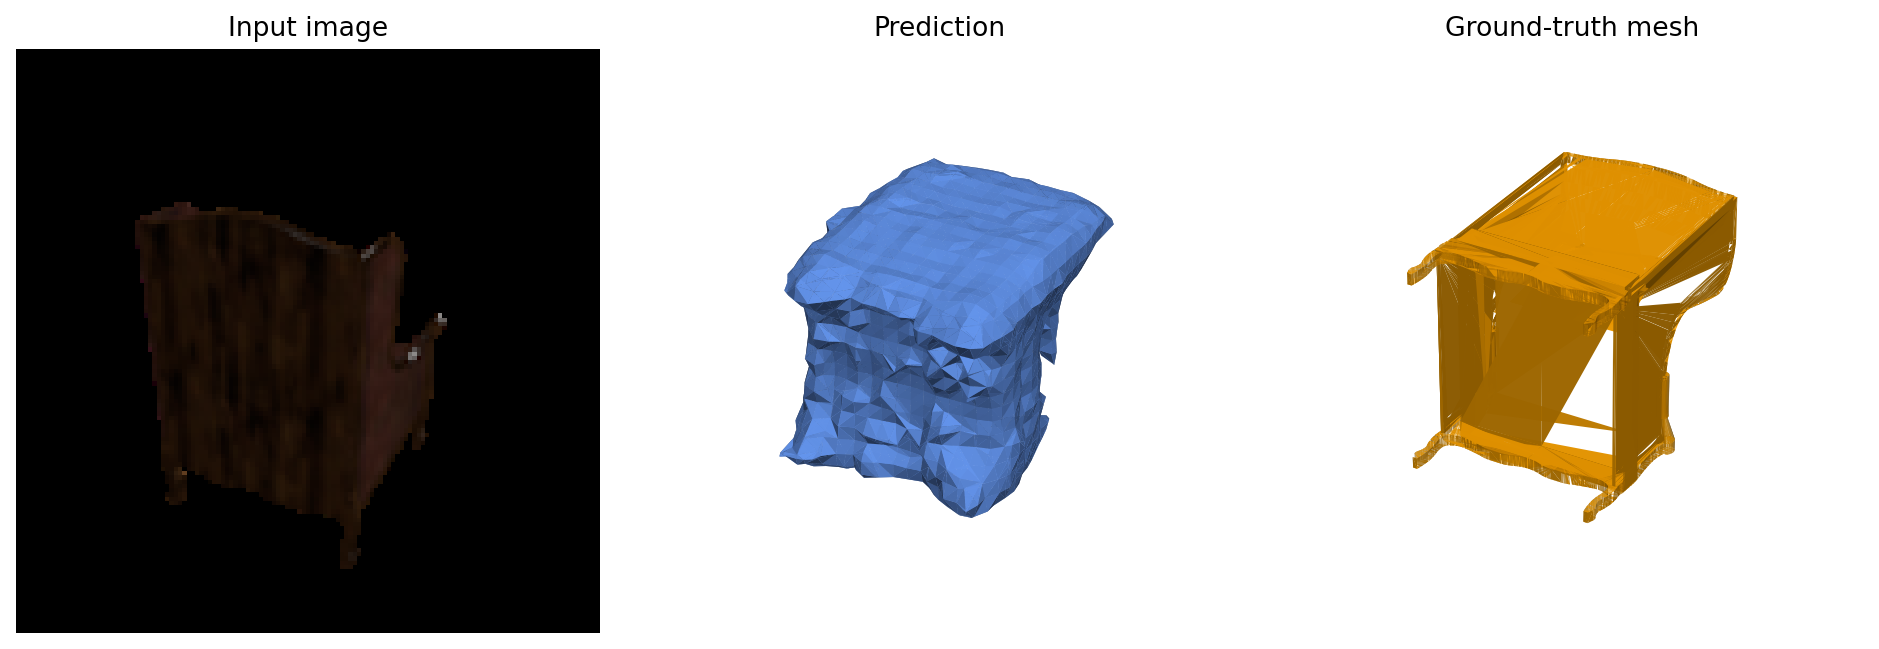
We compare voxel models trained on chairs only and on chairs, cars, and airplanes. Evaluation uses the same 678 chair test IDs and fixed input view 0. The two models both produced surfaces for 661 of the same shapes; the comparison below uses only that paired valid set.
| Model | F1@0.05 on paired set | Scored / 678 | Empty-surface skips |
|---|---|---|---|
| One class (chairs) | 64.854 | 677 | 1 |
| Three classes | 57.026 | 662 | 16 |
On the 661 shared valid shapes, three-class training is 7.828 F1 points lower (paired 95% CI for three-class minus one-class: [−9.546, −6.110]); three-class training scores higher on 256 of the 661 shapes. In these runs, adding classes did not improve chair reconstruction and instead reduced the paired mean. The broader data distribution may make chair reconstruction harder at a fixed training budget, but this experiment does not isolate the cause. Skips are reported separately because the models did not produce evaluable surfaces for every test shape.

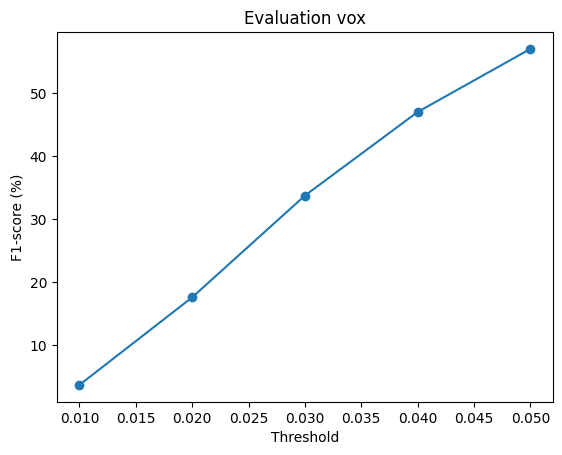
The curve captions show each run's mean over its own valid predictions; the paired numbers above are the fair same-shape comparison.
Matched chair examples
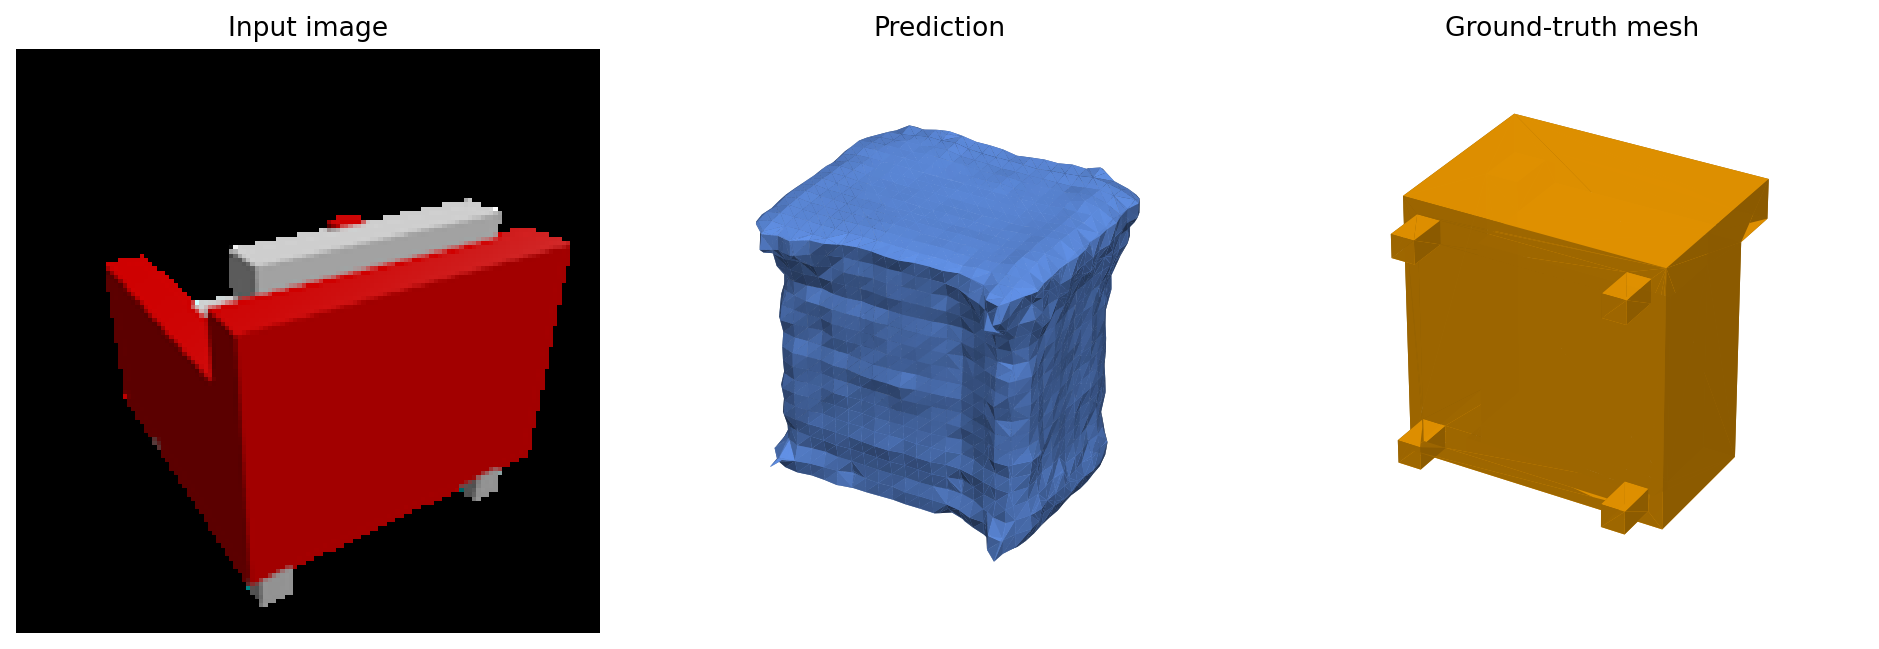
Rows in the two sets use the same chair IDs and input views.
Notes and limitations
- All final Q2/Q2.4/Q3.3 training runs reached 11,000 updates, continuing from 5,000-update checkpoints. This is the chosen budget, not a claim of full convergence.
- Q2 and Q3.3 quantitative results are reported from the fixed-view evaluation outputs. The earlier 5,000-update Q3.3 comparison used random input views and is not used here.
- One voxel Q2 sample and 16 three-class Q3.3 samples had no extracted surface at occupancy 0.5. They are listed as skips rather than assigned an undefined F1.
- The three visual examples are a small qualitative sample; quantitative F1 is computed over the test split.
Download summary data: Q2 voxelQ2 pointQ2 meshQ2.4Q3.3 paired comparison.