16-825 · Learning for 3D Vision
Assignment 2: Single View to 3D
Question 1.1
Fitting a voxel grid


Question 1.2
Fitting a point cloud


Question 1.3
Fitting a mesh


Question 2.1
Image to voxel grid
All the models in Question 2 and 3 were trained with the --load_feat argument, using the provided pretrained ResNet18 features.


F1@0.05: 63.0

Question 2.2
Image to point cloud


F1@0.05: 75.2

Question 2.3
Image to mesh


F1@0.05: 69.3

Comparison of voxels, point clouds and meshes
| Voxel grid | Point cloud | Mesh | |
|---|---|---|---|
| F1@0.05 | 63.0 | 75.2 | 69.3 |
The point cloud gets the highest F1 score, followed by the mesh and then the voxel grid. The point decoder can place each of its 1000 points anywhere, and the chamfer loss it is trained with measures almost the same thing as the F1 score, which is how far each point is from the closest point on the other surface.
The mesh decoder is trained with the same chamfer loss, but every vertex is tied to the ico sphere it starts from, and a sphere has no holes. The gaps between the back and the seat, or between the legs of a chair, can only be covered with long thin faces, so the points sampled on those faces end up in empty space and bring the score down.
The voxel grid is limited by its resolution. One voxel is 1/32 of the box, so a chair leg is only one or two voxels thick and a small error in the prediction removes it completely. The loss for voxels is also a per voxel classification loss, so it does not directly push the surface to the right place the way chamfer does.
The order changes at smaller thresholds. From the plots, at 0.02 the mesh is the highest at about 22 and the point cloud is the lowest at about 17. The point decoder puts a lot of its points in two clumps near the seat, so the rest of the surface is covered sparsely, and most of the surface is within 0.05 of a predicted point but not within 0.02.
Question 2.4
Effects of hyperparameter variations
Weight on occupied voxels in the voxel loss
With plain binary cross entropy, 393 of the 678 test predictions were completely empty and the F1@0.05 was 1.3. A chair fills only a few percent of the 32 x 32 x 32 grid, so predicting every voxel as empty already gives a low loss and the model settles there. Weighting the occupied voxels 3 times more than the empty ones (pos_weight = 3) brought the empty predictions down to 3 out of 678 and the F1@0.05 up to 63.0.

w_smooth for the mesh model
| w_smooth | 0 | 0.1 | 1 |
|---|---|---|---|
| F1@0.05 | 69.4 | 69.3 | 64.8 |


The F1 score is the same for 0 and 0.1, but the meshes look very different. Without the smoothness loss the surface is covered with long spikes and faces that cut through each other. These spikes do not hurt the F1 score much, since the sampled points still mostly land near the real surface. With 0.1 the same shapes come out as cleaner flat panels. At 1 the smoothness loss (around 0.02) becomes bigger than the chamfer loss (around 0.004), so the model shrinks and crumples the sphere to make the edges shorter, and the F1 score drops by 4.5. A small weight makes the mesh look better without costing accuracy, while a large weight costs accuracy.
Question 2.5
Interpreting the model
Interpolating between two image features
The 512 dimensional features of two test images are mixed as (1 - alpha) A + alpha B and each mix is decoded with the point and the mesh model. The output changes smoothly from the wide armchair to the narrow chair, the width shrinks steadily and the legs only show up from about alpha = 0.6. So the decoder has learnt a continuous space of shapes rather than memorising the training chairs, and having separate legs behaves almost like a switch in that space. All the point clouds also have two dense clumps near the seat, the decoder puts a lot of points where it is most sure and leaves fewer for the legs and the back.


Where the point model makes errors
The predicted points are coloured by their distance to the closest ground truth point (left), and the ground truth points are coloured by their distance to the closest predicted point (right), from blue at 0 to red at 0.1 or more. In both cases the red is on the top edge of the backrest, the outer edges of the arms and the bottom of the legs. For the tub chair in the second row, 38% of the ground truth surface is more than 0.05 away from any predicted point, most of it on the curved back and the bottom rim.



To check this over the test set, the ground truth points of every 5th test chair are grouped by height, from 0 at the floor to 1 at the top of the chair, and for each group the fraction of points more than 0.05 away from any prediction is measured. It is 46% at the bottom and 47% at the top, but only 17% around the seat. Most of the lost F1 score comes from the leg tips and the top of the backrest, which are thin and change the most from chair to chair.

Effect of the viewpoint
For 40 test chairs, all 10 test views are passed through the point model and the F1 score is grouped by the camera azimuth. The average goes from 71.3 for views between 60 and 90 degrees up to 80.1 for views between 300 and 330 degrees. For a single chair, the F1 score of its best and worst view differ by 16.7 on average, so the reconstruction depends a lot on which view the model gets.

Question 3.1
Implicit network
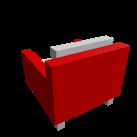
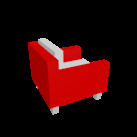
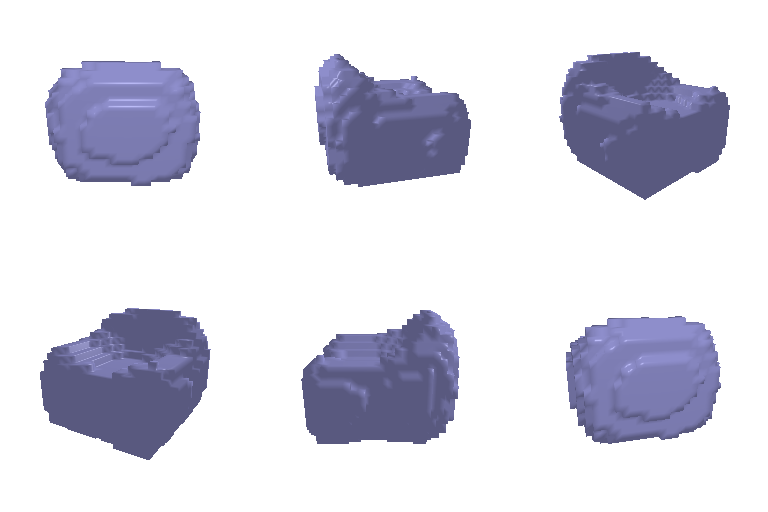
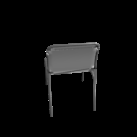
The decoder takes the image feature together with a 3D point and outputs the occupancy of that point. It is queried at all the points of a 32 x 32 x 32 grid in (-1, 1)3, so the output has the same shape as the voxel grid in Question 2.1 and is trained and evaluated in the same way.






F1@0.05: 51.5
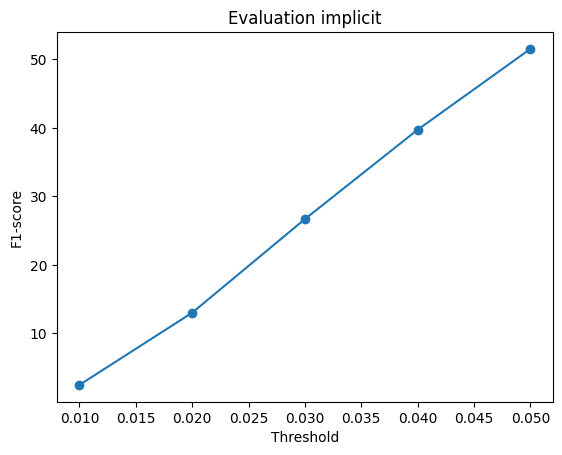
The implicit model is lower than the voxel decoder (63.0) even though both get the same supervision. The shapes have the right overall size and lean, but they come out as smooth blobs and the thin parts like legs are lost. An MLP that takes the raw x, y, z coordinates learns smooth, low frequency functions first, so a leg that is one voxel thick is hard for it to represent, while the convolutional decoder works with local filters over the grid.
Question 3.2
Parametric network
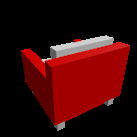
The decoder has 4 patches. Each patch is an MLP that takes a 2D point sampled from the unit square together with the image feature and outputs a 3D point. 250 new 2D points are sampled per patch in every forward pass, which gives 1000 points in total.


F1@0.05: 64.3
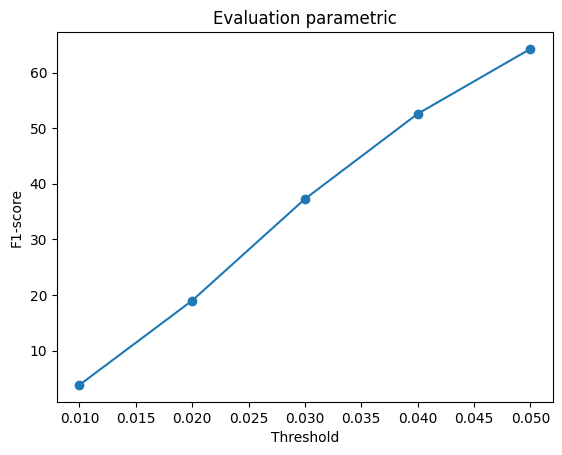
The parametric model is 10.9 lower than the point decoder in Question 2.2 (75.2). Since the 2D points are sampled again in every iteration, each patch has to learn a continuous mapping of the whole square instead of 250 fixed points, which is a harder thing to fit. In the renders the points lie along a few stretched strips that cover the back and the seat but do not wrap around the legs well. The output is a set of continuous surfaces that can be sampled at any density, which the point decoder cannot do, but with 4 patches it costs some accuracy.
Question 3.3
Extended dataset for training
The point cloud model from Question 2.2 is trained again on the three class dataset (chair, plane and car) with the same settings. Both models are evaluated on the three class test set, and the 678 chairs in it are the same test chairs as in Question 2.
| Trained on | Chair | Plane | Car | All |
|---|---|---|---|---|
| Chair only | 75.7 | 49.7 | 68.5 | 66.6 |
| Chair, plane and car | 74.0 | 95.1 | 91.5 | 84.3 |


On the same test chairs, the model trained on three classes is 1.7 lower than the one trained only on chairs (74.0 against 75.7). It was trained for the same number of iterations, but less than half of its training batches were chairs, and the decoder has to share its capacity between three very different classes.
On planes and cars, the chair only model turns every input into a tall chair shaped cloud. Planes are hit the hardest (49.7) since a plane is long and flat, the shape that is least like a chair, while cars still get 68.5 because the boxy body of a car overlaps with the volume of a chair. The three class model gets 95.1 on planes and 91.5 on cars, higher than either model gets on chairs, because planes and cars look much more alike within their class than chairs do.
For consistency and diversity, the three class model first picks the class (flat wings, a low wide box or a chair) and then changes the shape within it. Its chair predictions look like the ones from the chair only model, with the same two clumps and sparse legs, so training on more classes did not make the chairs more consistent, it only extended the same behaviour to two easier classes.