Q1: Classification Model
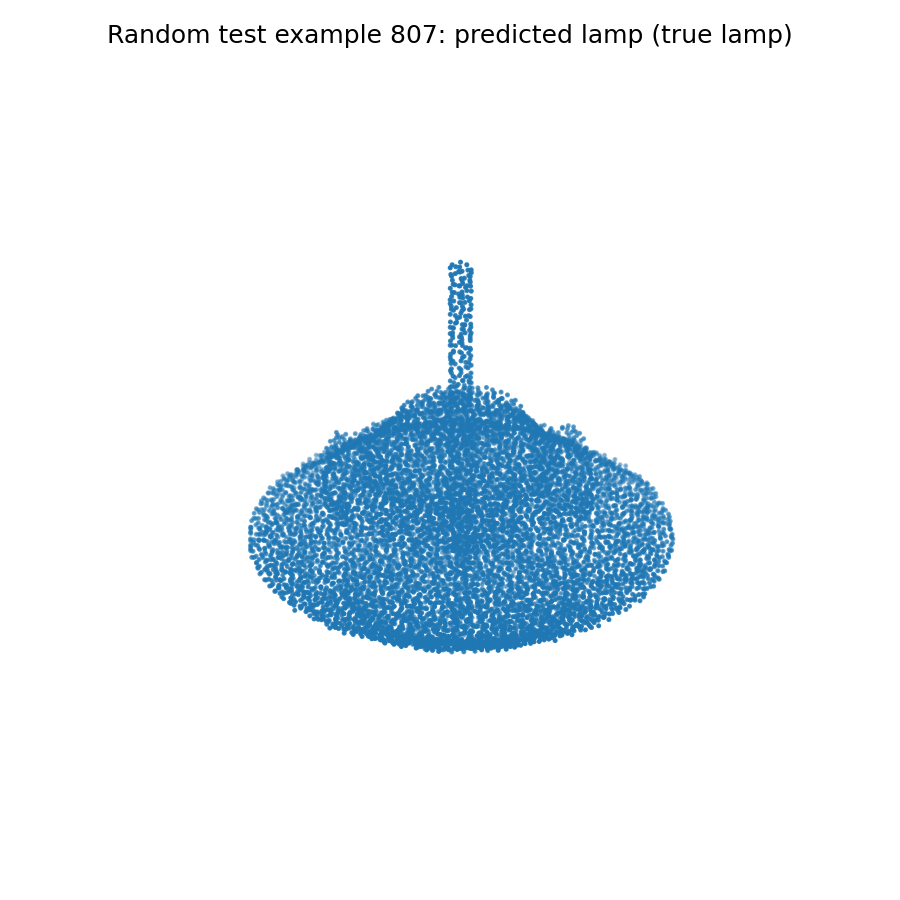
Test accuracy: 0.963
Prediction Visualizations
Failures
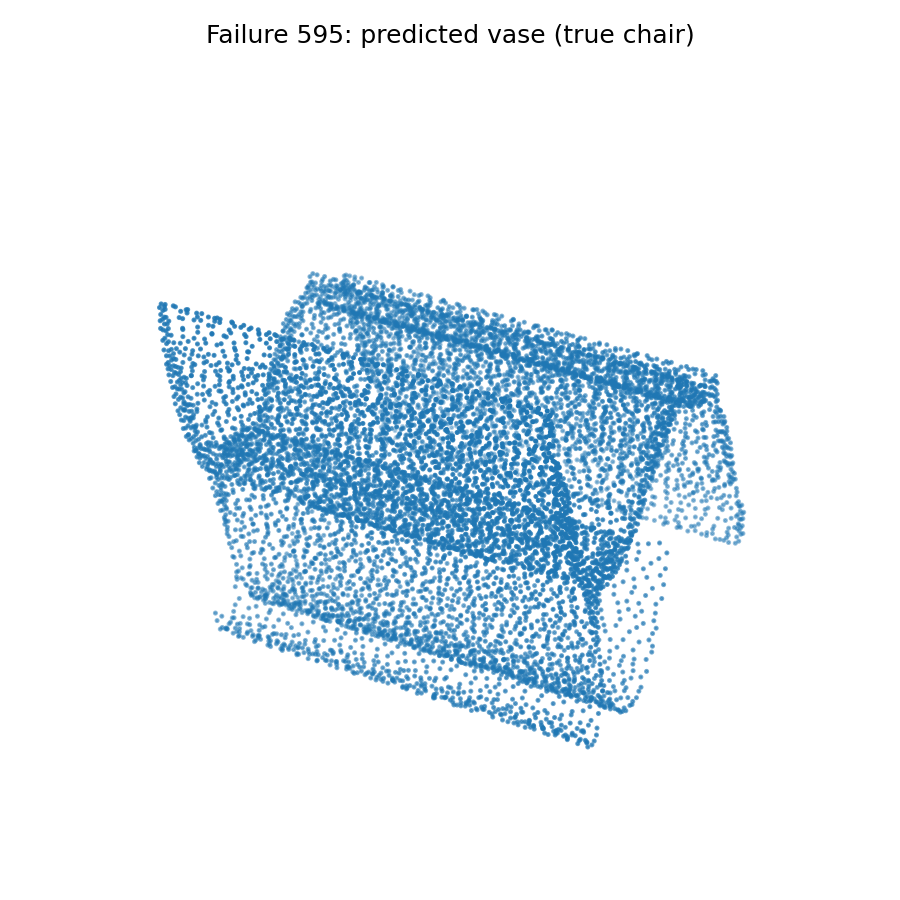
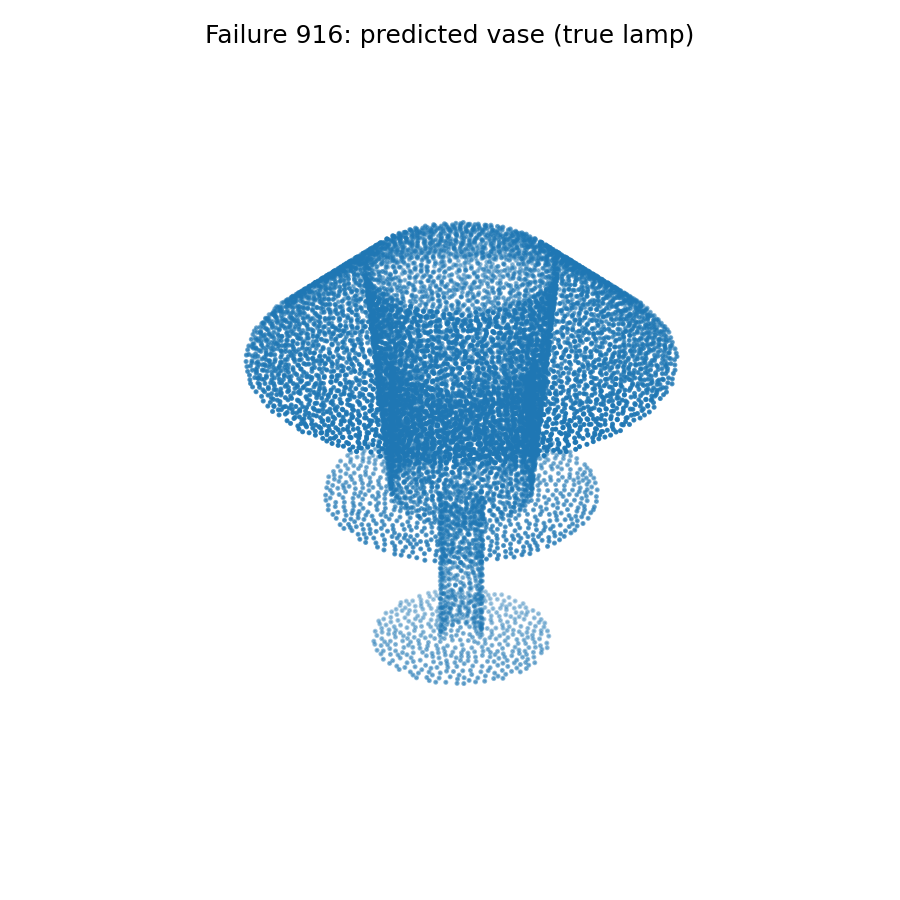

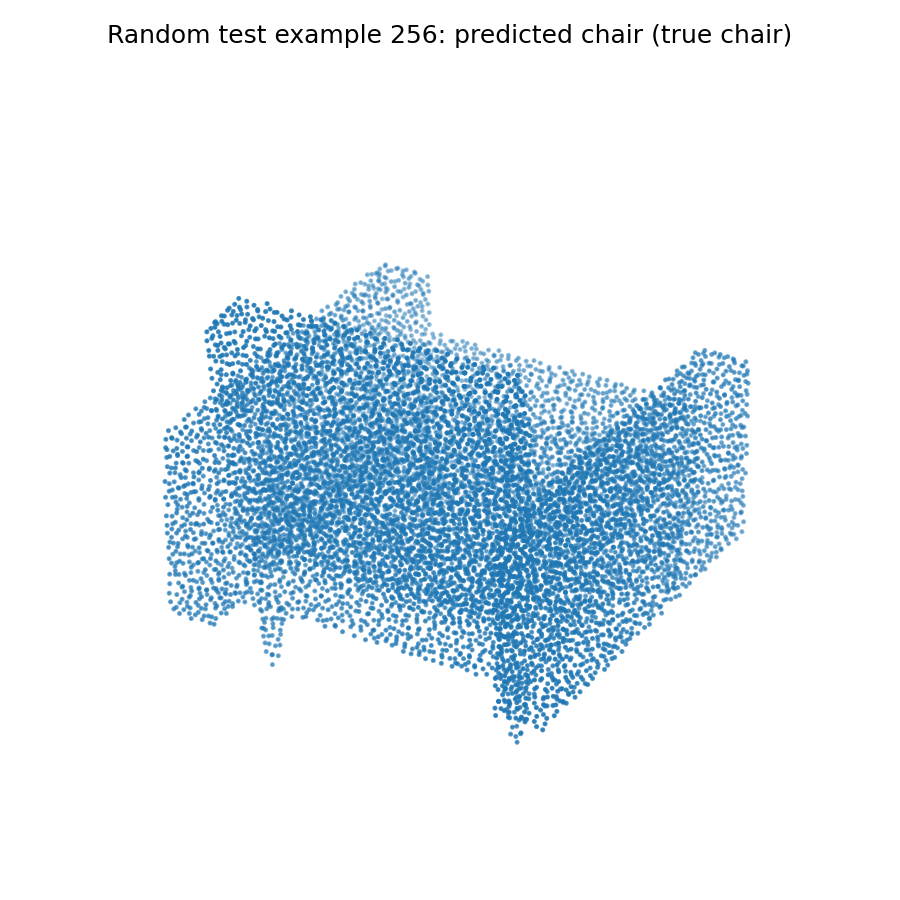
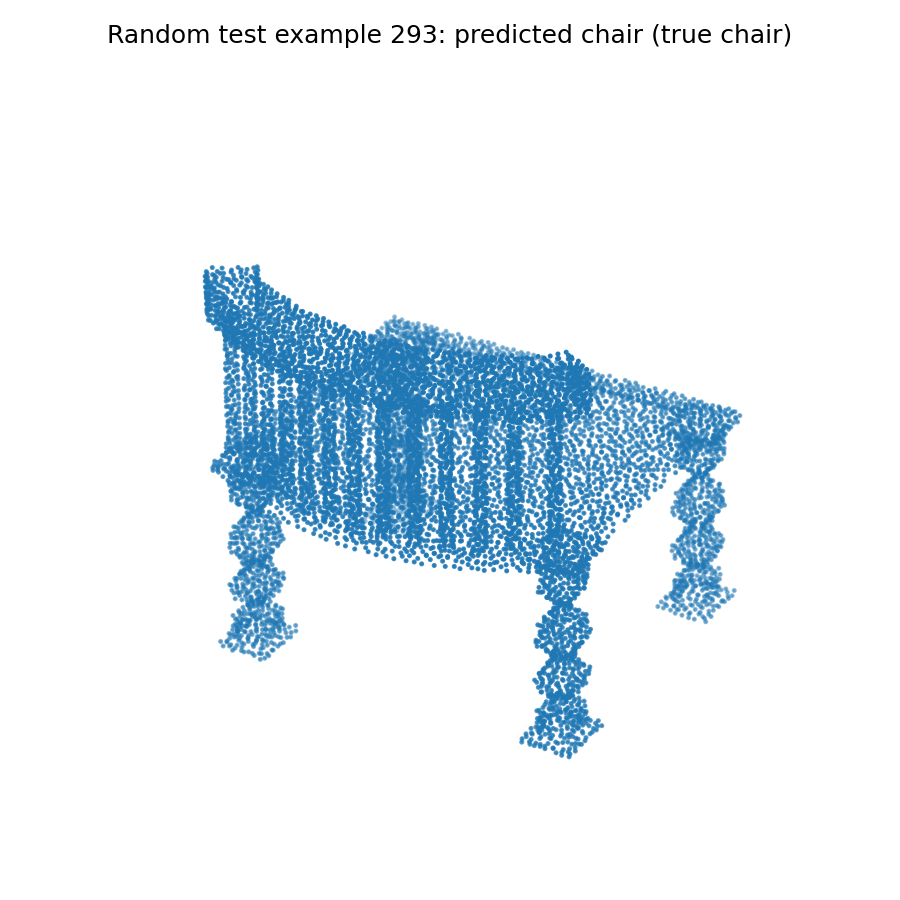
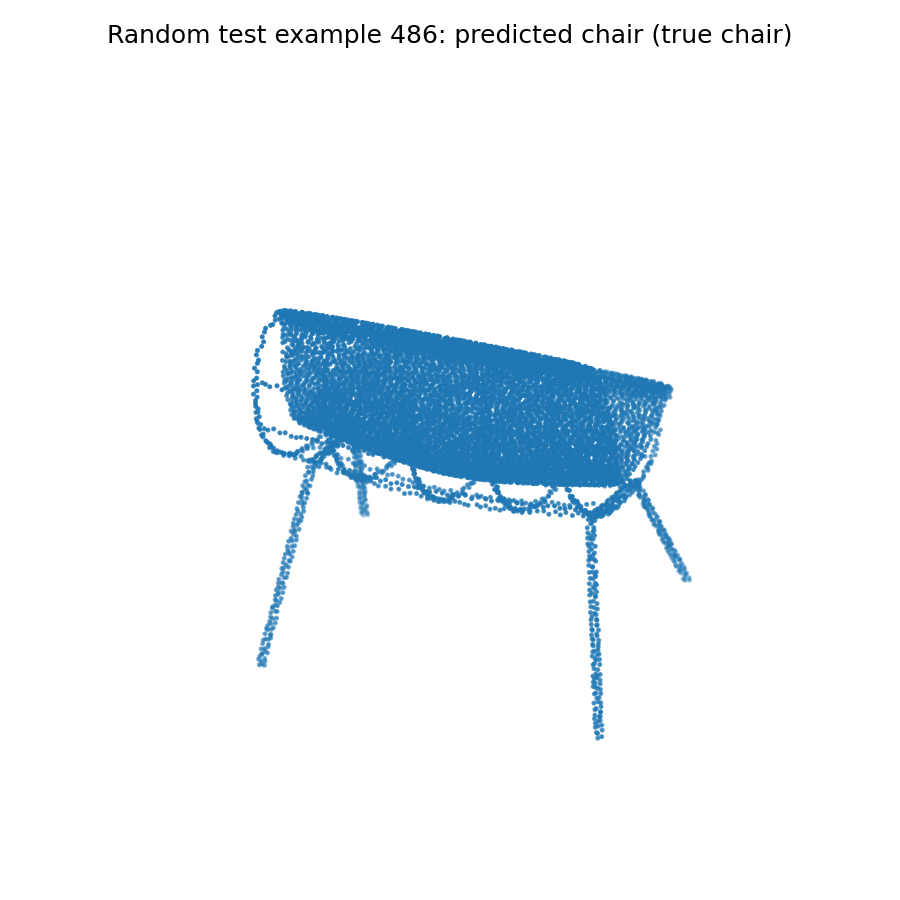
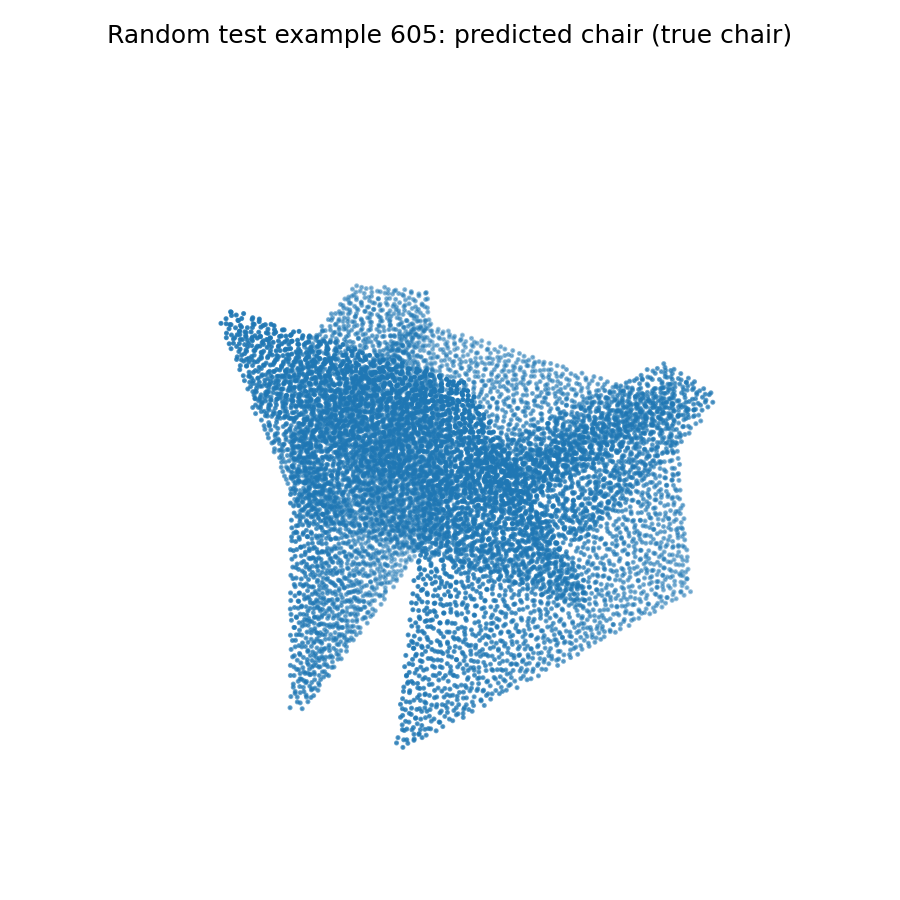
This model featured a simple three-layer linear architecture with a hidden dimension of 128. It ran for 250 epochs at the default learning rate. While most predictions were accurate, some of the failure cases exhibited here struggled likely because of their unconventional shapes. The chair, for example, has a curved shape with no large flat surfaces which is somewhat reminiscent of a vase. With the others, the lamps and vases have very similar structures, so these failures feature lamps that have a cylindrical vase-like structure and vases with open lamp-like bowls.
Q2: Segmentation
Test accuracy: 0.802
Results


Prediction Accuracy: 0.8920


Prediction Accuracy: 0.8622


Prediction Accuracy: 0.8027


Prediction Accuracy: 0.6172


Prediction Accuracy: 0.6941
The predictions were mostly accurate but struggled with distnguishing the boundaries of each part of the chairs. Especially in the case of the seat of the chairs, the model had trouble distinguishing where the seats ended, while other parts (back, legs) did not have as much of this issue. Notably, in the last two cases which had a much higher proportion of failure, the unconventional geometry tripped up the model; the protrusion of the seat on the sides of the second-to-last example made the model believe that they were part of the armrests, and in the last example, it had a hard time distinguishing what part of the smooth curve was armrest vs seat, which might be confusing even for a human. The lack of local feature analysis makes it harder for the model to distinguish relative features for each point to determine which class they might belong to.
Q3: Robustness Analysis
Exploration 1: Input Point Cloud Rotation
Classification
Test accuracy: 0.226
Prediction Visualizations (Original Set)


More Failures


As expected, the test accuracy dropped significantly when trained with upright models and tested on rotated ones. In this approach, I applied a 135-degree rotation around the Z axis for each input point cloud for evaluation only. The accuracy turned out to be worse than random guessing (which might have hovered more around 0.333), as the model frequently confused features across classes. Of the original randomly selected set of correct predictions, 4/5 of them failed under rotation. Lamps were a common prediction as many lamps in the training set have wildly different geometries, some of which resemble upside-down chairs.
Segmentation
Test accuracy: 0.433
Results


Prediction Accuracy: 0.2357


Prediction Accuracy: 0.3369


Prediction Accuracy: 0.3487


Prediction Accuracy: 0.2885


Prediction Accuracy: 0.3767
Similarly to classification, this model suffered greatly from the rotation. While some parts remained accurate, like the seats of each chair, the ranges for each part varied wildly and sometimes did not cover the correct parts. The model definitely seemed to learn labels based on absolute location as well, since it assigned chair backs as legs and legs as backs when point clouds were rotated. Evaluating local features might improve this somewhat, but overall the model is not very robust to rotation.
Evaluation 2: Changing Number of Points
Classification
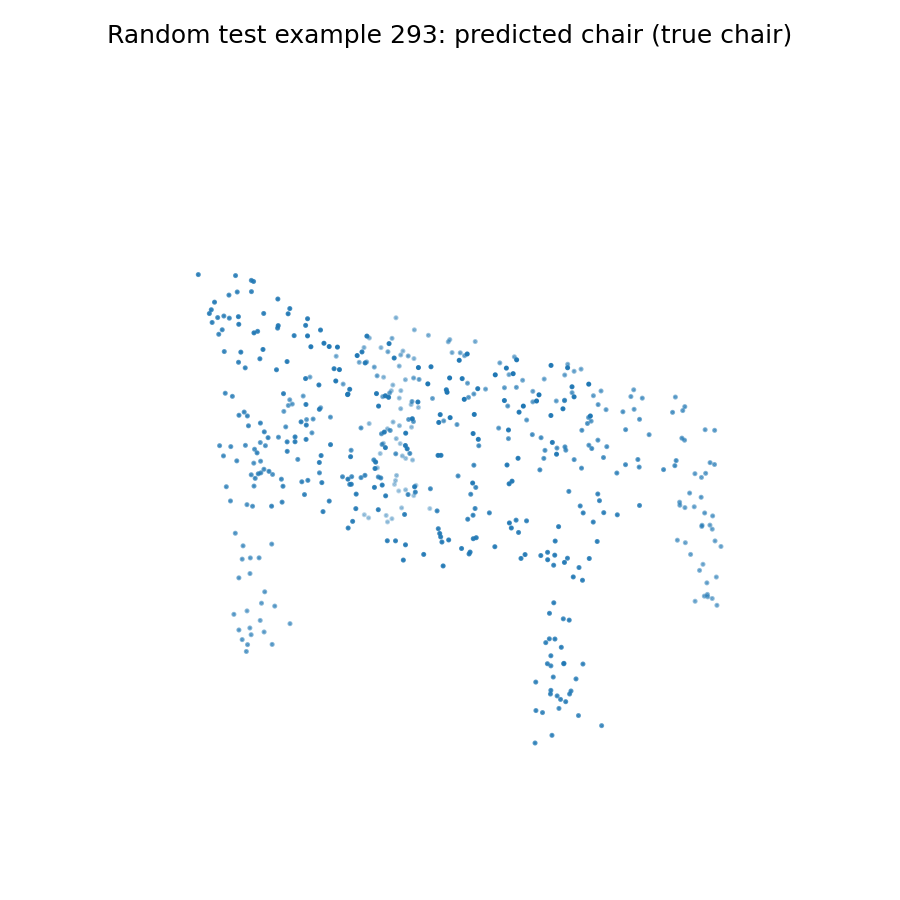
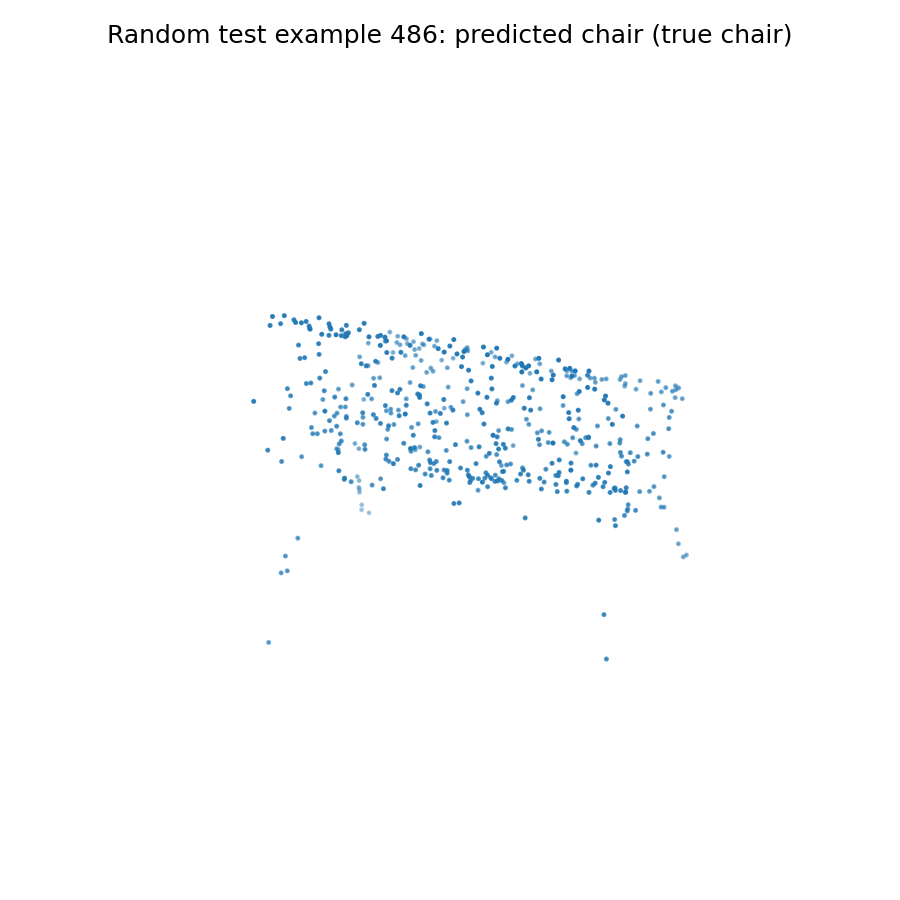
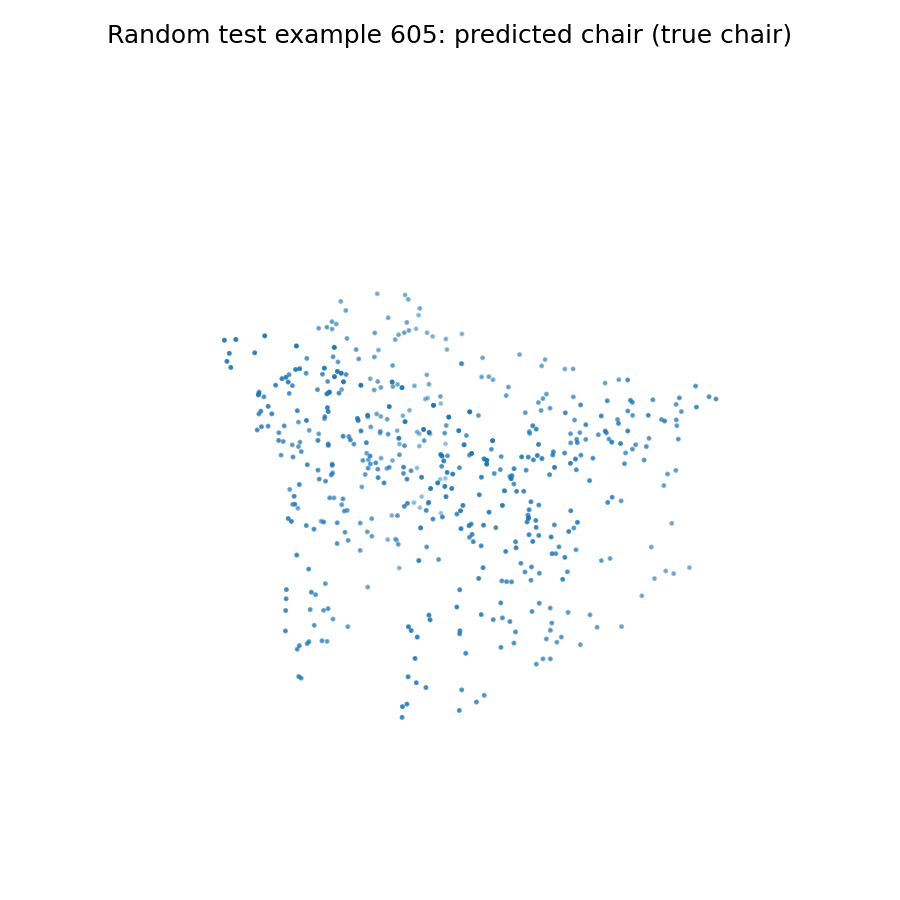
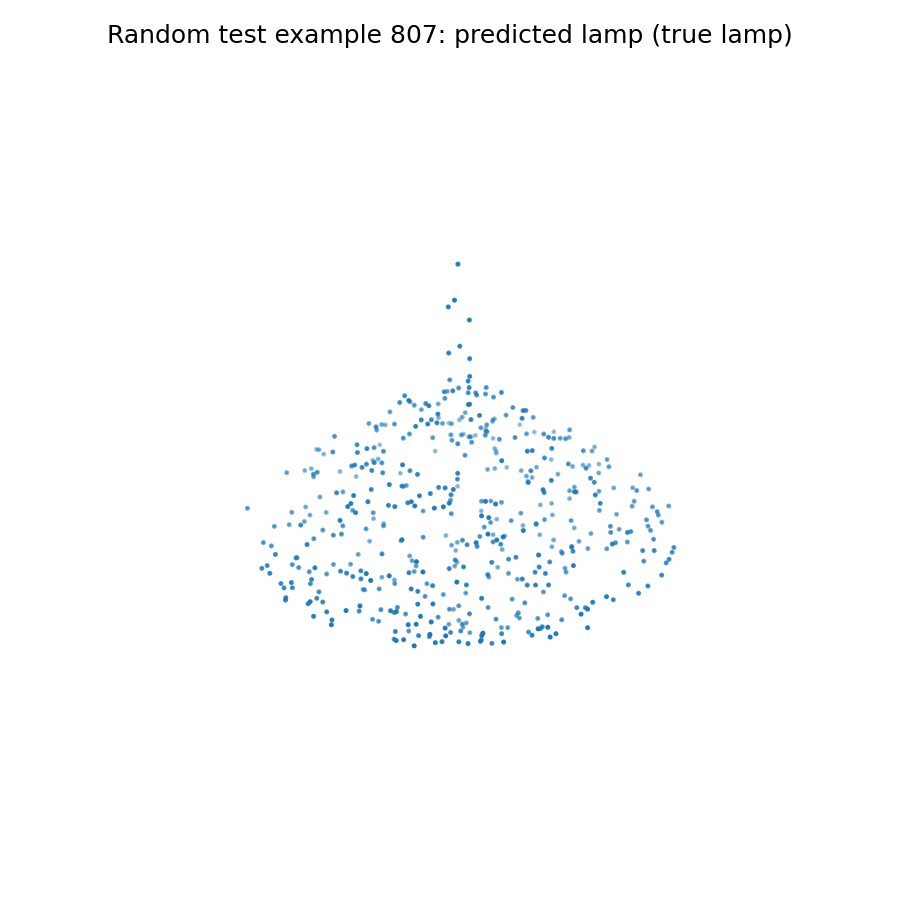
Test accuracy: 0.929
Prediction Visualizations (Original Set)
More Failures
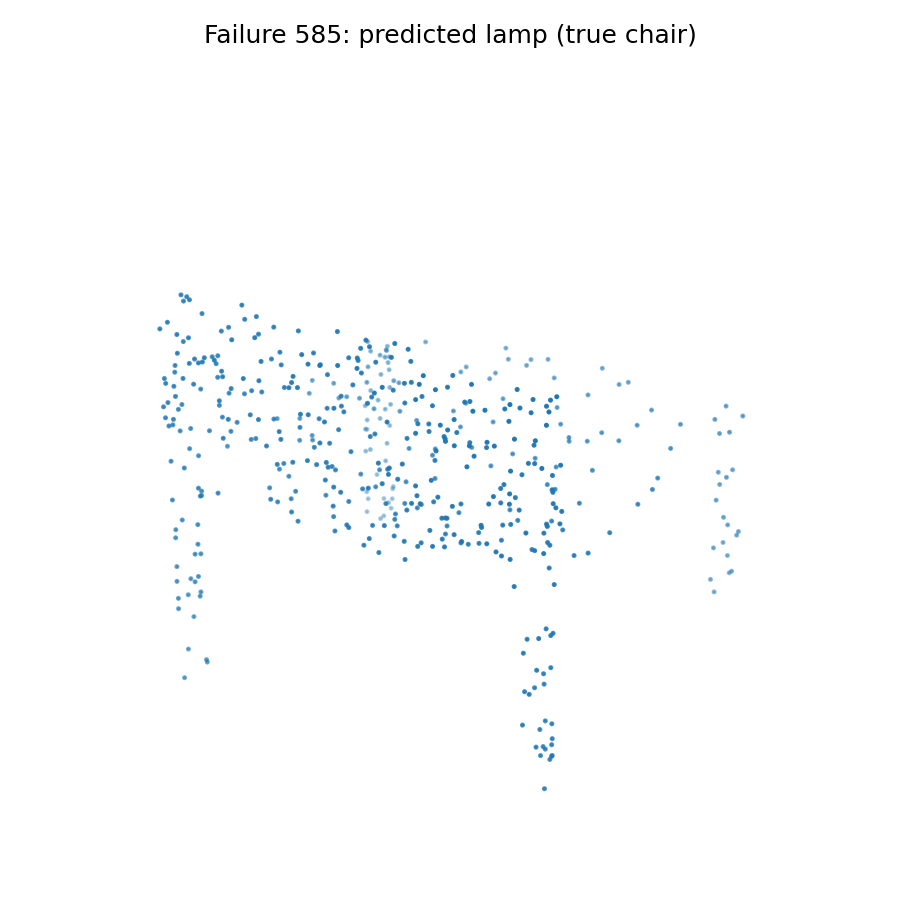
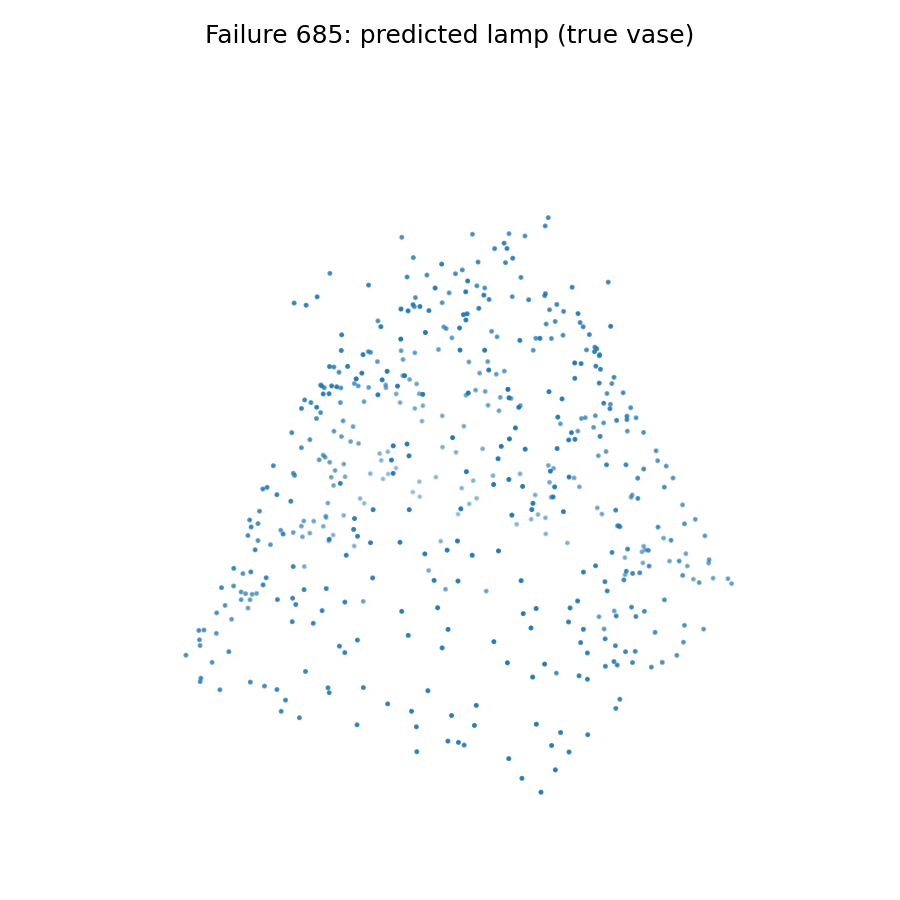
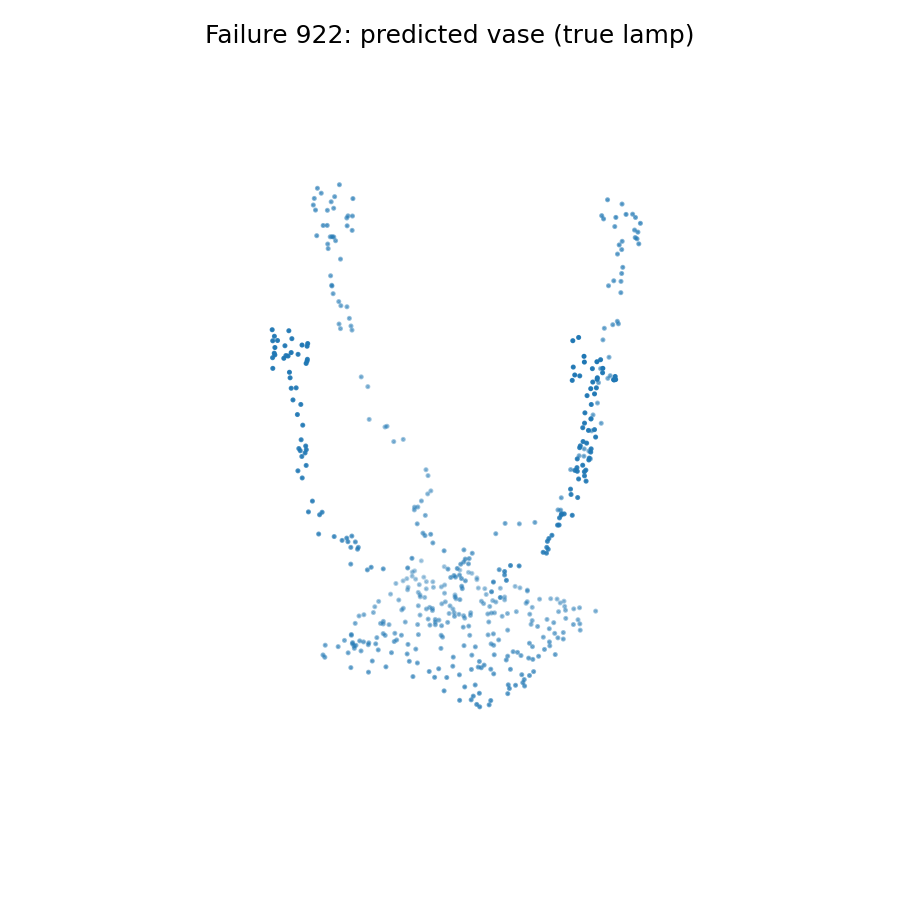
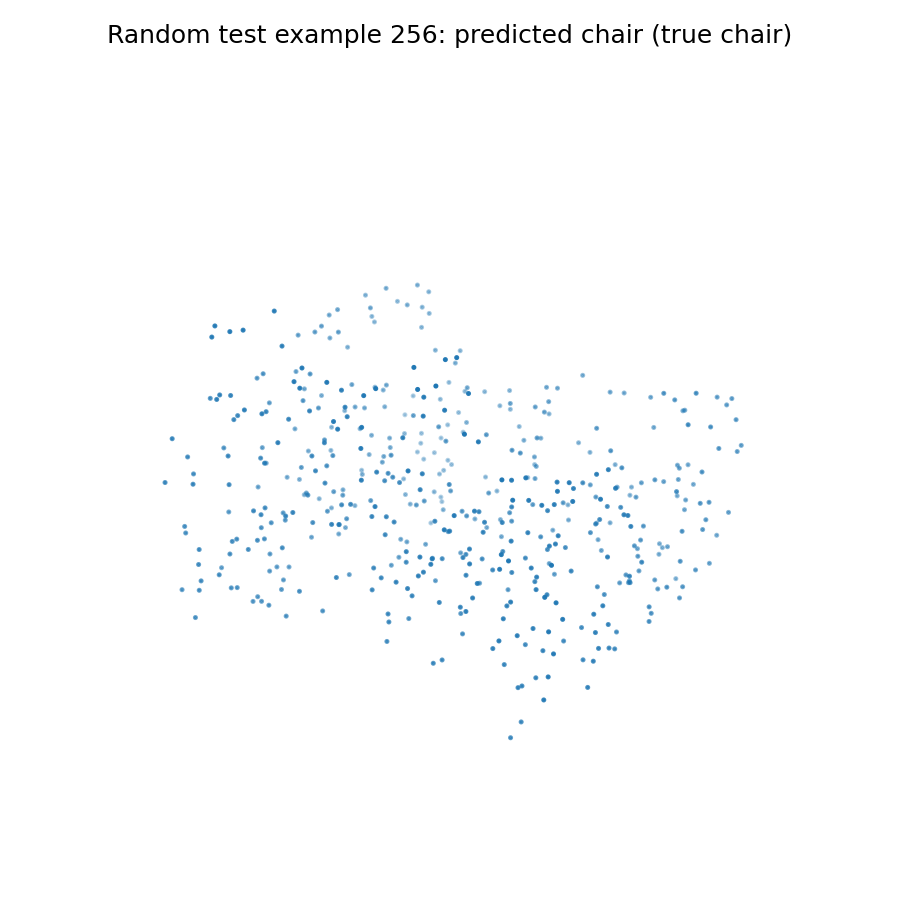
Test accuracy dropped slightly but not by much, which was expected. In this evaluation, I reduced the number of points from 10000 to 500 to make a sparse set of input points. The original evaluated set of randomly selected objects remained correctly predicted, but other failures were selected due to the wider pool to display the variation in failure cases. A lesser number of points reflects less input features for the model to evaluate on and apply learned features, but it was still able to identify most. Not pictured is an additional test with 5000 points, which yielded a test accuracy of 0.931; this implies that the correlation between density and accuracy has a more gradual decline after a certain threshold.
Segmentation
Test accuracy: 0.799
Results


Prediction Accuracy: 0.8880


Prediction Accuracy: 0.8500


Prediction Accuracy: 0.8040


Prediction Accuracy: 0.6460


Prediction Accuracy: 0.7260
This model did not see as much of an accuracy drop as expected. Just like with classification, I dropped the number of points from 10000 to 500 in evaluation. In most more-successful cases, the accuracy remained about the same, but in the failure cases, the accuracy actually increased slightly. This might be because the proportion of incorrect points is relatively smaller just by virtue of there being a smaller pool of points to classify, though notably in the last example the range of the armrests more closely matches the ground truth at 500 points than 10000 points (extending lower).
Q4: Locality
Classification
Test accuracy: 0.978
Original Failures
Original Failures


I followed a simple PointNet++-inspired structure for injecting locality into each model. I created a KNN-based local feature block before the existing global MLP that pools features from each point's k nearby points. These features are evaluated before the global MLP and concatenated with the original coordinates. As the results show, with the same configuration of default parameters, 250 epochs, and 10000 points, the test accuracy rose slightly from 0.963 to 0.978, showing that local feature evaluation did improve the model. Above are the failure cases from the original test without locality; while example 687 still evaluated incorrectly as a lamp instead of a vase, the other two examples actually saw correct classifications with locality implemented.
Segmentation
Test accuracy: 0.864
Results

Prediction Accuracy: 0.942

Prediction Accuracy: 0.821

Prediction Accuracy: 0.939

Prediction Accuracy: 0.695

Prediction Accuracy: 0.737
The segmentation model locality injection followed the same structure as the classification locality method. We see a much more significant increase in test accuracy here, where locality matters even more in refining the edges of segmented parts. With the ability to see more local features, the model was able to better predict the boundaries of each region within each subset of points. Overall test accuracy jumped from 0.802 to 0.864, and each model except for one in the original set saw an increase in accuracy and better-defined boundaries. Peculiarly, the one with a drop in accuracy saw an outward creep of the chair back region, potentially due to local feature processing obscuring where the broader boundary of the chair leg might be. It also witnessed wider but more spread-out creep of the seat region which was not present in other models.