Q1: Exploring Loss Functions
Voxel


Point Cloud

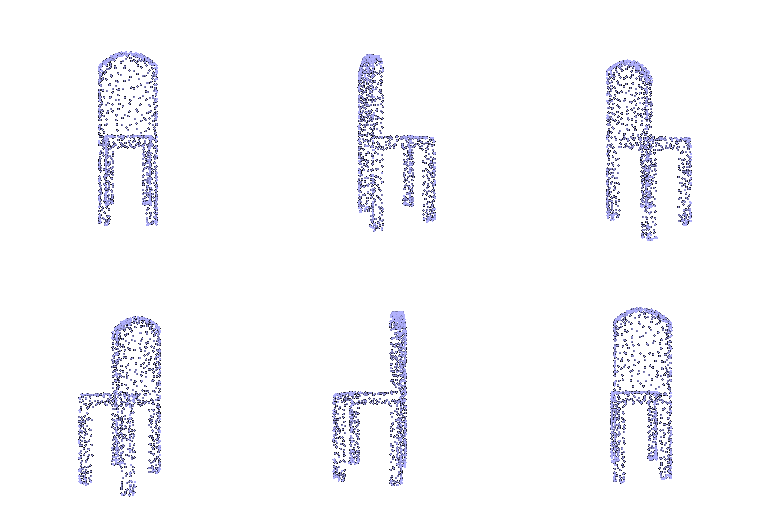
Mesh


Q2: Reconstructing 3D from single view
Voxel
Example 1


Example 2


Example 3


F1@0.05 Score: 27.275

Point Cloud
Example 1


Example 2

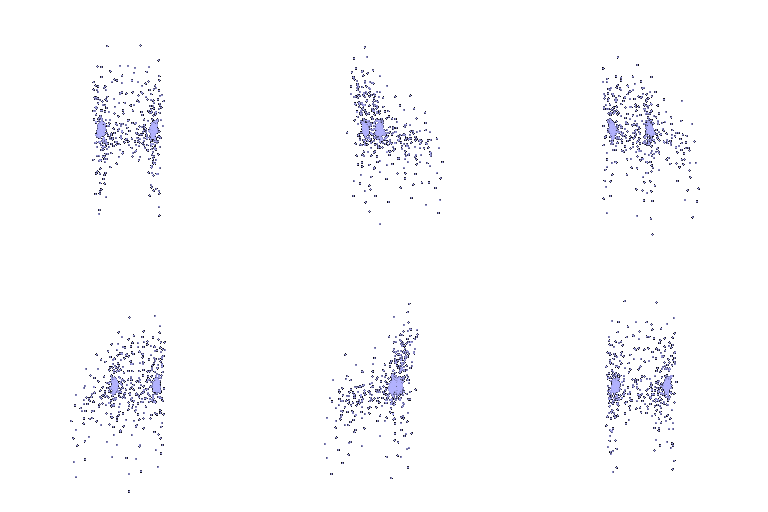
Example 3

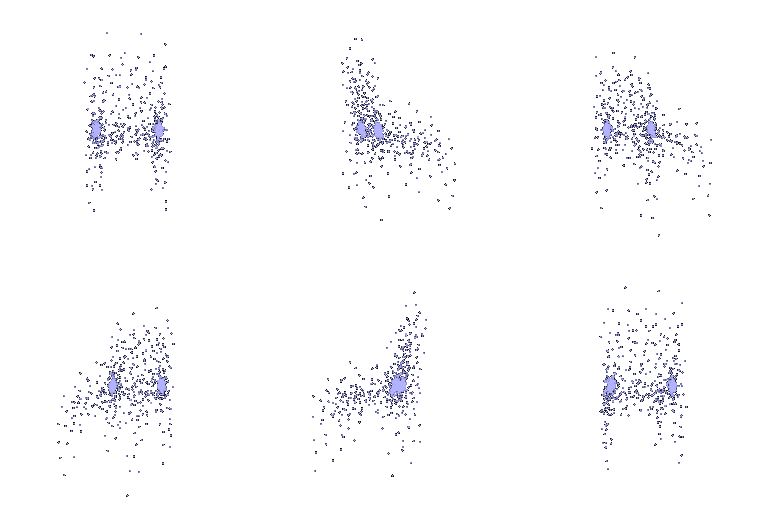
F1@0.05 Score: 79.895

Mesh
Example 1


Example 2


Example 3


F1@0.05 Score: 68.432

Hyperparameter Variations
n = 1000
n = 3000


n = 5000

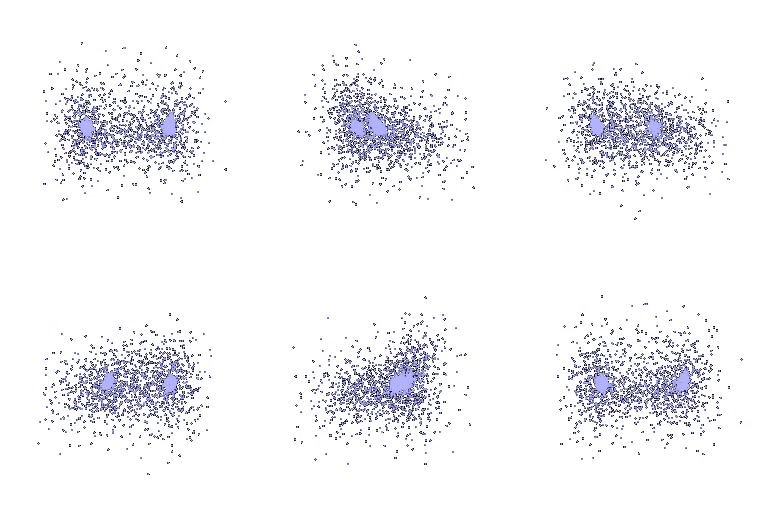


I tried varying the number of points in the point cloud to see if it would create a denser and more complete representation of the object geometry. The default version at n = 1000 points creates a sparse but reasonable representation of the object, but ideally more points would end up covering more of the surface. We see this in the ground truth where the point cloud is denser, but the prediction still seems a bit too sparse and spread out. However, some of the harder-to-define features, like the chair legs, start coming out more with higher numbers of points; this is visible in n = 3000 and yields a slightly higher F1@0.05 score (83.302 compared to 79.895 for n = 1000). I also hoped that it would help with recovering the gap in the chair geometry for Example 2, but it still seemed to struggle with that despite the higher number of points.
Interpretations
I was curious as to how the icosphere deformation worked to create the final mesh, since the prediction ended up being very spiky and disorganized. I tried rendering the ground truth and predicted mesh normals and their directions to visualize the deformation. The side with an outward-facing normal is colored blue while the other side is colored red. This is a common visualization in 3D modeling to determine the stability and connectivity of mesh faces and vertices. The ground-truth mesh has expected normal directions according to the orientations of their faces; the predicted mesh similarly has a significant portion of its normals be outward-facing, meaning that more of the outer surface of the icosphere is still being deformed to face outwards.
Visualizations


Q3: Exploring other datasets
Point Cloud
Example 1


Example 2

Example 3

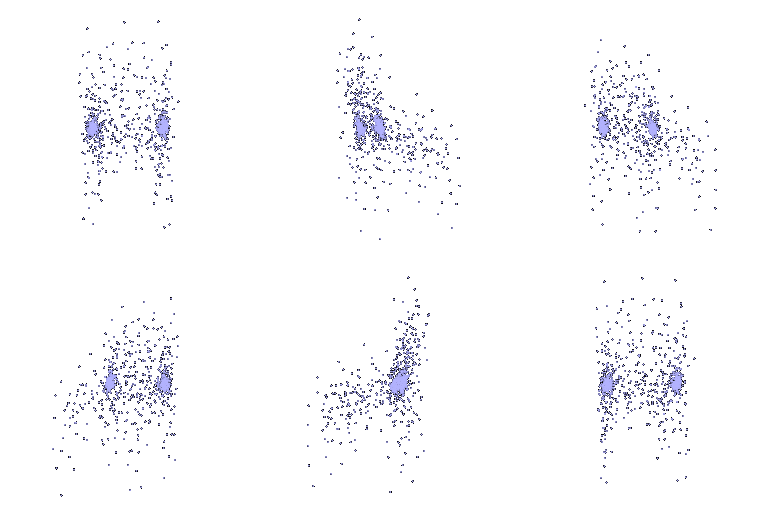
F1@0.05 Score: 83.623

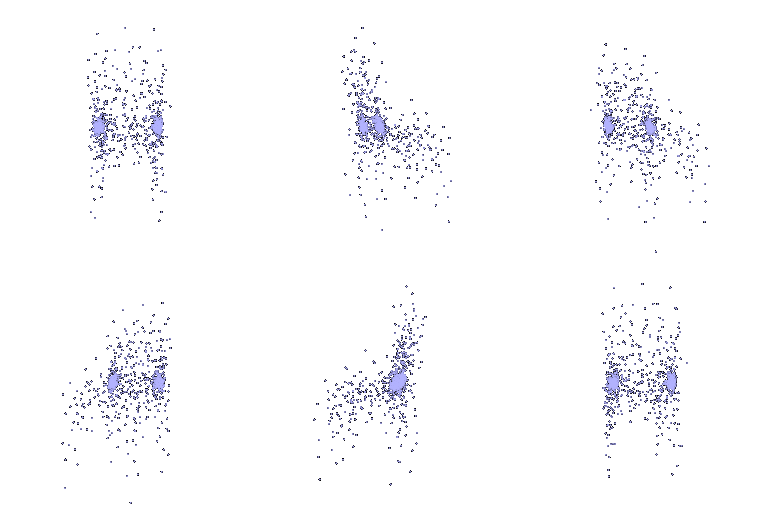
The F1 score for the chairs was slightly higher for three classes than for one class, comparable to the F1 score seen in hyperparameter variations for the point cloud. The change in prediction quality for the chair shapes was not large; as shown in the renders, the points still form the approximate correct shape but are still spread out significantly. However, the F1 scores for other classes are significantly higher (mid-high 90s), implying that their predictions are quite accurate. It could be that the variation in training data allowed the model to learn more diverse geometric information that it could then use to predict the varying geometries of objects across each category.
Collaboration
I briefly discussed the Q2 voxel decoder structure with Jacob Lessing (jlessing).