
Contents
Training setup. I used all the base settings but set my batch size to 16 instead of 32 so I could train locally. Reported numbers use the starter's best_model.pt, which is the epoch with the best test accuracy.
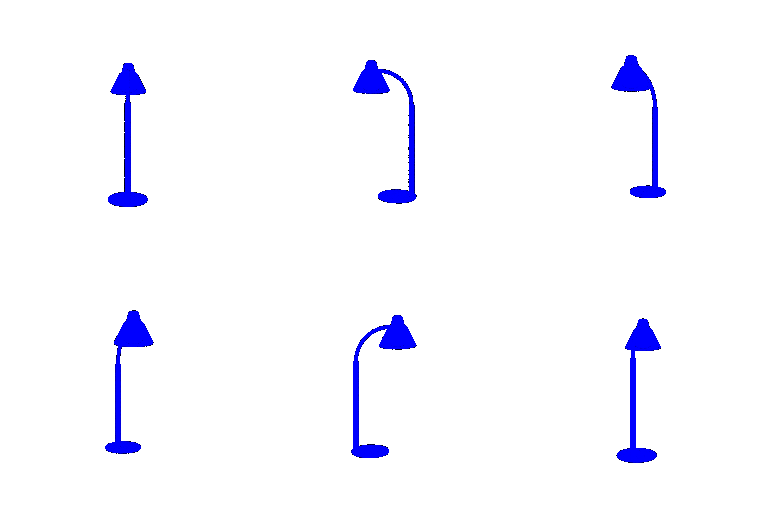
The PointNet classifier reaches 97.80% test accuracy (best at epoch 153; 97.17% at the last epoch, 249). Chairs are almost always right, while about one vase in ten is wrong, mostly called a lamp.
| True class | Test objects | Predicted chair | Predicted vase | Predicted lamp | Accuracy |
|---|---|---|---|---|---|
| chair | 617 | 616 | 0 | 1 | 99.8% |
| vase | 102 | 3 | 91 | 8 | 89.2% |
| lamp | 234 | 2 | 7 | 225 | 96.2% |
| | |
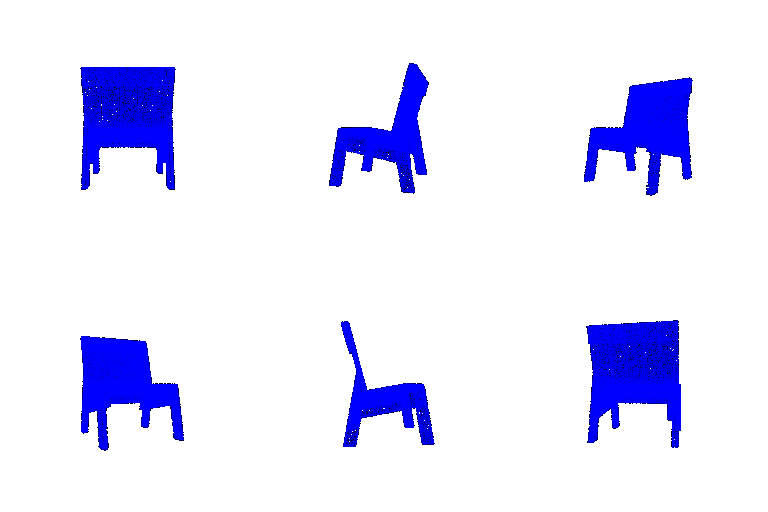
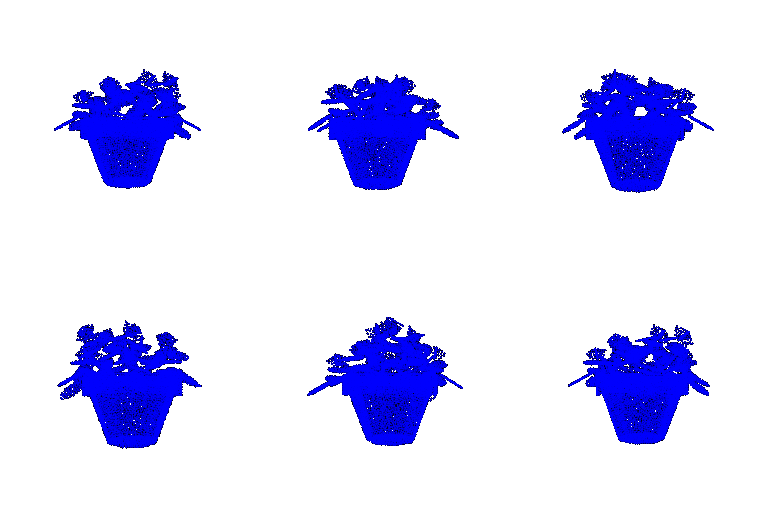
| #523: true chair, predicted chair | #393: true chair, predicted chair | #648: true vase, predicted vase |
| | |
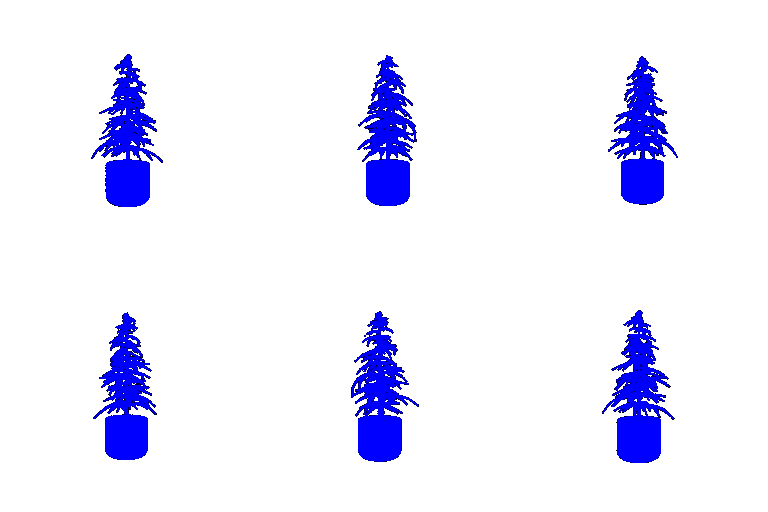
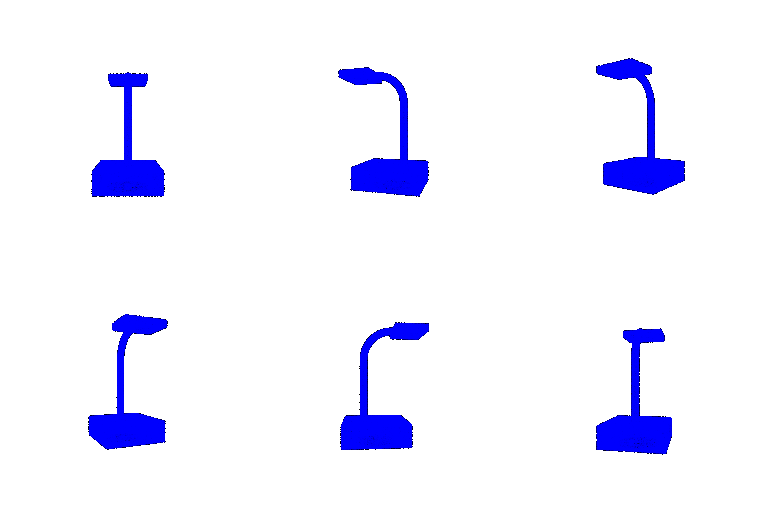
| #644: true vase, predicted vase | #722: true lamp, predicted lamp | #736: true lamp, predicted lamp |
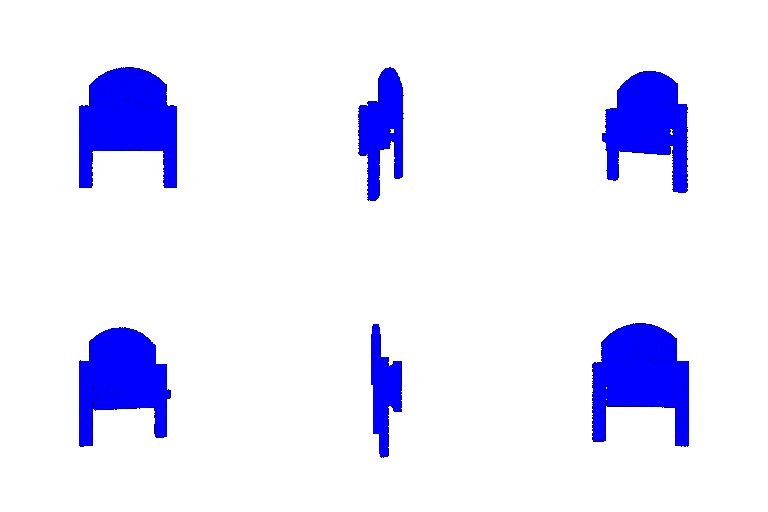 | 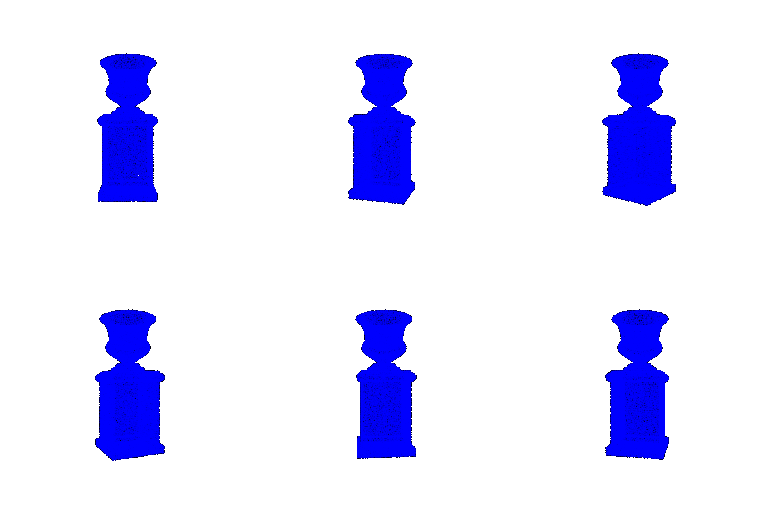 | 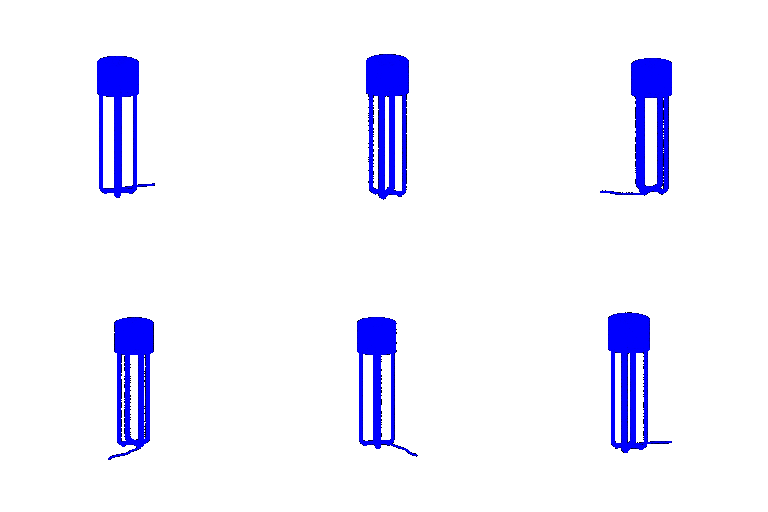 |
| #406: true chair, predicted lamp | #650: true vase, predicted lamp | #721: true lamp, predicted vase |
The failures are objects whose overall shape looks like another class. The only wrong chair (#406) is a thin, flat panel with a rounded top, closer to a flat lamp than a chair with depth. Vase #650 is an urn on a tall pedestal, the same layout as a lamp base with a shade on top, and lamp #721 is a closed cylinder on thin legs, which reads like a vase on a stand. PointNet sees only one max-pooled global feature, so it likely matches these outlines to the wrong class, which fits vase and lamp confusions making up 15 of the 21 errors.
The PointNet segmentation model reaches 90.44% test accuracy over all points (best at epoch 247; 90.13% at the last epoch, 249). Mean per-object accuracy is also 90.44%. The colours are seat red, back cyan, legs and base blue, arms yellow. The two rare parts (0.3% and 0.1% of points) are white and magenta.
| #392 (82.6%) | #315 (95.6%) | #523 (84.0%) | #235 (44.7%, bad) | #255 (45.4%, bad) |
|---|---|---|---|---|
 |  |  |  |  |
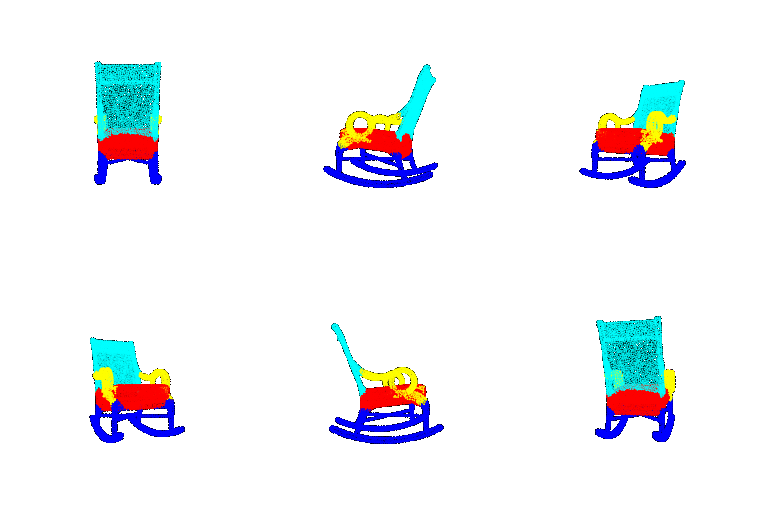 | 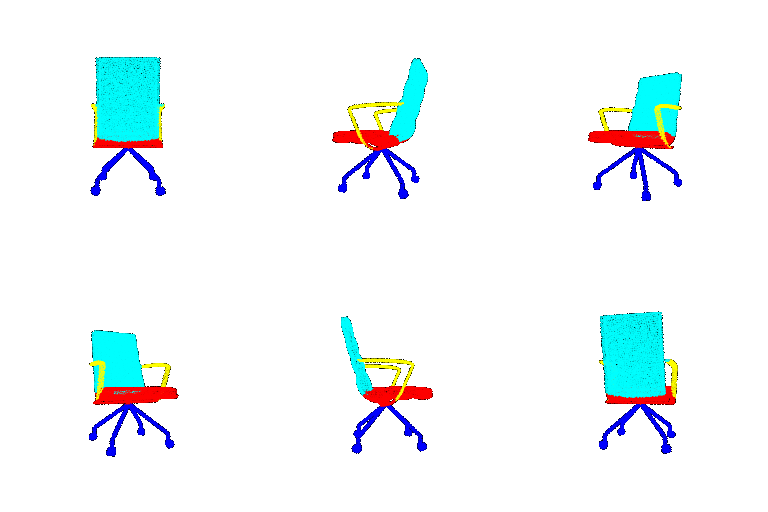 | 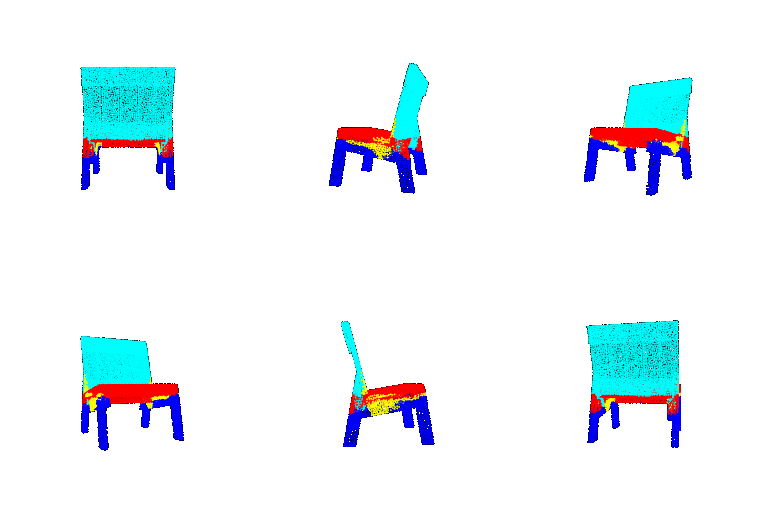 | 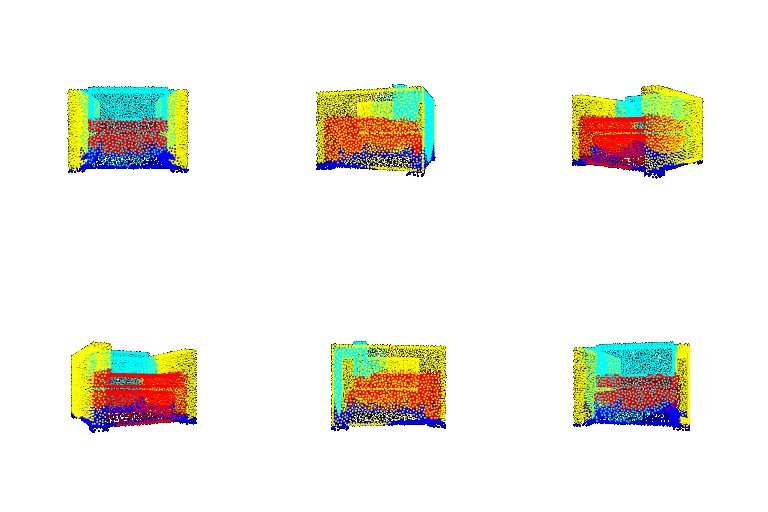 | 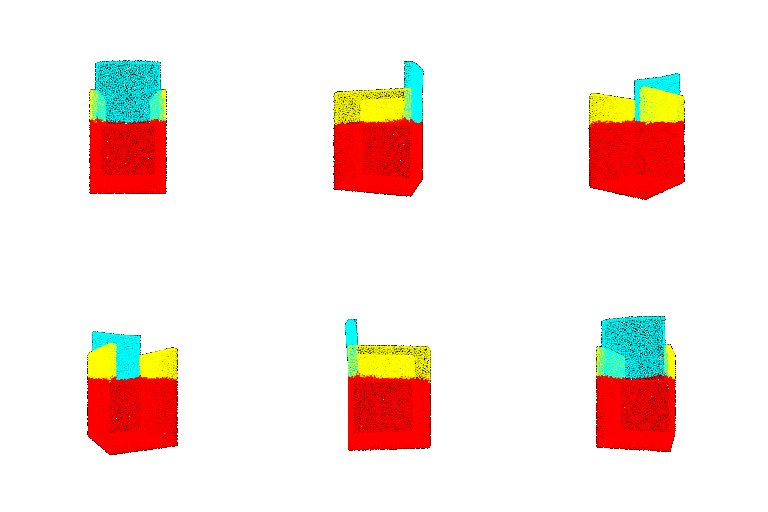 |
Top row ground truth, bottom row prediction, with per-object accuracy. The first three objects are random (seeded); #235 and #255 are the two worst test objects.
The model gets the large parts right and loses accuracy at part boundaries and on unusual chairs. On the random objects the back, legs and base are clean, and the errors sit where parts meet, such as the seat spreading onto the rocking chair's arms (#392) and onto the top of the legs, partly as arms (#523). The two worst objects are closed, boxy armchairs where the arms, seat and base form one block: on #255 the model labels the whole lower box as seat, while the ground truth splits it into seat and base. Every point gets the same global feature plus only its own 64-d local feature, so the model likely cannot see the local edges that separate touching parts.
Procedure. Both experiments use the Q1 and Q2 checkpoints without retraining.
| Rotation (degrees) | 0 (Q1/Q2) | 15 | 30 | 45 | 60 | 90 |
|---|---|---|---|---|---|---|
| Classification | 97.80% | 94.02% | 79.01% | 60.65% | 38.41% | 29.80% |
| Segmentation | 90.44% | 84.04% | 73.93% | 62.80% | 41.40% | 28.43% |
| Points per object | 10000 (Q1/Q2) | 5000 | 2000 | 1000 | 500 | 100 | 50 |
|---|---|---|---|---|---|---|---|
| Classification | 97.80% | 97.69% | 97.59% | 97.38% | 97.27% | 92.65% | 71.77% |
| Segmentation | 90.44% | 90.49% | 90.52% | 90.35% | 89.42% | 81.76% | 76.82% |
| Object | Original | Rotated 45 | Rotated 90 | 1000 points | 100 points |
|---|---|---|---|---|---|
| #523 chair |  |  |  |  |  |
| #393 chair |  |  |  |  |  |
| #648 vase |  |  |  |  |  |
| Object | Original | Rotated 15 | Rotated 45 | Rotated 60 | Rotated 90 | 1000 points | 100 points |
|---|---|---|---|---|---|---|---|
| #523 chair | chair | chair | chair | vase | lamp | chair | chair |
| #393 chair | chair | chair | vase | vase | lamp | chair | chair |
| #648 vase | vase | vase | lamp | lamp | lamp | lamp | vase |
Predicted class for the first three Q1 random objects.
| Object | Original | Rotated 45 | Rotated 90 | 1000 points | 100 points |
|---|---|---|---|---|---|
| #392 (random) |  |  |  |  |  |
| #235 (worst) |  |  |  |  |  |
| Object | Original | Rotated 15 | Rotated 45 | Rotated 90 | 1000 points | 100 points | 50 points |
|---|---|---|---|---|---|---|---|
| #392 | 82.6% | 75.2% | 59.4% | 40.4% | 82.2% | 74.0% | 78.0% |
| #235 | 44.7% | 46.9% | 43.2% | 31.0% | 49.5% | 38.0% | 28.0% |
Predicted parts and per-object accuracy for a random Q2 object and the worst one.
Rotation. Both models depend on the upright pose. Accuracy falls steadily with the angle, and at 90 degrees classification (29.8%) is far below always guessing chair (64.7%). On the tipped rocking chair (#392) a large block becomes seat, and the curved rockers, now standing upright, are labelled back except at their lowest points, which stay legs. Vase #648 becomes a lamp from 30 degrees, which matches the weak vase versus lamp boundary from Q1. Training never shows rotated chairs and the model has no transformation block, so the features likely encode absolute height and direction.
Number of points. Classification loses only 0.5 points at 500 points (97.27%), and segmentation loses about 1 point (89.42%). Max pooling only needs a few points near the extremes of each feature. At 50 points classification drops to 72% and segmentation to 77%, likely because so few points no longer trace thin parts like legs and arms.
Model. I implemented PointNet++ with single-scale grouping (cls_model_pn2 and seg_model_pn2 in models.py), using pytorch3d's farthest point sampling, ball query and kNN. It takes all 10000 points per object and has three set abstraction levels:
Each group is processed in coordinates relative to its centre, so every feature describes a local neighbourhood. The classifier ends in a 512-256-3 head with dropout 0.5. The segmentation model adds three feature propagation layers that interpolate features back to all 10000 points (inverse-distance weights over the 3 nearest coarse points), each concatenated with the skip features of that level, then a 128-128-6 per-point head with dropout 0.5. Training settings are the same as Q1 and Q2 (250 epochs, batch 16, lr 0.001).
Point order. Unlike PointNet, my PointNet++ depends on the order of the input points, because farthest point sampling always starts from the first point. Shuffling costs PointNet++ about 1 point on both tasks, while PointNet does not change. The comparisons below are in the original order, and the shuffled rows show how much of each gain survives.
| Model | Test accuracy | #392 | #315 | #523 | #235 (bad) | #255 (bad) |
|---|---|---|---|---|---|---|
| PointNet (Q2) | 90.44% | 82.6% | 95.6% | 84.0% | 44.7% | 45.4% |
| PointNet++ | 91.99% | 84.0% | 94.8% | 92.0% | 48.9% | 59.4% |
| PointNet++, random point order | 90.67% | mean of 4 random orders (90.60% to 90.76%) | ||||
| #392 | #315 | #523 | #235 (bad) | #255 (bad) |
|---|---|---|---|---|
| | | | |
| | | | |
 |  |  |  | 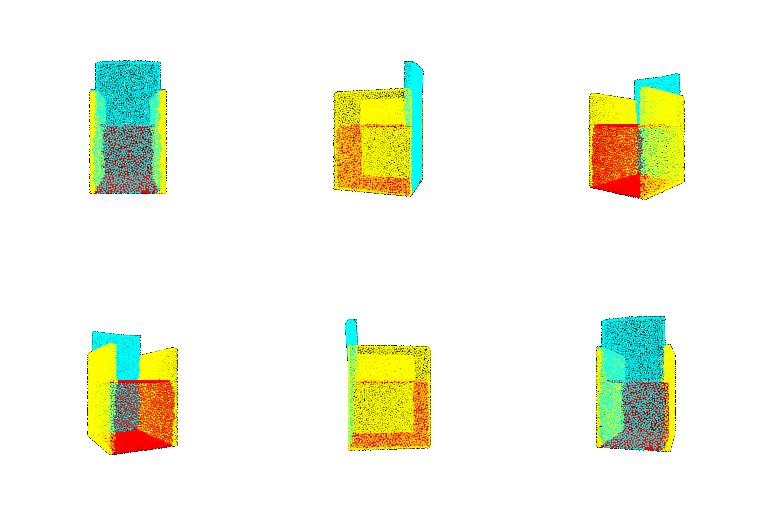 |
Rows: ground truth, PointNet (Q2), PointNet++. Same objects as Q2. PointNet++ best at epoch 163; 91.73% at the last epoch.
Locality mostly cleans up part boundaries. The clearest gain is #523 (84.0% to 92.0%), where the seat no longer spreads onto the tops of the legs, and the features of small neighbourhoods likely let PointNet++ see the edge where a leg meets the seat. The bad boxy armchairs improve but stay poor (#255 from 45% to 59%): PointNet++ no longer calls the whole lower box seat, but labels it arms and back instead of base. Overall PointNet++ is 1.6 points better in the original order but only 0.2 points better with shuffled points, so the gain is small and partly comes from the fixed order.
| Model | Test accuracy | Chair | Vase | Lamp |
|---|---|---|---|---|
| PointNet (Q1) | 97.80% | 99.8% | 89.2% | 96.2% |
| PointNet++ | 98.53% | 100.0% | 94.1% | 96.6% |
| PointNet++, random point order | 97.56% | mean of 4 random orders (97.38% to 97.80%) | ||
| | |
| #406: true chair. PointNet: lamp. PointNet++: chair | #650: true vase. PointNet: lamp. PointNet++: vase | #721: true lamp. PointNet: vase. PointNet++: lamp |
The Q1 failures, with both models' predictions on the same point clouds. PointNet++ best at epoch 166; 98.32% at the last epoch.
In the original point order, locality fixes most of the shape confusions from Q1. PointNet++ makes 14 errors against 21 (16 fixed, 9 new), and it gets all three Q1 failures right, likely because local features of rims, pedestals and stands separate a vase on a pedestal (#650) from a lamp with a shade. The gain does not survive shuffling, though: with random point orders PointNet++ scores 97.56% on average, below PointNet's 97.80%, and #406 and #650 flip back to lamp under some orders. So on classification, where PointNet is already near 98%, I see no reliable benefit from locality, and the remaining errors of both models are mostly vase versus lamp.
Limitations. The checkpoint is chosen on the test set, and there is one run per model. I did not retrain PointNet++ with a random start for sampling, which would likely remove its order dependence.