
These are my voxel grid images (top = my grids, bottom = GT).

These are my point cloud images (top = my clouds, bottom = GT).

These are my mesh images (top = my meshes, bottom = GT).


Each of the three examples that I've shown here (left to right) show the input RGB at the top, and then the predicted voxels and GT mesh below, in the same format as 1.1.

As you can see my model got an F1@0.05 score of 43.08.
Also, I did NOT use --load_feat for this or any future part.


Each of the three examples that I've shown here (left to right) show the input RGB at the top, and then the predicted point clouds and GT mesh below, in the same format as 1.2.

As you can see my model got an F1@0.05 score of 77.89.


Each of the three examples that I've shown here (left to right) show the input RGB at the top, and then the predicted meshes and GT mesh below, in the same format as 1.3.

As you can see my model got an F1@0.05 score of 70.32.
Out of the three, point clouds did best (77.89), then meshes (70.32), then voxels (43.08), which did significantly worse. I would likely attribute the poor results of the voxels because of the low resolution. The point clouds and meshes are able to represent the surface directly, which is why they have better scores. The point cloud model probably outperformed the meshes because you're able to directly place the points on the objects surface rather than having to conform to the sphere deformation of meshes.
The hyperparamter that I chose was the pos_weight in the voxel BCE loss. This hyperparameter controls how missed occupied voxels are weighted compared to empty ones.


As you can see, I used the same test chair at each pos_weight. Since only around 5% of the voxels were actually occupied, plain BCE with pos_weight = 1 causes the model to output emptier images. As pos_weight gets higher, the predictions fill more of the chair, with the F1 score peaking at pos_weight = 3 (65.2). As we keep increasing the pos_weight further past that, the predictions start to get too thick. It's worth noting that for section 2.1, I chose to use pos_weight = 5 instead of 3, because that was the lowest value that I found to result in no empty predictions (which crash the eval function, and I wasn't sure if we were allowed to change it.)
I chose to do my interpretations on my point cloud model since it had the best F1.

Point Correspondence -- I colored each of the 1000 output points by where it sits in the model's average predicted chair, and then used those same colors for 6 different test chairs. The colors show up in the same spots on each of the imtages, which shows that each output point has 'learned' a consistent role (which was a little surprising to me, since Chamfer doesn't care about point order).

Error Heatmapping -- I created a visualization in which each predicted point is colored by its distance to the ground truth surface. From this, you can see that the overall structure of the chair is captures well, and most of the errors are stray points near the corners/edges of the chairs.


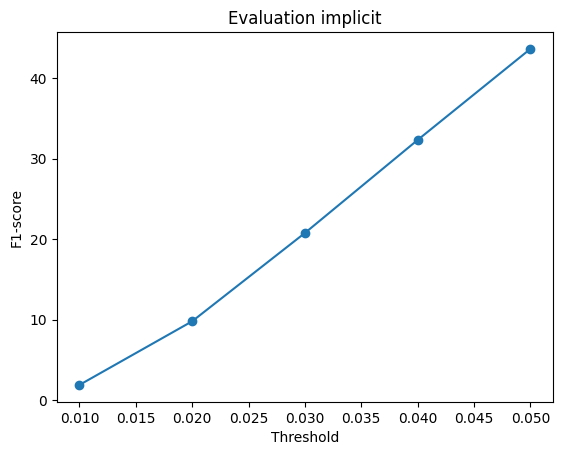
My implicit decoder got an F1@0.05 score of 43.66 (around what my voxel model got).


My parametric decoder got an F1@0.05 score of 61.57 (pretty significantly worse than my point cloud model).