|
Determination of KI using a Secondary Plot
- Double Reciprocal Plot: 1/vo vs. 1/[A].
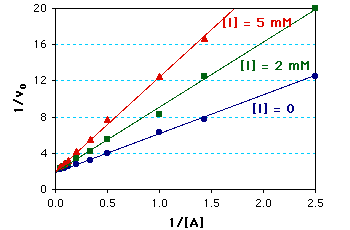
The above graph is the same as that on the Enzyme Inhibition: Answer Sheet page. The bottom (blue) line corresponds to the data without added I. The intercept and slope yielded, Vmax = 0.5 mM/min and KM = 2 mM.
The top two lines (green and red) correspond to the lines with 2 mM and 5 mM added [I], respectively.
- Secondary Plot: Slopes vs. [I].
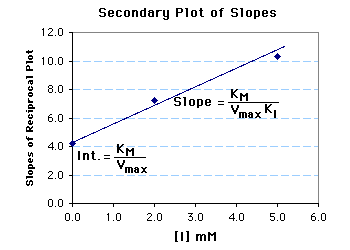
The slopes from the above double reciprocal plot are plotted in a secondary plot (or "replot") vs. the [I]'s used.
The intercept of this graph is, KM/Vmax.
The slope of this graph is, KM/(VmaxKI).
Thus, KI = Int/Slope = 3 mM.
 Back to Enzyme Inhibition: Answer Sheet. Back to Enzyme Inhibition: Answer Sheet.
|