
7. Refine the Mesh
In order to obtain more accurate results, we will refine the previous mesh by
assigning mesh sizes to the lines on the plate. Since the area around the hole
is of greatest interest, when specifying element sizes, it is better to decrease
the line division size as the hole is approached. (More elements near the hole)
However, before refining the mesh, you will have to clear the previous mesh
:
PREPROCESSOR -> -Meshing - Clear
CLEAR -> Areas
CLEAR
AREAS -> Pick all areas.
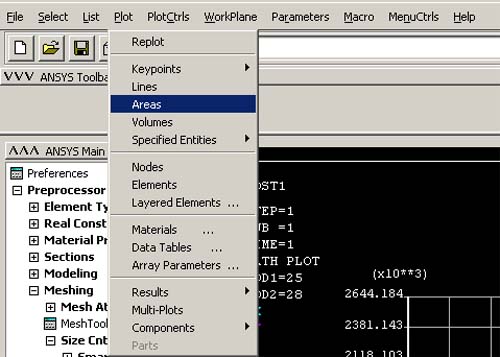
UTILITY
MENU -> Plot - Areas
You have just cleared your previous mesh. Now we will assign new mesh sizes
to the line to create a finer mesh.
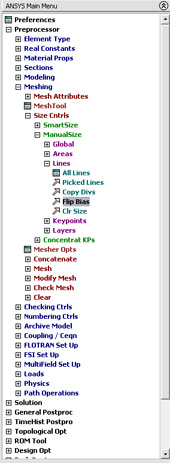
PREPROCESSOR -> -Meshing - Size Cntrls
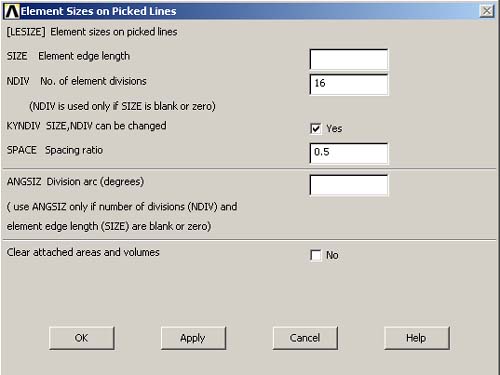
SIZE CNTRLS -> Lines -Picked Lines
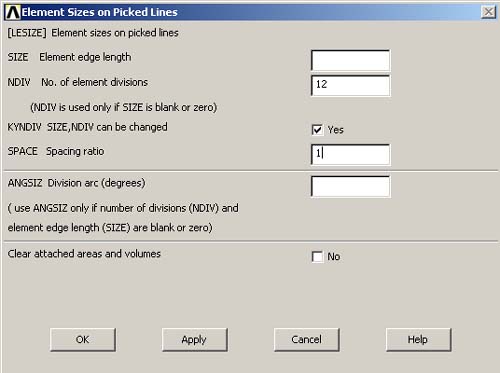
ELEMENT SIZE ON PICKED LINES -> There
are altogether 10 lines on the plate. In the following 4 steps, we will assign
the number of element divisions per line and spacing ratio to each line so
that there will be more elements on the area around the hole, and also to
arrange the elements in a nice order.
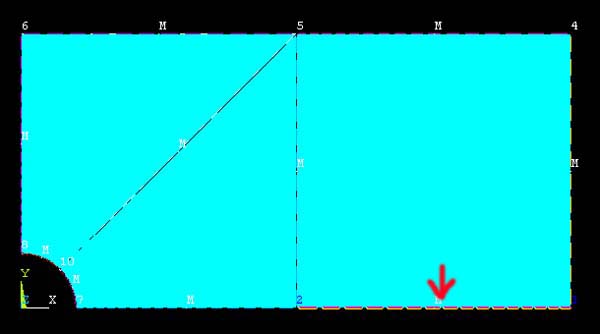
1)
Pick 2 lines on the edge of the hole, and 2 lines on the opposite sides. (See
figure below). Then click APPLY
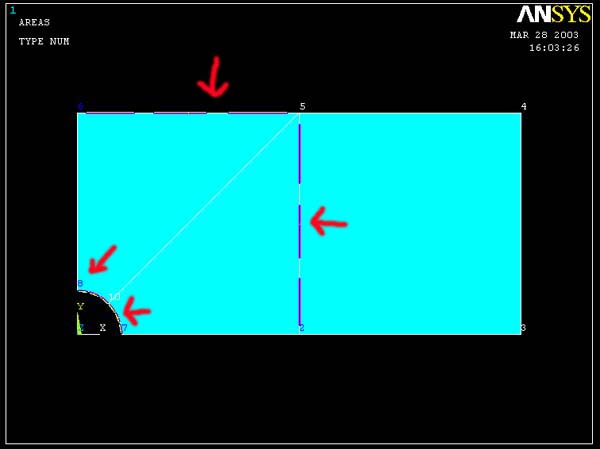
Enter 12 for number of element divisions per line and 1 for Spacing ratio.Then
click APPLY.
 |
Note
: |
NDIV
= If positive, NDIV is the number of element divisions per line. If -1,
NDIV is assumed to be zero element divisions per line
|
| SPACE
= Spacing ratio. If positive, nominal ratio of last division size to first
division size (if > 1.0, sizes increase, if < 1.0, sizes decrease).
If negative, |SPACE| is nominal ratio of center division(s) size to end
divisions size. Ratio defaults to 1.0 (uniform spacing) |
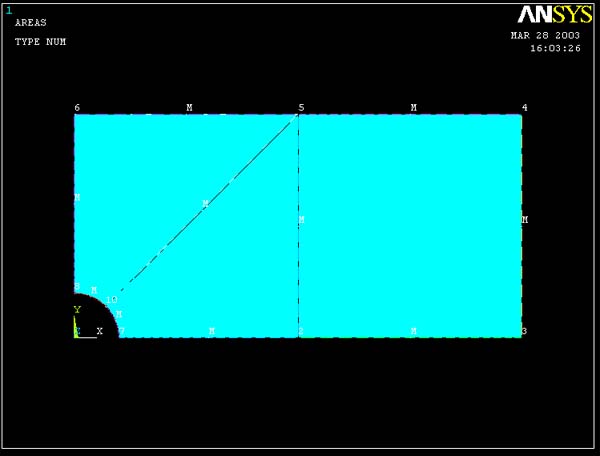
2) Pick the three lines that radiate from the hole. (See Figure below)
Then click APPLY.
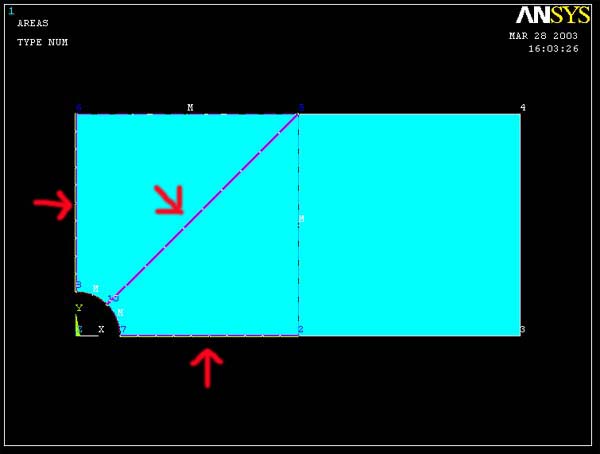
Enter 16 for number of element divisions per line and 0.5 for Spacing ratio.
Then click APPLY. (More number of element divisions means more elements near
the hole. Also, specifying a Spacing ratio less than 1 means that the element
sizes decrease as the hole is approached.)
3) Pick the line on the right most edge of the plate. (See Figure) Then
click APPLY.
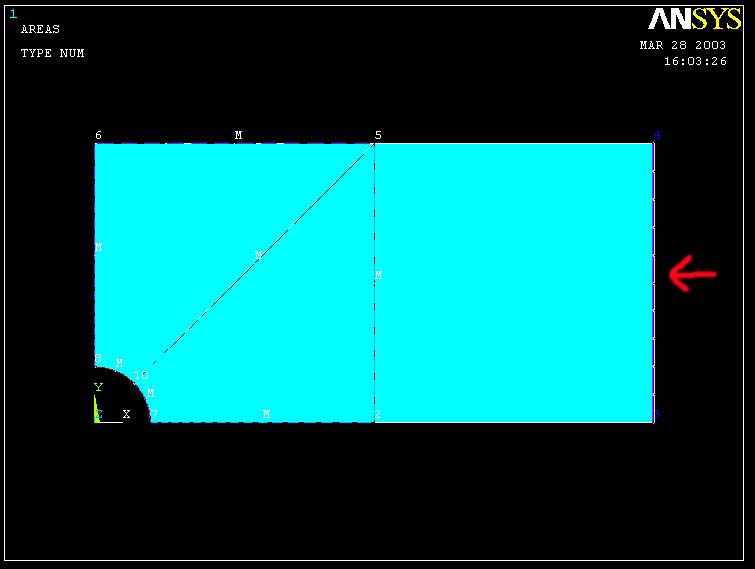
Enter 12 for number of element divisions per line and 1 for Spacing ratio. Then
click APPLY.
4) Pick the remaining 2 lines. (See Figure) Then click APPLY.
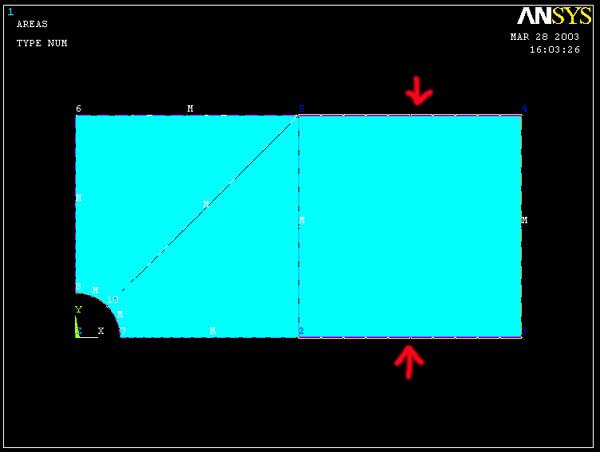
Enter 16 for number of element divisions per line and 0.5 for Spacing ratio.
Then click OK.
Note that the division sizes on the bottom line decrease as the hole is approached.
This is because the number of keypoints on the left of the bottom line is less
than of the one on the right, when 0.5 was input for the spacing ratio, ANSYS
decreased the division sizes from the left to the right on the line. But since
we need the opposite result, the next step will lead you to flip the line division
which is what we will do next.
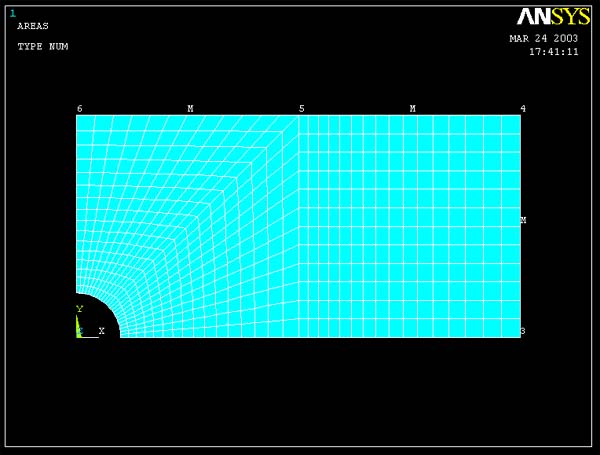
After meshing,
you should see the figure below.
Note that
after the lines are meshed, there will be letter M's
located beside the lines indicate that they are already meshed. Also notice
that when the lines are picked, ANSYS shows the numbers
of keypoints of those lines in blue. These numbers are important when
you assign the spacing ratio. If the spacing ratio is less than one, element
sizes decrease along the line from the former keypoint to latter keypoint.
Now, we will flip
the line division using the flip bias command.
SIZE
CNTRLS -> Flip Bias
FLIP LINE BIAS -> Pick the bottom line that needs
to be flipped.
Click OK.
Now the plate is ready to be meshed.
PREPROCESSOR -> -Meshing -Mesh
MESH -> Areas -Mapped
MAPPED
-> 3 or 4 sided
MESH
AREAS -> Pick all areas.
MESH
AREAS -> OK.
Generate a solution, then obtain results as in steps 6a - 6e. Compare results
with the ones previously obtained from auto-meshed model. Observe how the results
changed with mesh resolution.
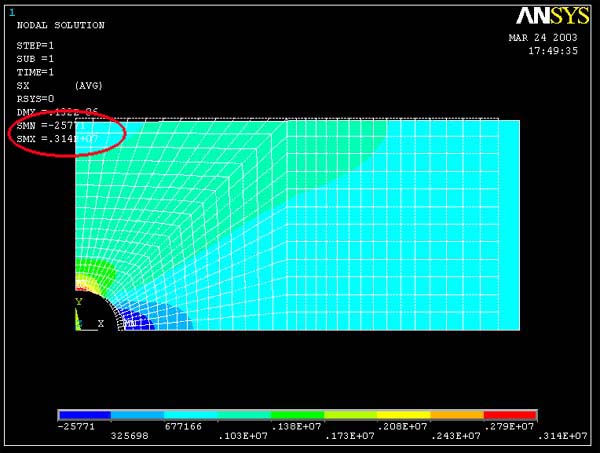 <-----Contour Plot of stress xx
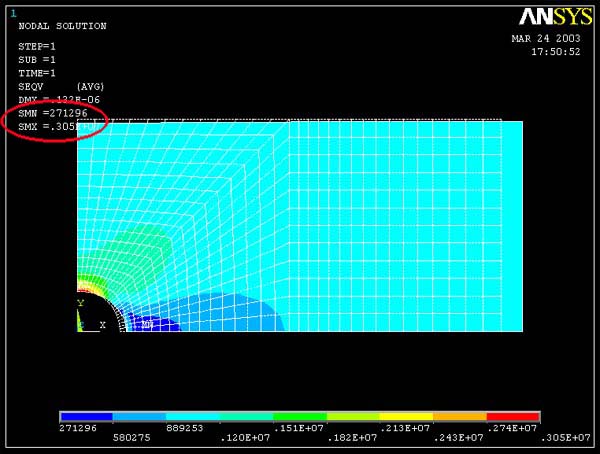 <-----Contour Plot of Mises Equivalent
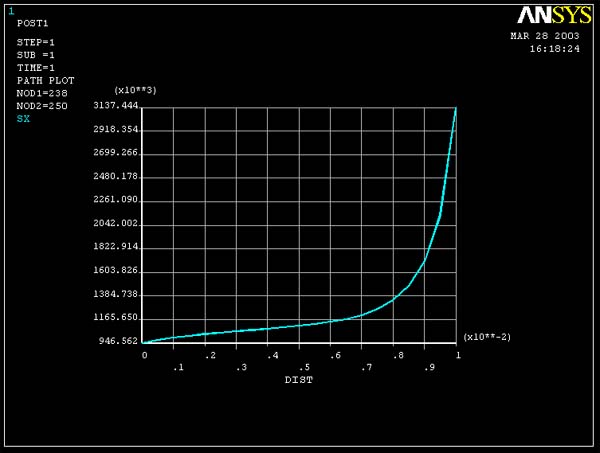 <-----Stress
xx V.S. y
<-----Stress
xx V.S. y
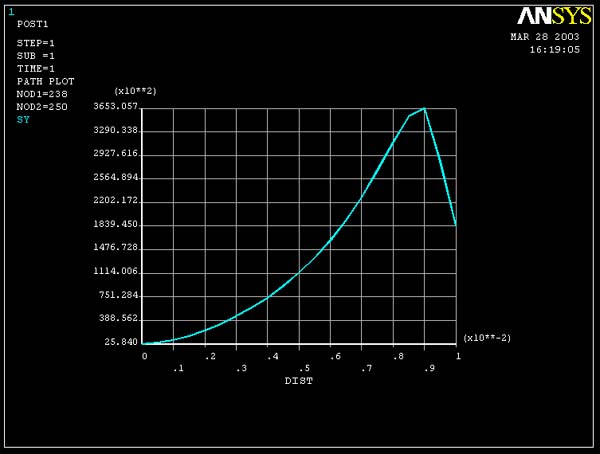 <-----Stress
yy V.S. y
<-----Stress
yy V.S. y