6E. Graph Stresses Across the Cross Section
![]()
6E. Graph Stresses Across the Cross Section
![]()
MAIN MENU -> General
Postproc
GENERAL POSTPROC -> Path
Operations
PATH
OPERATIONS -> Define Path-By Nodes
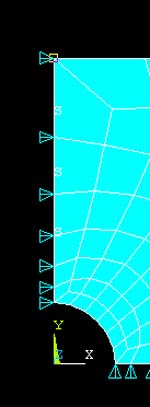
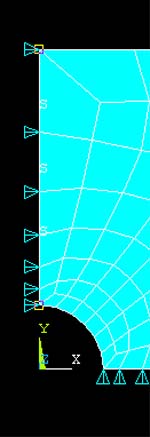
DEFINE PATH -> Pick nodes along the left edge of the plate toward the hole.
First Second
Click OK.
In the Define Path Name box, type: 1,
click OK.
PATH OPERATIONS -> Map Onto Path
MAP RESULTS ITEMS ONTO PATH -> Highlight
Stress
MAP RESULTS ITEMS ONTO PATH -> Highlight
X-Direction SX or whichever stress component is relevant.
MAP RESULTS ITEMS ONTO PATH -> OK
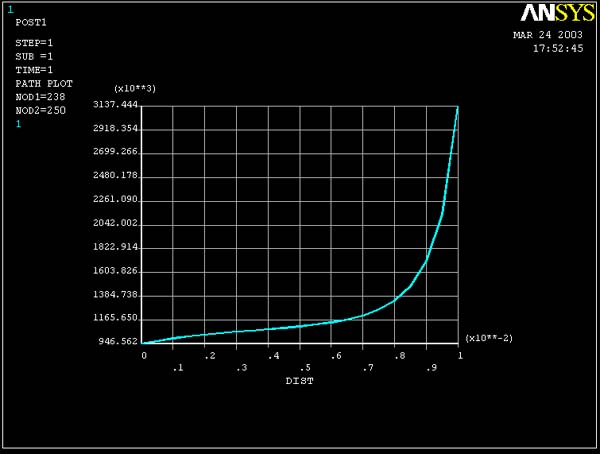
PATH OPERATIONS -> Plot Path Items -On Graph
PATH PLOT OF PATH ITEMS -> Highlight
SX
PATH PLOT OF PATH ITEMS -> OK
A graph of the stresses along the chosen path will appear as shown in the figure
below.
You can also get plots of Sigma yy vs. y by the steps similar to those listed
above. The figures below show how the Sigma yy graph looks like and how a combined
plot of sigma xx and sigma yy appears.
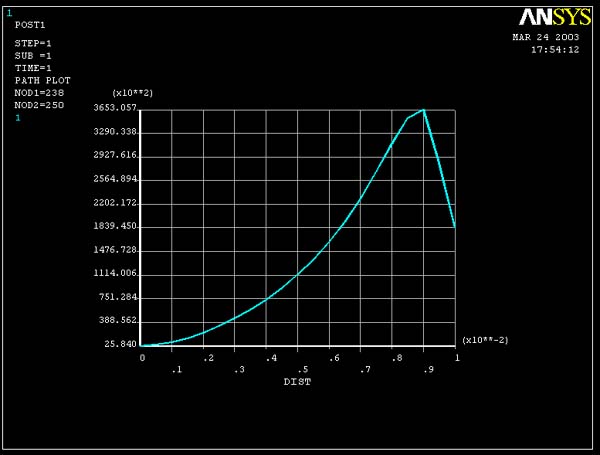 <-------- Sigma yy
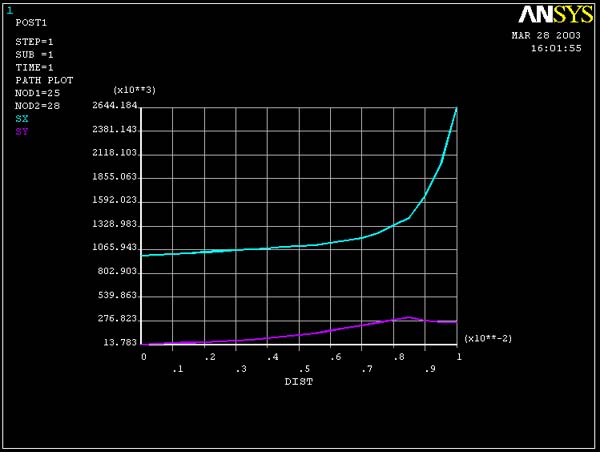 <--------
Sigma xx and Sigma yy
<--------
Sigma xx and Sigma yy