8. Interpreting Your Results
The following section discusses the results from 6 element (1 along the height
and 6 along the length) and a 96 element (4 along the height and 24 along
the length) models of your beam problem.
The problem you are solving is that of a beam-shaped object under four point
bending. As a result, you would expect that beam theory would give you insight
and reasonable approximations for the axial stress Sigmaxx, the shear stress
Tauxy and the vertical displacement, v, of the neutral axis. The ANSYS code
uses the full theory of elasticity, however, and it can therefore give results
not predicted by beam theory. Also, in general, the ANSYS model will only
approach the true solution to the problem in the limit as the number of elements
is increased.
Displacement of the Neutral Axis
Beam Theory Predictions:
Beam theory predicts that the maximum displacement of the neutral axis will
occur at x = 12" and will equal:
(Pa/24EI)(3L^2
- 4a^2) ; where P is the magnitude of the applied forces = 1000 lb, a is the
the distance measured from the end of the beam to the force = 8 in, and L
is the length of the beam = 24 in.
Using the properties and dimensions of our beam, this gives a maximum displacement
in the middle of the beam of 0.0245 inches downward
ANSYS Predictions:
By extracting nodal y displacement values at the neutral axis at the center
of the beam, a 6 element ANSYS model of this problem predicts a maximum displacment
equal to: -0.024816. A 96 element ANSYS model of this problem predicts a maximum
displacement equal to: -0.024947.
Note that even though you are given a large number of significant digits in
your ANSYS results, your answer is only as accurate as the data you input
to the model. Most material properties and measurements are only accurate
to 3 significant digits, so reporting more than 3 digits in your results is
of little engineering value (and can be confusing).
Interpretation of the Results:
Beam theory yields a reasonable approximation for the neutral axis displacements
for this problem. The displacement predictions made by the 6 and 96 element
models are essentially the same.
Because the displacement predictions are not changing with element resolution,
it can be concluded that further resolution of the model is not needed to
obtain accurate displacement results. The discrepancy between the beam theory
prediction of -0.0245 inches and the ANSYS model predictions of essentially
-0.0249 inches is likely due to contributions to the displacements that the
ANSYS model is able to pick up that beam theory does not account for.
The Normal Stress Sigma xx:
Beam Theory Predictions:
Beam theory predicts that the stress in the left 1/3 of the beam varies linearly
in x and y and is given by the formula -Pxy/I. The stress in the center 1/3
of the beam is constant in x (because the bending moment is constant there),
linear in y and is given by the formula -PLy/3I. If the loads and dimensions
of the current problem are used in the equation for Sigmaxx between the two
inner loading points, the equation that results is Sigmaxx = -12000y psi,
so that the stress magnitude at the top and bottom of the beam is 12 ksi.
Note that in a real beam, a stress of 12 ksi would not cause it to yield.
Notice that because your analysis is LINEAR, you also know the answer for
any proportional change in the applied loading. For instance, if your applied
loads were increased by a factor of 10, the maximum stress predicted by your
model would be 120 ksi. A stress of 120 ksi in a real beam would cause yielding
unless the beam were made of a very high strength steel.
ANSYS Predictions:
As shown in Figures 1& 2 below, qualitatively, contour plots of the stresses
Sigmaxx for a 6 element and 96 element ANSYS model show the trends predicted
by beam theory. The stress is clearly varying with x in the left and right
1/3 of the beam and appears constant in x in the middle 1/3. The symmetry
of the stresses with respect to the location x = L/2 and the antisymmetry
of the stresses with respect to the neutral axis are also apparent. The refined
model appears to be slightly better able to pick up changes in the axial stress
with location along the beam, but the 6 element model does remarkably well.
Figure 1 (Sigma xx for 6 element mesh)
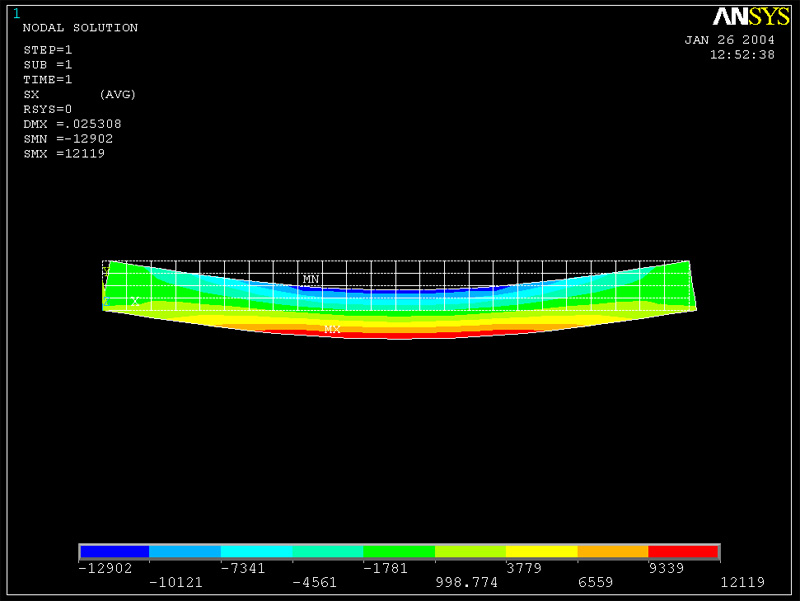
Figure 2 (Sigma xx for 96 element mesh)

Figure 3 (Sigma xx vs. y for cross-section of middle of beam for 6 element mesh)
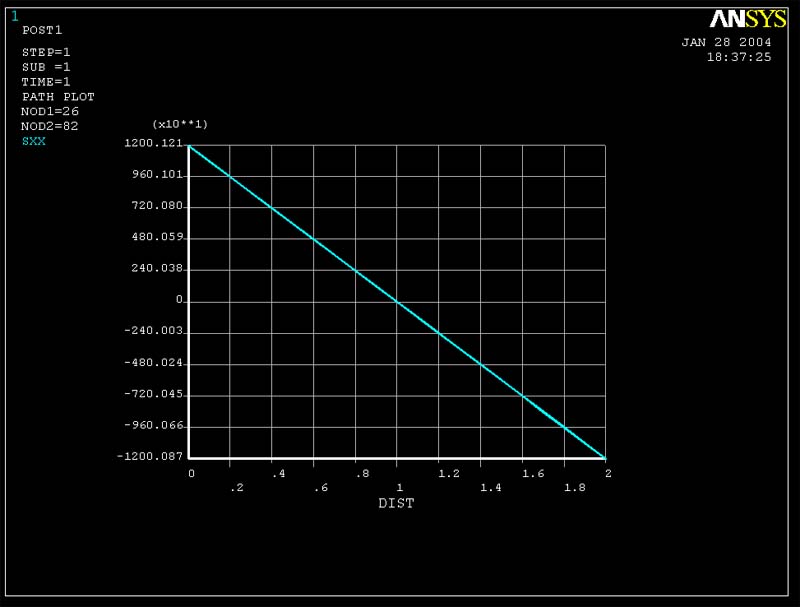
Figure 4 (Sigma xx vs. y for cross-section of middle of beam for 96 element mesh)
Interpretation of the Results:
The 6 element model is able to pick up the bending stress Sigma xx well because (according to beam theory) the stress only varies linearly with y and at most linearly in x. An 8-noded quadratic displacement element (the type you used in your model) is able to model a bilinear variation in sigma xx exactly. As a result, a single quadratic element through the thickness is sufficient for picking up this stress.
The Shear Stress Tauxy:
Beam Theory Predictions:
Beam theory predicts that the stress Tauxy in the center 1/3 of the beam is equal to zero (because the shear force equals zero there). You may also note that this is a symmetry condition. In the left and right 1/3 of the beam, the shear stress is constant in x (because the shear force does not vary in x) and varies quadratically in y (as predicted by the formula Tauxy = VQ/Ib). The maximum stress in this region is given by the formula Taumax = 3V/2A = 750 psi.
ANSYS Predictions:
Plots of Tauxy vs. y obtained at the center of the beam are given in the two figures below. Both models are predicting essentially zero stress at this location. Don't be confused by the auto-scaling that ANSYS applies to the graph. The stress magnitudes are essentially zero.
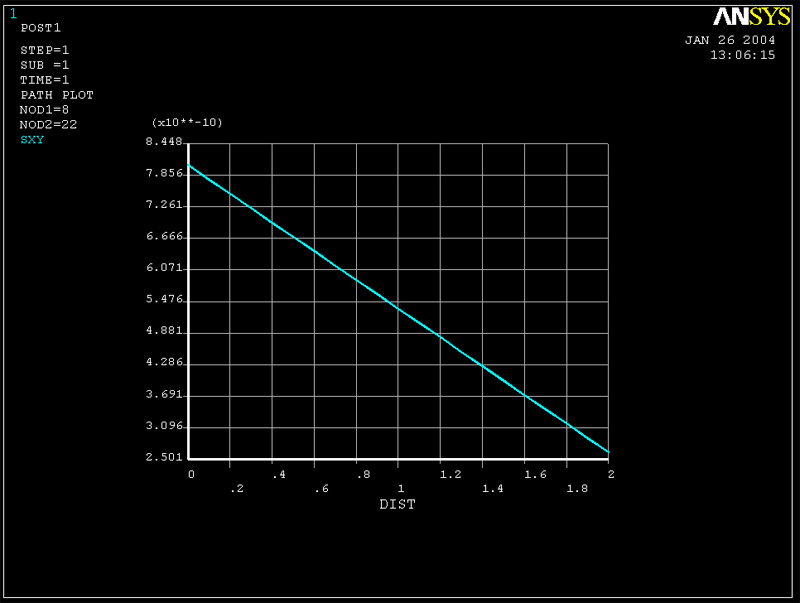
Figure 5 (Tauxy vs. y for cross-section of middle of beam for 6 elemt mesh)
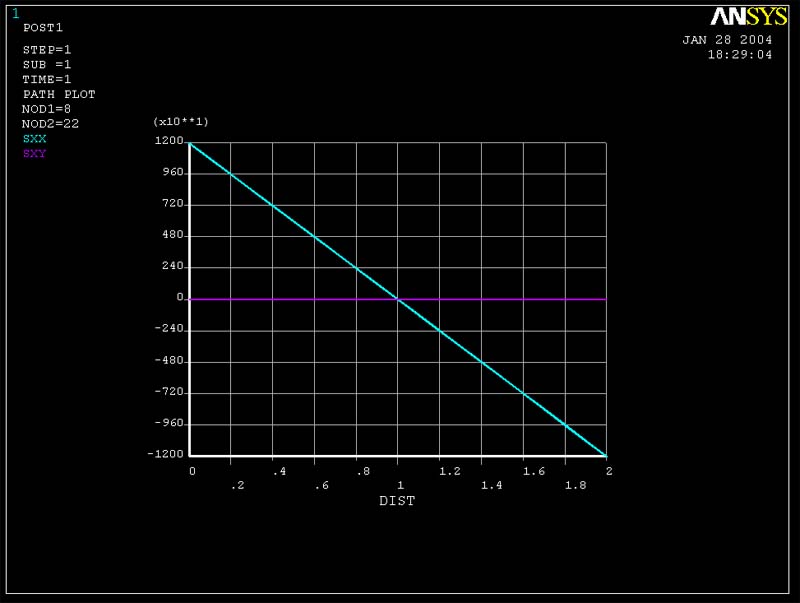
Figure 6 (Sigma xx and Tauxy vs. y for cross-section of middle of beam for 6 element mesh)
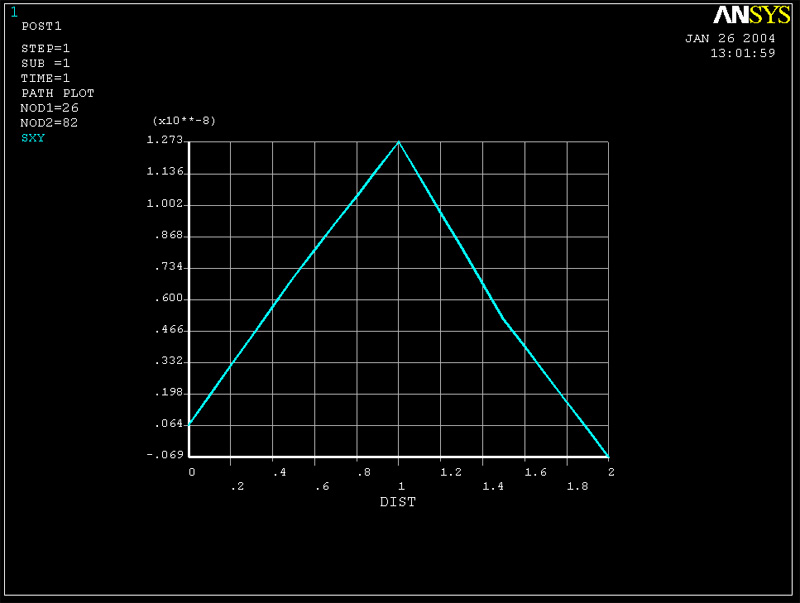
Figure 7 (Tauxy vs. y for cross-section of middle of beam for 96 element mesh)
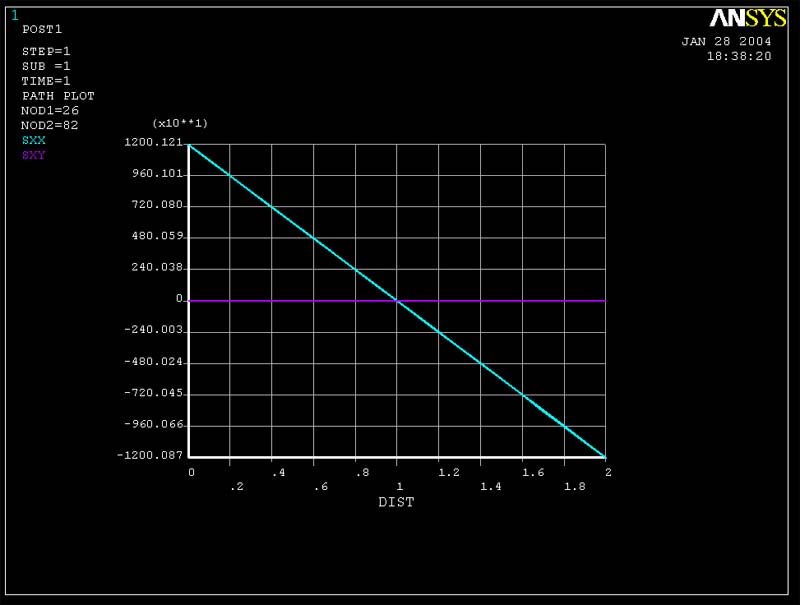
Figure 8 (Sigma xx and Tauxy vs. y for cross-section of middle of beam for 96 element mesh)
Interpretation
of the Results:
The 6 element model cannot pick up the nonzero shear stress Tauxy well. The
8-noded elements you are using are able to model accurately the quadratic
variation (in y) in strain and stress predicted by beam theory. However, in
the 6 element model, the nodes at x = L/6 are part of elements that also have
concentrated loads applied to them. Thus, these elements are also trying to
capture the very complicated behavior near these points. It is likely that
this is the source of error in the 6 element model. More insight concerning
stress concentrations at the load points is given in the next section.
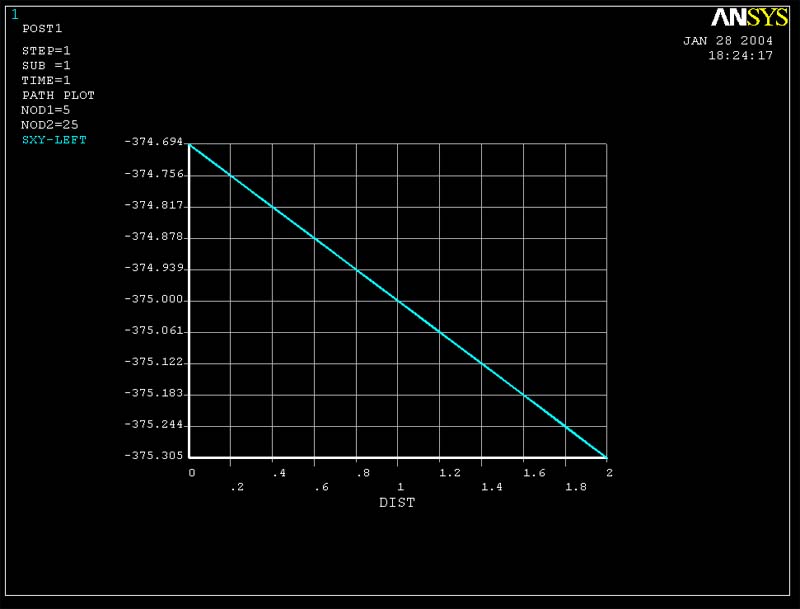
Figure 9(Tauxy vs. y for cross-section at x = L/6 for 6 elements)
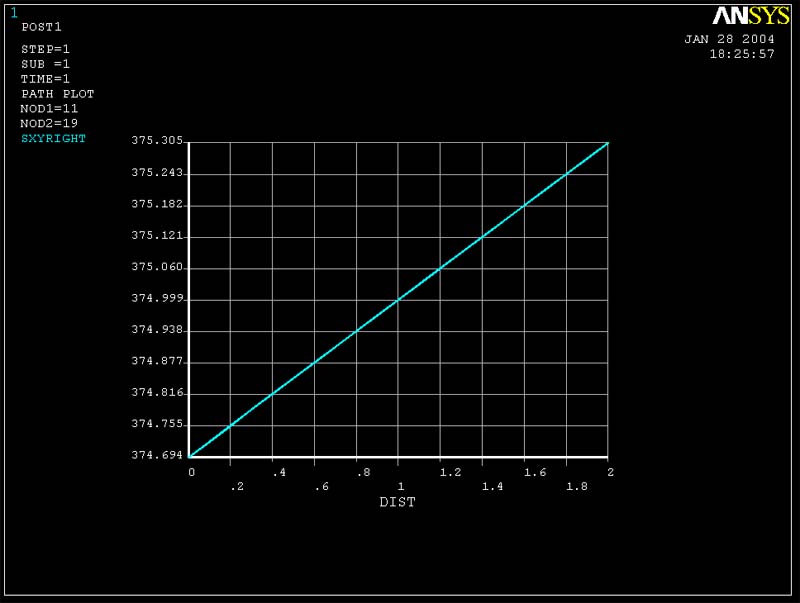
Figure 10 (Tauxy
vs. y for cross-section at x = 5L/6 for 6 elements)
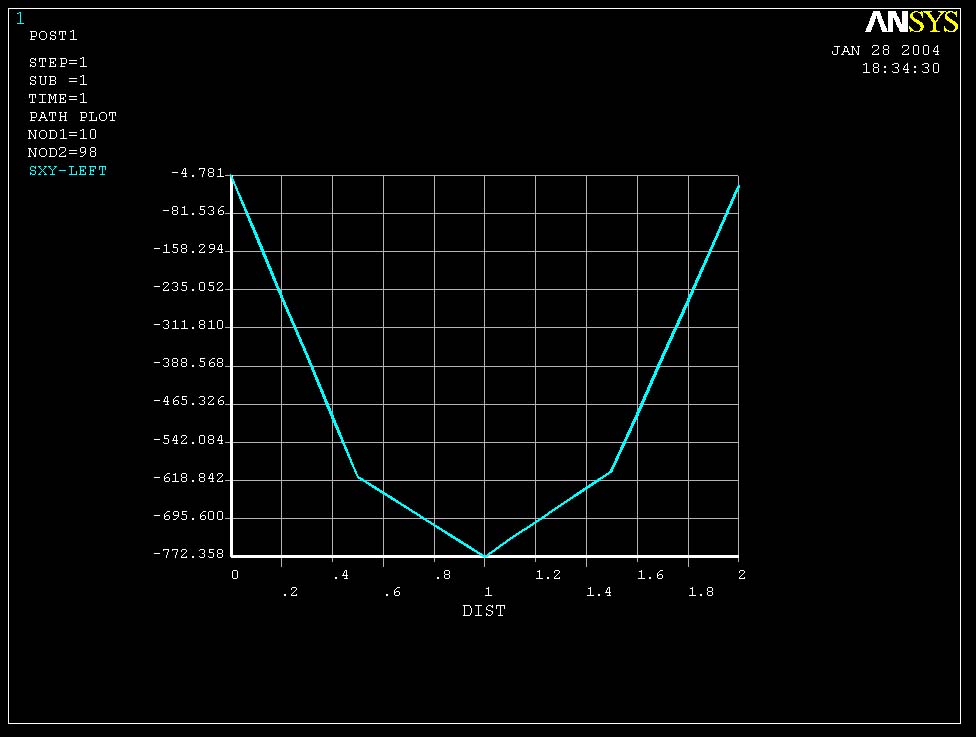
Figure 11 (Tauxy vs. y for cross-section at x = L/6 for 96 elements)
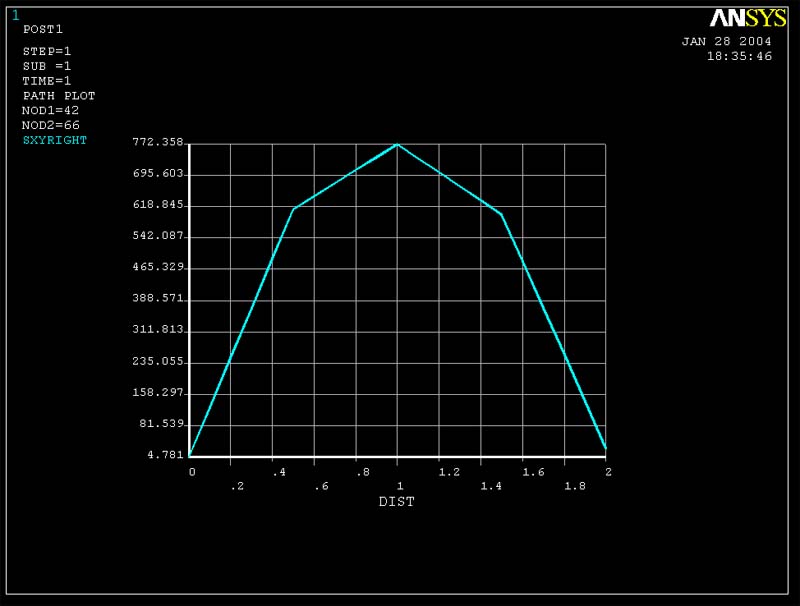
Figure 12(Tauxy vs. y for cross-section at x = 5L/6 for 96 elements)
Effects Not Considered in Beam Theory:
Overall, the problem you have modeled is truly behaves like a beam, except
near the concentrated loads applied at the inner loading points and near the
supports. Near locations where concentrated loads are applied, a full theory
of elasticity solution to this problem will attempt to model the stress concentrations
resulting from the point loads themselves. This can be seen qualitatively
in the contour plot below of the stress Sigmayy in the 96 element model (see
Figure 11). There are clearly stress concentrations at the points of concentrated
load application.
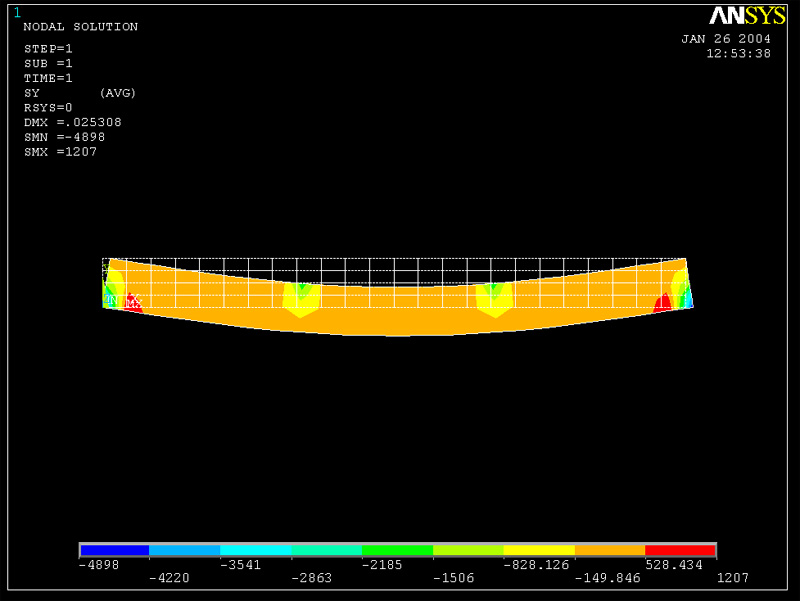
Figure 13(Sigmayy contour plot for 96 element mesh)
Interestingly enough, a full theory of elasticity will predict singular (i.e. INFINTE) stresses at the point of application of a concentrated load. As a result, further mesh refinement will result in stresses at the location of application of a point load to become higher and higher as more elements are added. A more detailed model of contact near such a point is needed to predict stress magnitudes in a real component.
One mistake that finite element modelers make is to not recognize when their model has a singularity in it. They will simply extract a finite stress value at a singular point, obtained with a finite element model having a fixed resolution. They thus predict a large, but finite stress at this point when in fact the answer is, within the limits of their modeling, that the stresses are infinitely large.