
8. Interpreting Your Results
The following section discusses the results from
4 element model and 16 element model of your axially loaded plate. We will compare
those results and see how the resolution of the mesh affects the stresses, strains,
and displacements in the plate. Also we will compare the results we got from
ANSYS with the result calculated by elementary theory for an axially-loaded
member. The results we are going to consider are
1. The Normal
Stress (Sigma xx)
2. The Normal Strain
a) Axial Strain (Strain
xx)
b) Lateral Strain (Strain yy)
3. The Shear Stress (Tau
xy)
4. Displacement of the Neutral
Axis
a) Displacement x
(dx)
b) Displacement y (dy)
The Normal Stress (Sigma xx):
Elementary Theory for an Axially-loaded Member Predictions:
For this problem, the pressure load we applied to the plate
is uniformly distributed over cross section of the plate, and is in tension because
it stretches the plate on both sides. The formula for Normal Stress is: Sigma
xx = P/A , where P is the axial force and A is the cross section area. It is known
that P/A is equal to pressure, so we can conclude that Sigma xx = applied pressure
load = 20,000 psi.
Note that the equation Sigma xx = P/A is valid only if the stress is uniformly
distributed over the cross section. Because when the net load P does not act at
the centroid, bending of the plate will result.
ANSYS Predictions:
Refer to figures 1 through 4 below, it is obviously shown
that the coarse mesh model (4 element model) and the fine mesh model (16 element
model) give the same value for sigma xx (20,000psi), which also matches the predicted
result we got before by applying the elementary theory for an axially-loaded member.
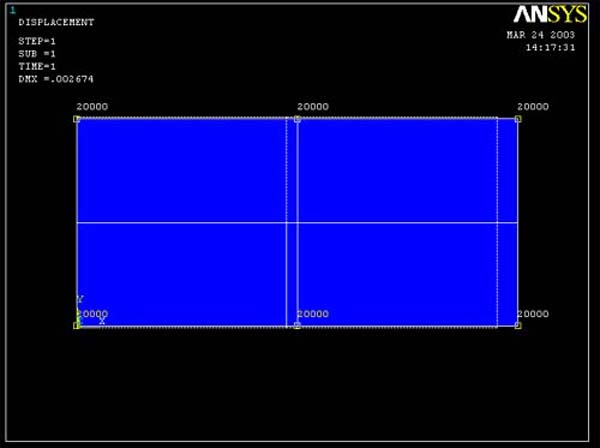
Figure 1 (Query Sigma xx for 4 element model)
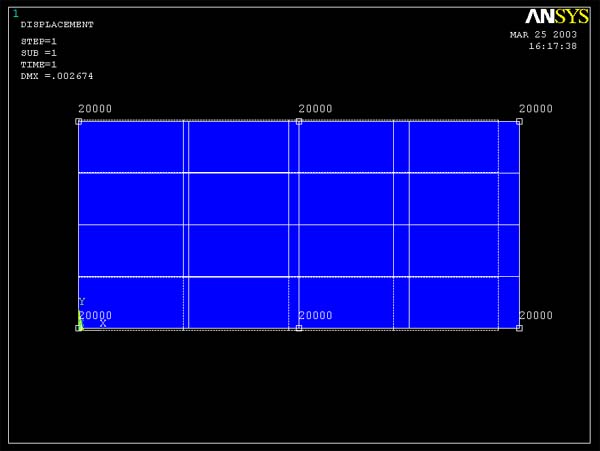
Figure 2 (Query Sigma xx for 16 element model)
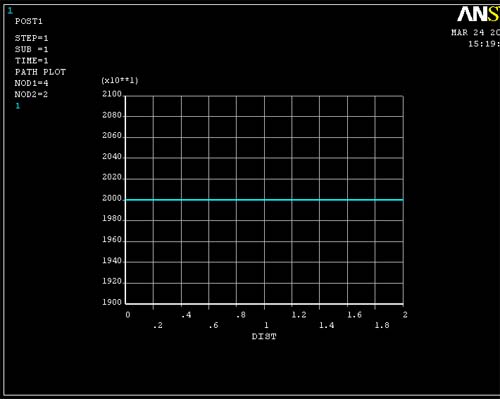
Figure 3 (Sigma xx for 4 element model)
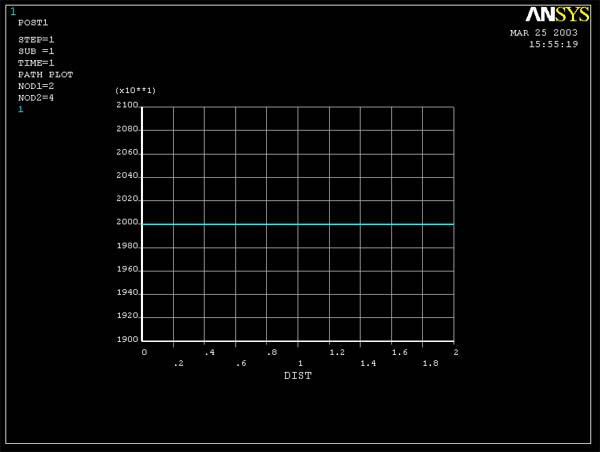
Figure 4 (Sigma xx for 16 element model)
Interpretation of the Results:
By applying a uniform pressure to the ends of the plate
we induce a uniform tensile stress at all cross sections along the length of the
plate. Therefore, according to figure 1 and 2, when we query the stress xx at
different points, ANSYS gives the same value for stress xx. Figure 3 and 4 show
that stress xx is constant in the x direction. Since the 4 element model and 16
element model evidently give the same value of sigma xx, we can conclude that
the element resolution does not matter on this particular problem.
The Normal Strain:
a) Axial Strain (Strain xx)
Elementary Theory for an Axially-loaded Member Predictions:
The linear relationship between stress and strain for a
bar in simple tension or compression is expressed by the equation which is commonly
known as Hooke's law : Sigma xx = E * Axial Strain, where E is a constant of proportionality
known as the modulus of elasticity for the material. For steel, E = 30,000 ksi.
Using the value of Sigma xx we calculated before, we get
Axial Strain = 20,000/30,000,000 = 6.667E-4
ANSYS Predictions:
When query strain xx, ANSYS gives the results as shown in
figure 5 and 6. As for stress xx, the coarse mesh model (4 element model) and
the fine mesh model (16 element model) give the same value for strain xx (0.667E-3)
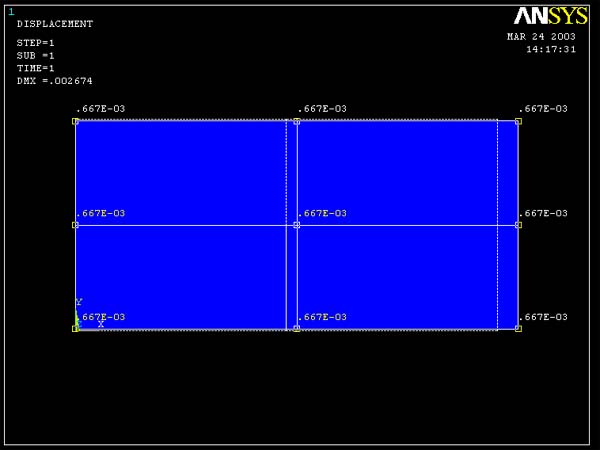
Figure 5 (Query Axial Strain for 4 element model)
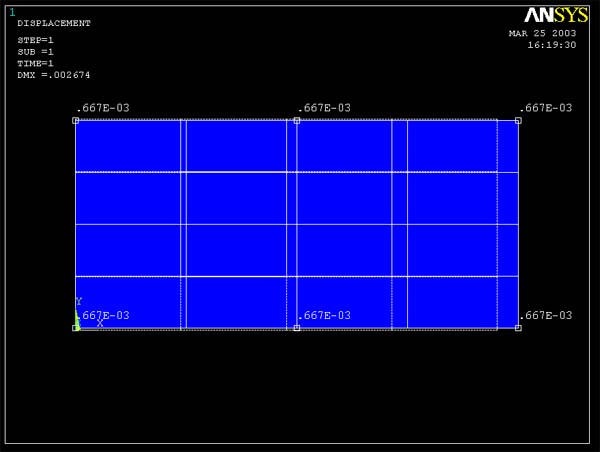
Figure 6 (Query Axial Strain for 16 element model)
Interpretation
of the Results:
The modulus of elasticity or Young's modulus(E) is the
slope of the stress-strain diagram in the linearly elastic region. Because we
assume linear elastic behavior in our ANSYS analysis, we simply get Axial strain
= Sigma xx/E at all nodal location.
b) Lateral Strain (Strain yy)
Elementary Theory for an Axially-loaded Member Predictions:
When a prismatic bar is loaded in tension, the axial elongation
is accompanied by lateral contraction. The lateral strain at any point in a
bar is usually proportional to the axial strain at the same point if the material
is linearly elastic, and the ratio of the lateral strain to the axial strain
is known as Poisson's ratio (n). Thus, n
= -lateral strain/axial strain. The negative sign is counted because when the
bar is in tension the axial strain is positive while the lateral strain is negative
(because the width of the bar decreases). In the same sense, for compression
the bar becoming shorter (negative axial strain) while getting wider (positive
lateral strain)
For this problem, n of the steel is 0.3 and strain
xx is known from the previous analysis = 0.667E-3. Therefore, the value of lateral
strain (Strain yy) is calculated and equals to -0.3*6.667E-4 = -2.0001E-4.The
negative sign indicates that the bar's width decreases.
ANSYS Predictions:
Figure 7 and 8 show ANSYS predictions on the value of
strain yy. Both 4 element model and 16 element model give the same result for
the strain yy (-0.200E-3) This result is the same as within 3 digits the calculated
value.
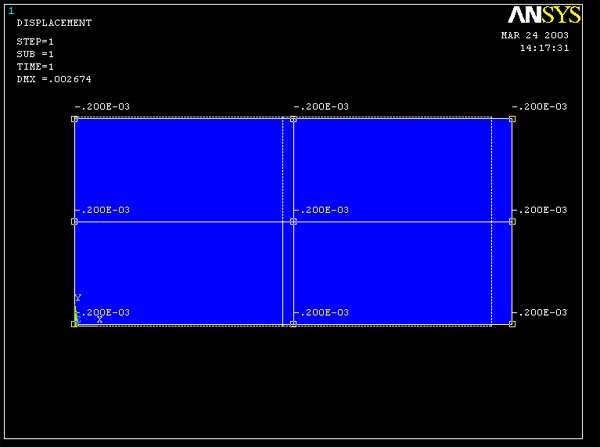
Figure 7 (Query Lateral Strain for 4 element model)
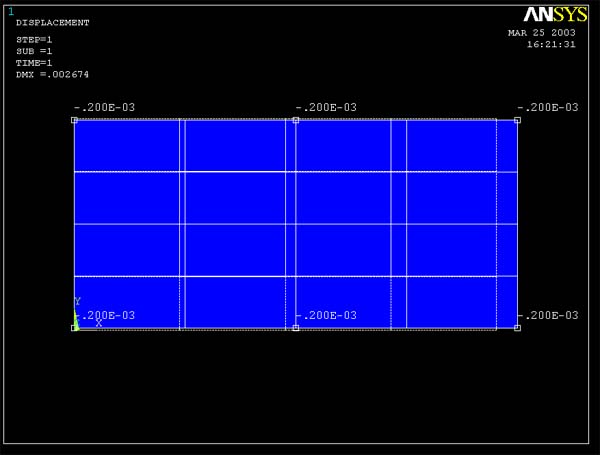
Figure 8 (Query Lateral Strain for 16 element model)
Interpretation of the Results:
According to ANSYS, the lateral strain is constant throughout the entire plate.
This is as expected and both the coarse and fine meshes are able to give the exact
answer for this problem.
The Shear Stress (Tau xy):
Elementary
Theory for an Axially-loaded Member Predictions:
By definition, Shear Stress is the stress that acts tangential
to the surface of the material. As for normal stresses, and shear stresses have
units of force per unit of area. For this problem Tau xy is zero.
ANSYS Predictions:
Plots of Tauxy vs. y obtained at the right end of the plate
are given in figure 9 and 10. Both models are predicting essentially zero shear
stress at this location. Don't be confused by the auto-scaling that ANSYS applies
to the graph. The stress magnitudes are essentially zero.
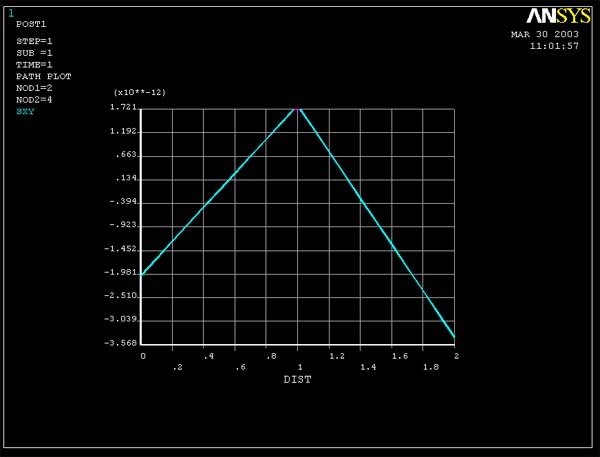
Figure 9 (Tauxy vs. y for cross-section at the right end of plate for 4 element
model)
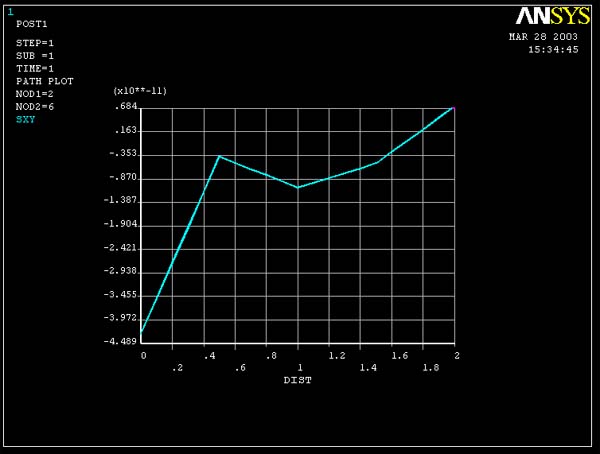
Figure 10 (Tauxy vs. y for cross-section at the right end of plate for 16 element
model)
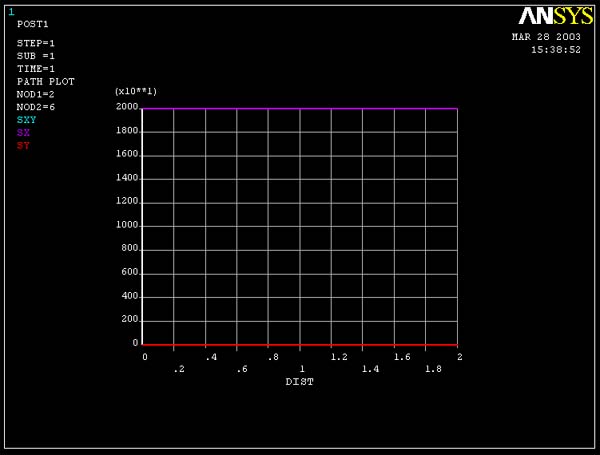
Figure
11 compares Shear stress, Stress xx and Stress yy on the same plot. It is clearly
shown here that Shear Stress is, in fact, zero.
Note: To
plot multiple graphs on the same coordinate, go back to Plot
Path Items command
PLOT
PATH ITEMS -> On Graph
In
the PATH PLOT OF PATH ITEMS window, highlight
SX, SY and
SXY.
Note
that depending on which algorithm the software usesin solving, the calculated
values close to zero can differ in many ways.
Interpretation
of the Results:
As we expected, the results obtained from hand calculations
and from ANSYS show that the shear stress across the cross section area of the
plate is essentially zero.
Displacements :
a) Displacement x (dx)
Elementary Theory for an Axially-loaded Member Predictions:
To determine the displacement of the neutral axis, we
can use the concept of strain. The definition of Strain is elongation per unit
length, which is expressed by : e = d/L , where e is strain, d is elongation
or stretching of the the material, and L is the length from the origin. Since
L is known, and strain is also known from the previous analysis, we can use
this expression to find the displacement. And since we first consider the displacement
in x direction, the value of strain used in the calculation is Axial Strain
(Strain xx). Calculate the elongation at different points along the length of
the bar, for example at L = 0, 2, 4 inches.
L=0; dx = 0* 6.667E-4 = 0.00 in.
L=2; dx = 2* 6.667E-4 = 0.0013334 in.
L=4; dx = 4* 6.667E-4 = 0.0026668 in.
ANSYS Predictions:
Figure 13 and 14 show the ANSYS results for the displacement
x. Both the 4 element model and 16 element model give pretty much the same values
for displacement at the same locations, that is
L=2; dx = 0.001333 in.
L=2; dx = 0.001333 in.
The results at L=0 for both cases are slightly different. For 4 element model
dx = 0.271E-17 in., but for 16 element model dx = 0.412E-17 in. However, both
numbers are quite small and essentially zero.
Note:
The red circle marks the maximum displacement in x direction.
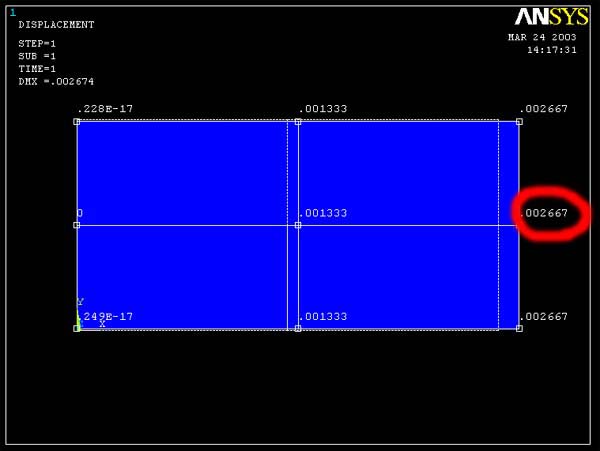
Figure 13 (Query Displacement x for 4 element model)
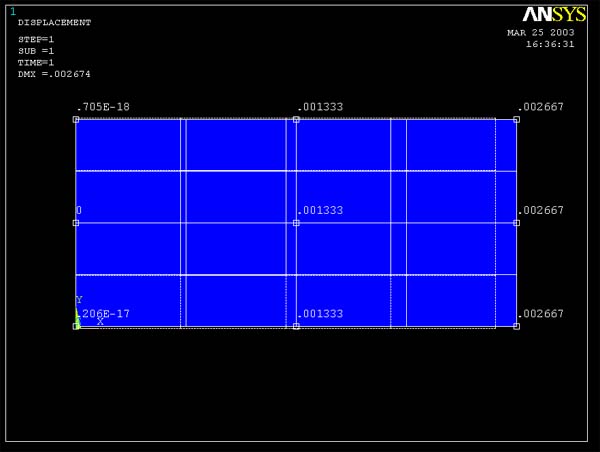
Figure 14 (Query Displacement x for 16 element model)
b) Displacement
y (dy)
Elementary Theory for an Axially-loaded Member Predictions:
Use the same equation e = d/L to determine the displacement
in y direction, but this time the value of Lateral Strain is used for e. Also
use different values of L along the height of the bar to locate the points of
interest. For example, L = -1, 0, 1
L=-1; dx = -1* -2.0001E-4 = 2.0001E-4 in.
L=0; dx = 0* -2.0001E-4 = 0.00 in.
L=1; dx = 1* -2.0001E-4 = -2.0001E-4 in.
ANSYS Predictions:
Figure 15 and 16 show ANSYS results for displacement y.
It is shown that 4 element model and 16 element model give the same results.
Displacement at the points along the x-axis are zero (-.325E-18 and .240E-17
are very small and essentially zero) The maximum displacement in y direction
is at 1 inch above and below the x-axis and has magnitude of 2.00E-3 in.The
negative and positive signs indicate the direction of the displacement. Thus,
negative value at the position 1 in. above the x-axis and positive value at
1 in. below the x-axis imply that the plate is shortening in y direction.
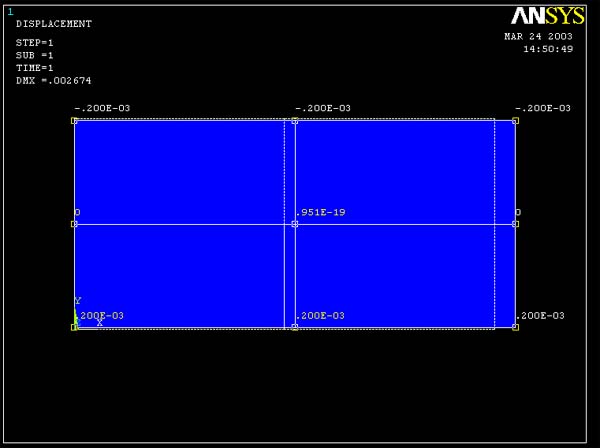
Figure 15 (Query Displacement y for 4 element model)
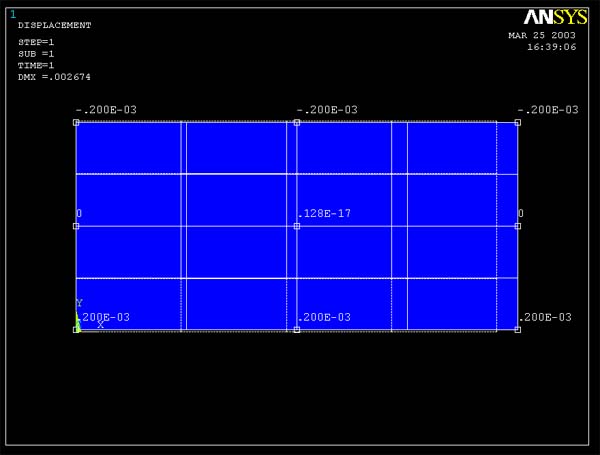
Figure 16 (Query Displacement y for 16 element model)
Interpretation of the Results:
Usually we know by inspection that when the bar is in
tension, it is stretched in x direction, and as a result, it is shortened in
the y direction. According to the analysis above and the figures shown, the
results are as we expected.
Note : We also can define the displacement using another equation combining
the basic relationship between stress and strain : d = PL/EA This equation shows
that the elongation of a prismatic bar is directly proportional to the load
P, the length L, and inversely proportional to the modulus of elasticity E and
the cross-sectional area A. For this equation, the sign convention is important.
The elongation is usually taken as positive and shortening as negative.
Overall, we have seen that mesh resolution is not an issue for this problem.
For some simple loading geometries, it is possible for ANSYS to give exact answers
for a small number of elements. This is one of those cases. In fact, you would
have obtained the same stress and strain results if you had modeled the plate
with a signle 4-noded rectangular element.
This type of behavior is not typical, however. In more complex engineering analysis,
finite element results will approach exact values only in the limit as a large
number of elements are used. Use of mesh resolution that yields sufficient accuracy.
Without consuming large amounts of computing and user time is a critical issue
in finite element modeling.
A Note on Linearity:
The ANSYS model you have constructed assumes linear elastic behavior. Because
of this, the stresses, strains and displacements scale with the applied load.
As a result, if you need to obtain the stresses, strains and displacements for
a different applied load, you can simply re-scale the results you already have.
A new ANSYS run is not needed. For instance, if the applied load were 10,000
lb, the stresses, strains and displacements would be one-half of those obtained
for 20,000 lb.