 tkinter Canvas: initialization and drawing rectangles on canvas
When you are done with this lab, you should be able to do the following:
In order to draw in Python, you need to create a Canvas which you can do as follows:
import tkinter
# Remember, this means tkinter.___ to call functions and objects
from tkinter import Canvas
# Canvas object only can be called by itself.

# First, create the window where our canvas will be displayed
window = tkinter.Tk()

#Then, create our canvas and pack it into the display window
c = Canvas(window, width=<width>, height=<height>)
c.pack()
Where you replace <width> and <height> with appropriate values. The width and height are expressed as a number of pixels.
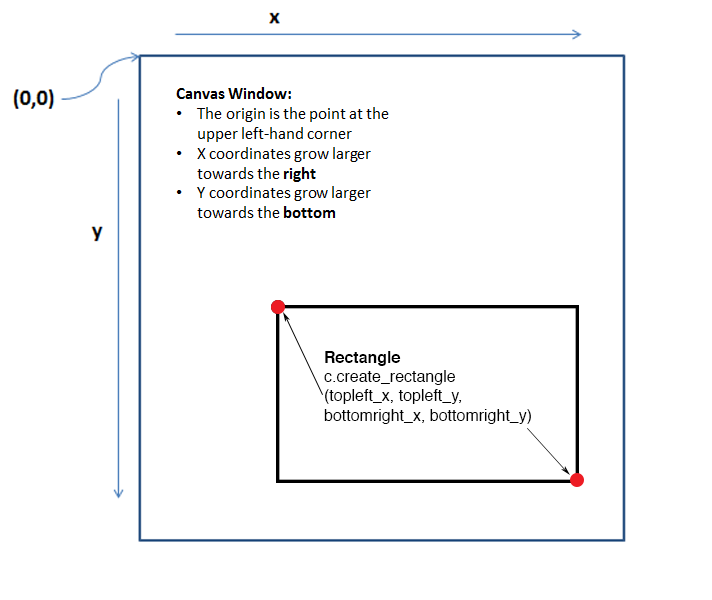
See Quick Guide to tkinter.Canvas for information about drawing graphics. Just as a quick review, in a window, the coordinate system is upside down from what you might expect mathematically. The x coordinates increase from left to right, but the y coordinates increase from top to bottom. So the origin (0,0) is in the top left corner of the window.
To draw a rectangle using the Canvas, you need to create a new Rectangle and supply the coordinates of the top left and bottom right corners along with additional optional parameters:
c.create_rectangle(topleft_x, topleft_y, bottomright_x, bottomright_y, optional parameter(s))
For example, to create a red square with a blue border that has a top left coordinate of (100,100) and bottom right coordinate of (110, 110), you would execute:
c.create_rectangle(100, 100, 110, 110, fill ="red", outline="blue")
tkinter Canvas: initialization and drawing rectangles on canvas
# Imports and initalization
import tkinter
from tkinter import Canvas

window = tkinter.Tk()
c = Canvas(window, width = 300, height = 500)
c.pack()

# Drawing functions.
c.create_rectangle(75, 150, 105, 250)
c.create_rectangle(105, 250, 165, 450)
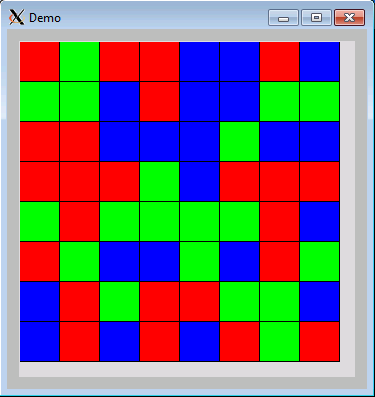
In demo.py Write a Python function that creates a window of size 320 by 320 and draws a grid of 8 by 8 squares, each of size 40 by 40 pixels, and colored a random color of red, green or blue. We will seed the random number generator with the number 15110 to generate the same sequence of pseudorandom numbers each time the function is called.
In the file random_boxes.py, write a Python function random_boxes() that creates a window of size 320 by 320 and draws a 40 by 40 grid of 8 by 8 squares, each colored a random color from black, white, yellow, cyan, and magenta. This is a simple activity that EVERYONE should be able to finish. If you haven't finished, please ask a CA to help you.
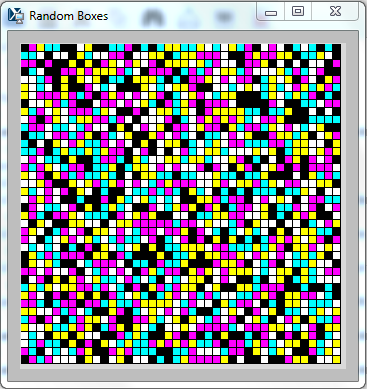
Note: Your results may vary since we are using a random number generator and we do not expect you to seed the random number generator to fix the sequence of numbers that it will generate.
| 
| 
| 
| 
|
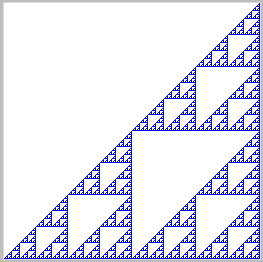
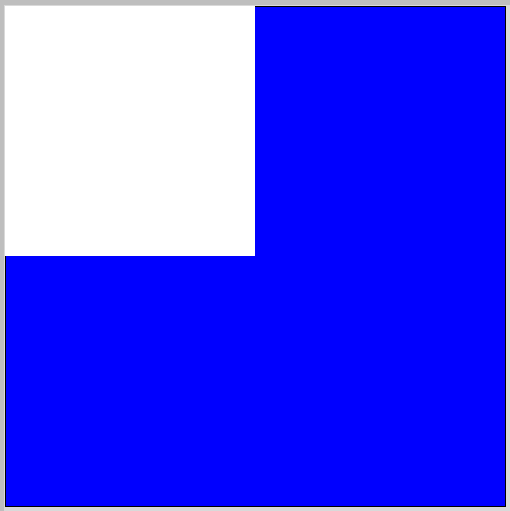
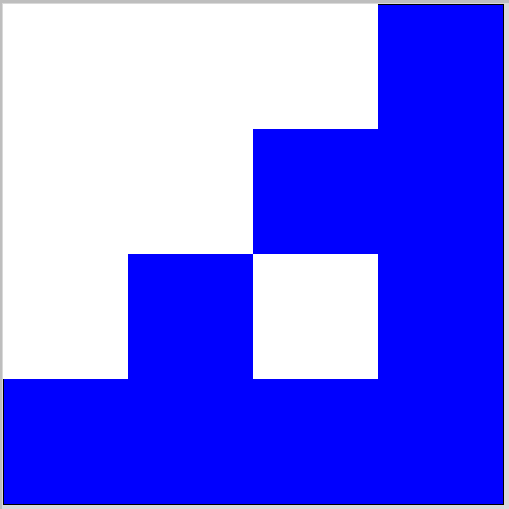
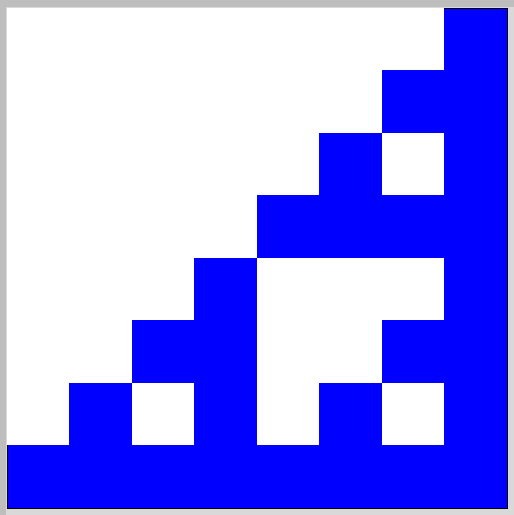
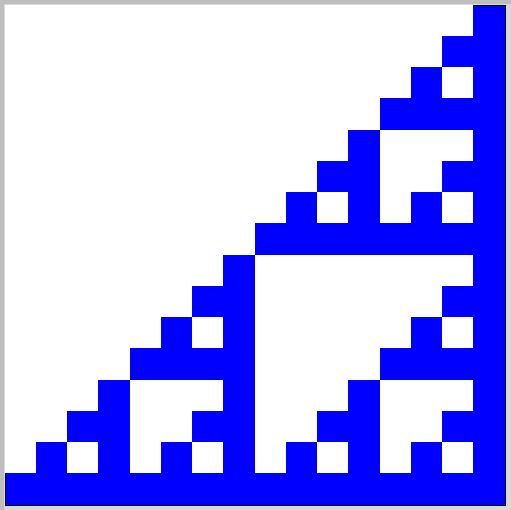
The image above is a Sierpinski's Triangle (albeit, rotated and with a different angle than the canonical form). It is a fractal; that is, it is "a rough or fragmented geometric shape that can be split into parts, each of which is (at least approximately) a reduced-size copy of the whole." In this case, you will notice that, if you look at the lower-right corner, it looks the same (down to the level of one pixel) at different levels of magnification.
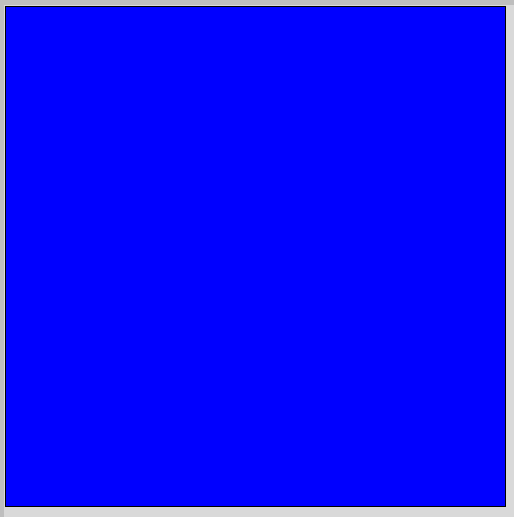
Starting with a blue filled-in square, this Sierpinski's Triangle can be produced with the following procedure:
Download the file triangle.py and fill in the missing parts to draw Sierpinksi's triangle. You only need to supply the parameters to the recursive procedure calls. You should not add any other additional code. If you do this correctly, you will be able to reproduce the image shown above, by calling start_triangle(256, "blue") after loading your source file. Remember that the coordinate system has the origin in the top left corner of the screen!
import tkinter
from tkinter import Canvas


# This function initializes a Canvas and display window,
# then calls the recursive function triangle to do all the work
def start_triangle(size, color):
    window = tkinter.Tk()
    c = Canvas(window, width = size, height = size)
    c.pack()
    c.create_rectangle(1, 1, size + 1, size + 1, fill=color)
    triangle(c, 0, 0, size)


# draw a Sierpinski triangle with top left at (x,y) and
# with height and width of size
def triangle(c, x, y, size):
    # stop when the size gets smaller than 2
    # (since we can't subdivide a pixel)
    if size < 2:
        return None
    half = size // 2
    draw_square(c, x, y, half)

    # recursively repeat the triangle
    # for each of the other three quadrants
    triangle(c,         ,          ,          ) # Fill in the missing parameters of this call
    triangle(c,         ,          ,          ) # Fill in the missing parameters of this call
    triangle(c,         ,          ,          ) # Fill in the missing parameters of this call


def draw_square(c, x, y, half):
    # draw a square in the upper left quadrant
    c.create_rectangle(1 + x,
                       1 + y,
                       1 + x + half,
                       1 + y + half, width=0, fill="white")