Thermal Test #1: 2D Heat
Conduction within a Solid
Introduction:
In this example you
will test your 2D heat transfer skills by modeling an object subjected
to varying boundary conditions. Using ANSYS will allow you to output
the temperature distribution in an extremely simple and accurate way.
Problem
Description:
·
We
assume that our pan is circular made entirely of steel.
·
All
units are S.I.
·
Boundary Conditions:
1) The
top and sides have temperature boundary layers of 100 C.
2) The bottom has a temperature boundary layer of 200
C due to the fire .
·
Material Properties: (Steel and Fish)
kFish
= 0.5 W/m K
KSteel
= 20 W/m K
·
Objective:
To determine the nodal temperature distribution and create a contour
plot of the temperature gradient within the water.
·
Figure:
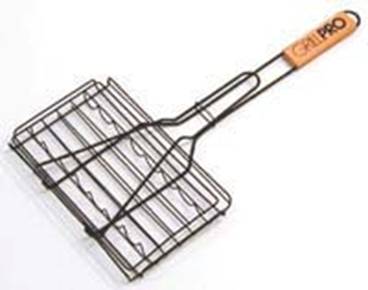
The GrillPro Fish
Grilling Basket
Dimensions:
Outer
Layer of the Basket: 30 cm wide, 5 cm tall
The basket is
0.005m thick and the fish is assumed to fill the entire area inside the
basket with no contact resistance.
·
Create
the larger area defining the steel bars forming the metal section of the
“Fish Basket”, then create the area defining
the fish within the basket.
·
Overlap
the two areas so that there is no contact resistance between them.
·
Define
the Material Properties of the Air Element (Thermal Conductivity
for each layer needs to be set.)
·
Define
the Element Properties as two Quad 8node 77 thermal solids.
·
Mesh
the figure with a mesh size of 0.01 on all the lines defining the
basket and the fish cross-section within it. (Be sure to mesh each
material separately such that the material properties are set
independently of each other.)
·
Apply
Boundary Conditions (Constant temperatures on all 4 sizes.)
·
Solve
·
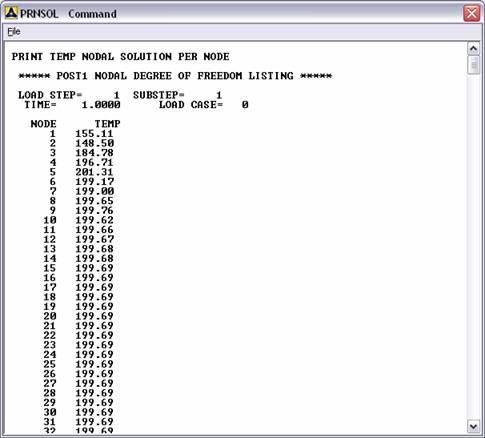
List
the nodal temperature distribution in the X and Y directions, below is
the answer you should obtain.
·
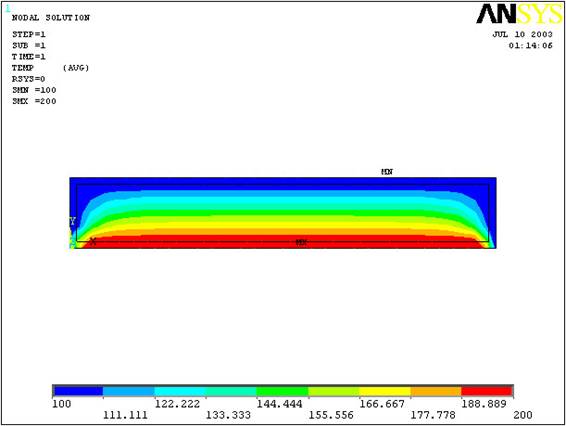
Plot
the nodal temperature distribution in the X and Y directions, below is
the answer you should obtain:
(The
listed nodal temperatures should be as follows:)
(The
temperature distribution will look like this:)