6B. Contour Plots
Directions are shown here to get contour plot
of the bending stress, Sigma xx. It should be obvious how to get a contour
plot of other relevant stress components.
MAIN MENU -> General
Postproc
GENERAL POSTPROC -> Plot
Results
PLOT
RESULTS -> Contour Plot-nodal solu...
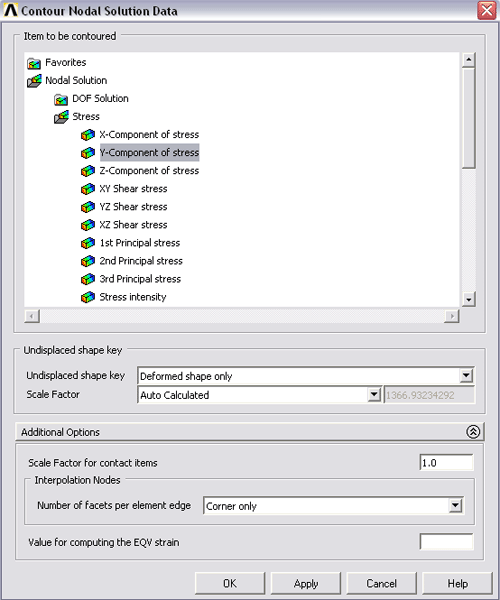
CONTOUR NODAL SOLUTION DATA -> Highlight Stress
CONTOUR NODAL SOLUTION DATA -> Highlight Y-direction SY
CONTOUR NODAL SOLUTION DATA -> OK


You can click on Def shape only or Def+undeforme. Then click OK.
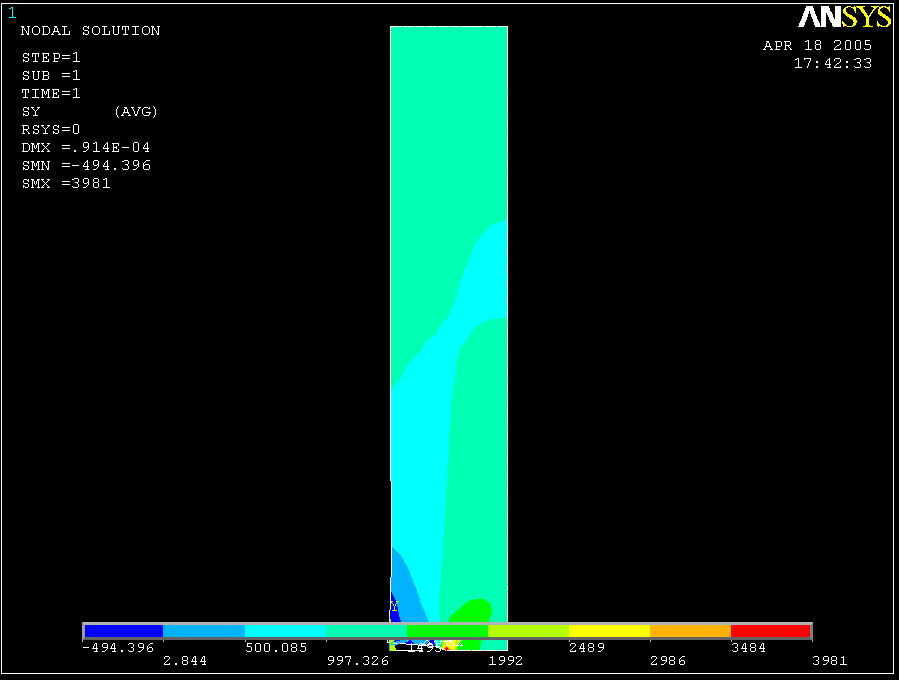
This displays the results data as contoured stress lines across the model.
You should now have a color representation of the stress of the plate similar
to the Figure below.

Close PLOT RESULTS window.
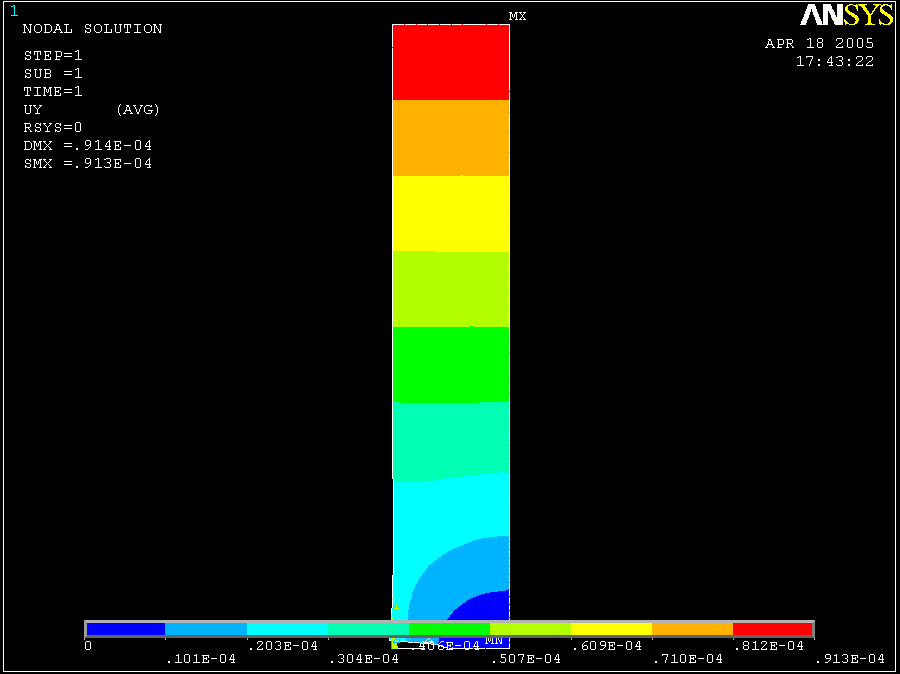
Also you can make a contour plot of UY(displacement in Y direction) as well. Here
is the result.
