
8. Interpreting Your Results
In this step, we will compare the results of the coarse-meshed plate with those
of the fine-meshed plate. The results we are going to consider are :
1. Contour
Plots of the Stress xx: Maximum and Minimum Stresses xx
2. Contour Plots of the Mises Equivalent
Stress : Relate to Von Mises Yield Criterion
3. Stress xx across the cross section (At
x=0)
4. Stress yy across the cross section (At
x=0)
Maximum
and Minimum Stresses xx :
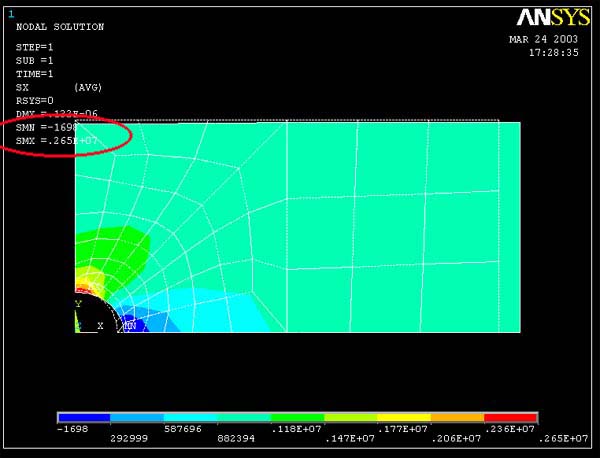
Result of free mesh (coarse) model :
 |
<---
Contour Plot of Stress xx
Maximum Stress xx = 0.265E+7 Pa
Minimum Stress xx = -1698 Pa |
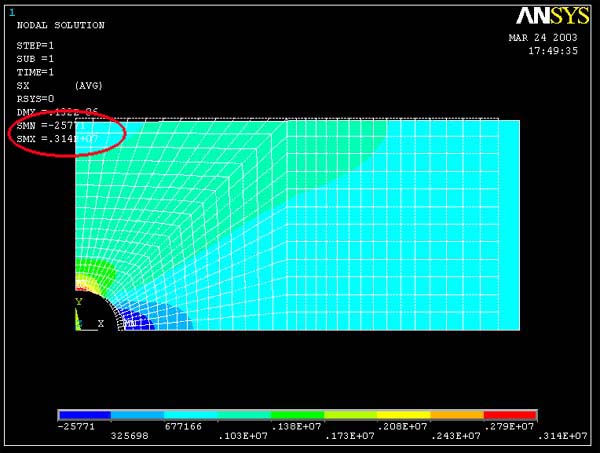
Result of mapped mesh (refined) model :
 |
<---
Contour Plot of Stress xx
Maximum Stress xx = 0.314E+7 Pa
Minimum Stress xx = -25771 Pa |
Interpretation of the Results:
1. As shown in both figures above, the top point of the
hole (The red area) has positive (tensile) stress, while the point on the right
edge of the hole has a compressive stress. This is consistent with what is seen
in the closed-form solution for a hole in an infinitely large plate under far-field
uniform tension. Note that the dash lines represent undeformed shape of the plate.
2. With higher mesh resolution, it is clear that the stress contour lines are
smoother.
3. According to The
Stress-concentration factor chart of a finite-width plate with a circular hole
(Peterson, 1974), K = 3.14, where K = Stress_max/P, where P = Pressure
Load and a/w = 0.2. The stress-concentration factors K for both cases obtained
using maximum stresses obtained from the contour plots are:
K_free = 2.65
K_map = 3.14
From these results, it is clear that the higher mesh resolution gives more accurate
results.
Von Mises Equivalent Stress :
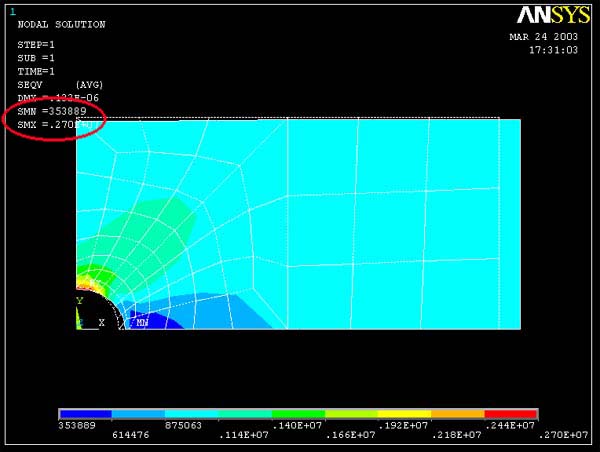
Result of free mesh (coarse) model :
 |
<---
Contour plot of Mises Equivalent Stress
Maximum SEQV = 0.270E+7 Pa
|
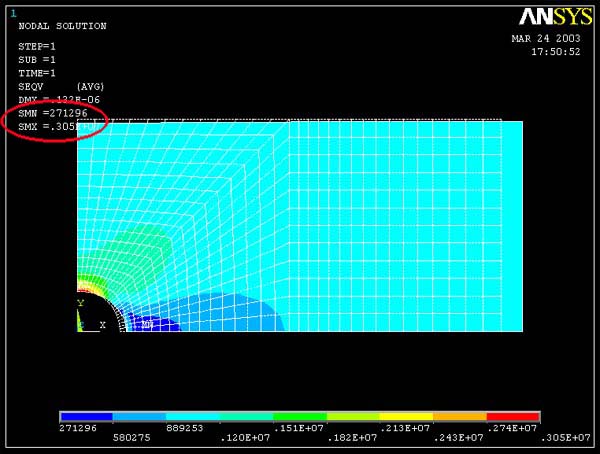
Result of mapped mesh (refined) model :
 |
<---
Mises Equivalent Stress
Maximum SEQV = 0.305E+7 Pa
|
Interpretation of the Results:
1. As with the stress xx, with higher mesh resolution, the
lines separating the Von Mises Stress contours are smoother.
2. In each case, the maximum Von Mises Stress occurs at the edge of the hole as
expected. At this point, the stress state is uniaxial, so that the Von Mises Stress
equals the stress xx. The differences between the Von Mises Stress and the stress
xx in the FEA models is due to the models not precisely picking up the traction-free
boundary condition at the hole boundary.
3. In applying the Von Mises Yield criterion, yielding is predicted to occur when
Mises Equivalent Stress(maximum) = Yield Stress.
Yield Stress_free = 0.270E+7 Pa
Yield Stress_map = 0.305E+7 Pa
This for a yield stress of 350 MPa, initial yielding will occur when the applied
load equals :
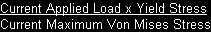
=115 MPa
4.
Note also that the initial yielded zone near the top edge of the hole will look
like the Von Mises contour lines. There will be some difference, though, because
an actual yielded plate will experience some load redistribution due to yielding.
The only way to precisely track the boundary between yielded and unyielded material
as the load is increased is to perform a more complicated elastic-plastic analysis.
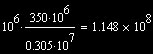
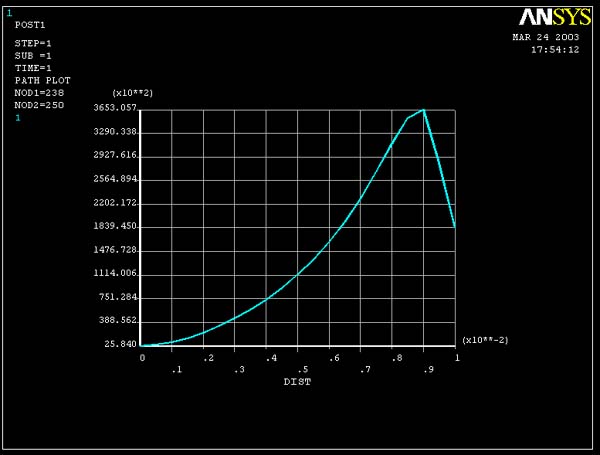
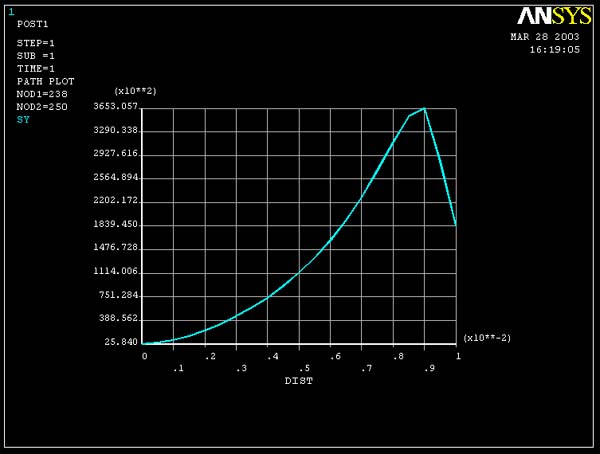
Stress
xx across the cross section :
Result of free mesh (coarse) model :
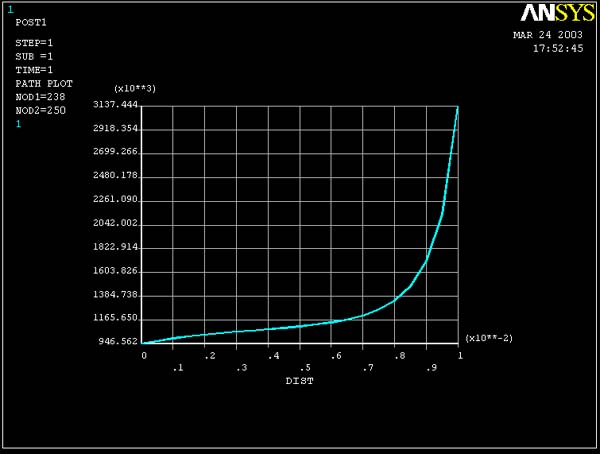
Result of mapped mesh (refined) model :
Interpretation of the Results:
1. With higher mesh resolution, the graphed line is smoother
and the maximum value is larger.
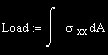
2. The average stress xx across the cross section can be calculated by using the
following formula :
 |
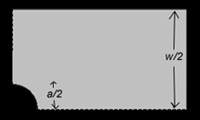
Where
P = Pressure Load
w = Width of the plate
a = Diameter of the hole |
 |
With
values P=1000000 Pa, w = 0.025, a = 0.005, The average Stress is 1,250,000 Pa.
This is also the "average" stress in the plots of the stress xx VS y.
The effect of the hole is to elevate the stress to a value above the average for
locations near the hole, and to reduce the stress to a value below the average
for locations away from the hole. Another way of thinking of this is that the
area under the stress xx VS y curve is the total load carried by the unit-thickness
plate, i.e.
For a given applied load, introducing a stress concentration simply changes the
distribution of the stress xx, but the area under the curve is the same.
Stress yy across the cross section :
Result of free mesh (coarse) model :
Result of mapped mesh (refined) model :
Interpretation of the Results:
1. As for the stress xx, with higher mesh resolution, the
graphed lines of the stress yy is smoother.
2. From your knowledge of boundary conditions, you know that the stress yy is
zero at the edge of the plate and at the edge of the hole. The FEA solution will
capture this boundary condition only in the limit of a highly refined mesh. You
can see that the refined mesh is doing a better job at capturing the traction-free
boundary condition at both edges. Although the refined model is still showing
significant stress yy at the hole boundary, this discrepancy does not seem to
be significantly affecting values of the stress xx or the Von Mises Equivalent
Stress.