6D. Graph Stresses for a Cross Section of the Beam
MAIN MENU -> General
Postproc
GENERAL POSTPROC -> Path
Operations
PATH
OPERATIONS -> Define Path-By Nodes
DEFINE PATH -> Pick 2 points with the left mouse button on the figure,
one which is on bottom of the beam at x=12 in, and the other which is on the
top of the beam at x=12 in.
BY NODES -> Click APPLY
In the "Define Path Name" box, type the name of the path: Path1,
click OK.
Close the window.
PATH OPERATIONS -> Map Onto Path
MAP RESULTS ITEMS ONTO PATH -> Highlight
Stress
MAP RESULTS ITEMS ONTO PATH ->
Highlight X-Direction SX or whichever stress component is relevant.
MAP RESULTS ITEMS ONTO PATH -> OK
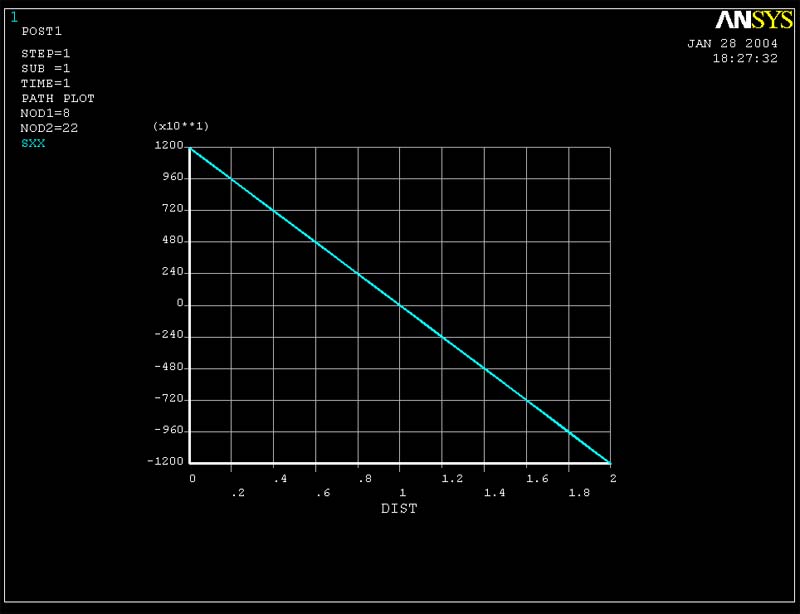
PATH OPERATIONS -> Plot Path Items -On Graph
PATH PLOT OF PATH ITEMS -> Highlight
SX
PATH PLOT OF PATH ITEMS -> OK
A graph of the stresses along the chosen path will appear as shown in the
figure below.
You can also get plots of Sigma yy vs. y at x=12 in and tau xy at x=4 in by
following steps similar to those listed above. Once this is done you can compare
the data to the solutions you expect from beam theory.