6A. Deformed Shape Plot and Extracting Nodal Values
In this step, we are going to obtain the deformed shape plot to see how the displacement boundary conditions and the applied load affect the plate.
MAIN MENU -> General Postproc
GENERAL POSTPROC -> Plot Results
PLOT RESULTS -> Deformed shape
PLOT DEFORMED SHAPE -> Def + undeformed
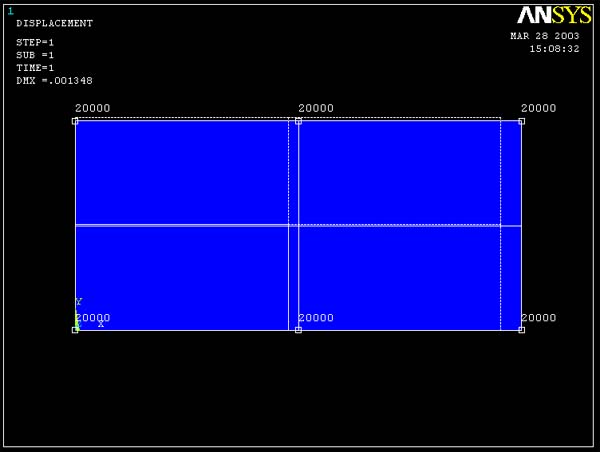
A blue deformed quarter plate should now appear on the ANSYS Graphics window. The dashed shape represents the undeformed quarter plate.

It is clear that the plate has deformed as expected, with displacements constrained on the left and bottom edges in keeping with the applied symmetry boundary conditions.
You can now query stress, strain and displacement values directly off of your deformed mesh plot.
MAIN MENU -> General Postproc
GENERAL POSTPROC -> Query Results
QUERY RESULTS -> Subgrid Solution
QUERY NODAL SOLUTION DATA -> Stress X-direction
You may now select a point on the plot and the value for sigmaxx will be given at that point.
Repeat the same steps to get the results for strain xx, strain yy, and displacement in the x and y directions. The plots should look something like figures below. (To clear the old values before querying new values, go to Plot on the menu bar, then choose Replot)
 <--------Strainxx
 <--------Strainyy
 <--------Displacement
X-dir
<--------Displacement
X-dir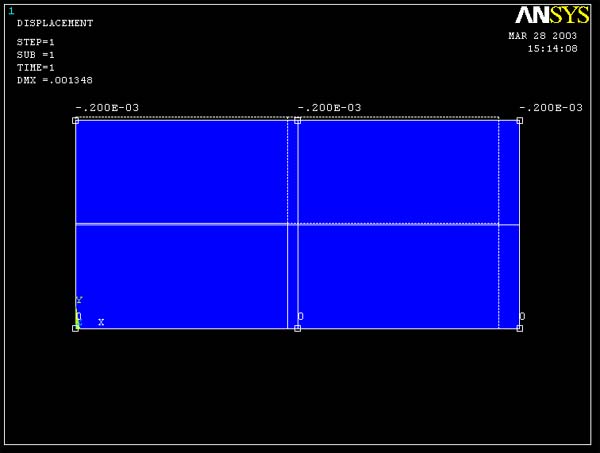 <--------Displacement
Y-dir
<--------Displacement
Y-dir