6C. Graph Stresses for a Cross Section of the Plate
MAIN MENU -> General Postproc
GENERAL POSTPROC -> Path Operations
PATH OPERATIONS -> Define Path-By Nodes
![]()
6C. Graph Stresses for a Cross Section of the
Plate
![]()
MAIN MENU -> General
Postproc
GENERAL POSTPROC -> Path
Operations
PATH
OPERATIONS -> Define
Path-By Nodes


For
the ByNodes window, pick
two points along
the
right side of the rectangle, which are (4,0) and (4,2).
The order of points you pick matters in the plot across the section. The first
point you choose will have the coordinate of
zero in the graph while the other point will be located at 2.
Then click OK.
In the "Define Path Name" box, type: 1,
In the Define
Path Name box, type
1.

Click OK. Then you will see the PATH command window. Close the window.

PATH OPERATIONS -> Map Onto Path

Stress in X direction
In the window MAP RESULTS ITEMS ONTO PATH , click on Stress and X-Direction SX or whichever stress component is relevant.

Then click OK. Now you have specified the path which you want to generate a solution along. Then, make a call to the function that plots the graph for us.
GENERAL POSTPROC --> Path Operations
PATH OPERATIONS -> Plot Path Items
PLOT PATH ITEMS -> On Graph
In
the PATH PLOT OF PATH ITEMS window, highlight
SX.
Click OK.
Then a graph of stress component along the chosen path will appear as shown in the figure below.
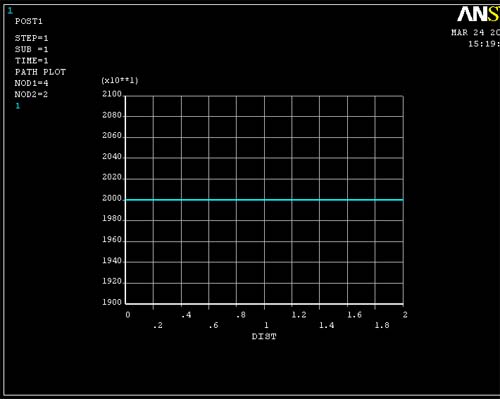 (add figure 6c8)
Stress in
Y direction
You can also get plots of Sigma yy vs. y at
x=4 by following steps similar to those listed
above.
Once this is done you can compare the data to the values you expect from elementary
theory of an axially-loaded member.
Go back to the Map Onto Path command.
PATH OPERATIONS -> Map Onto Path
In the window MAP RESULTS ITEMS ONTO PATH , click on Stress and Y-Direction SY.
PLOT PATH ITEMS -> On Graph
In the PATH PLOT OF PATH ITEMS window, highlight SY.
You should be able to get the figure below.
If you cannot see the picture, remember to go to replot command in the menu bar.
 <--------
Sigma yy
<--------
Sigma yy
Note: The stress in Y direction is approximately zero. In different versions
of ANSYS, this graph differs bacause of different algorithms each version uses
in solving.
Shear
Stress XY
You
can also get plots of Shear Stress xy vs. y at
x=4 by following steps similar to those listed above.
Once this is done you can compare the data to the values you expect from elementary
theory of an axially-loaded member.
Go back to the Map Onto Path command.
PATH OPERATIONS -> Map Onto Path
In the window MAP RESULTS ITEMS ONTO PATH , click on Stress and SY-Shear SXY.
PLOT PATH ITEMS -> On Graph
In the PATH PLOT OF PATH ITEMS window, highlight SXY.
You should be able to get the figure below.
If you cannot see the picture, remember to go to replot command in the menu bar.
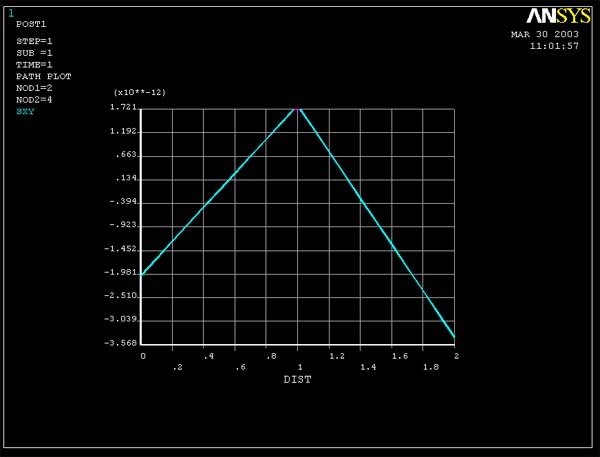 <--------
Tau xy
<--------
Tau xy
Note:
The stress in Y direction is approximately zero.
