
6A. Deformed Shape Plot and Extracting Nodal Values
In this step, we are going to obtain the deformed shape plot
to see how the displacement boundary conditions and the applied load affect
the plate.
MAIN MENU -> General
Postproc
GENERAL POSTPROC -> Plot
Results
PLOT
RESULTS -> Deformed shape
PLOT DEFORMED
SHAPE -> click on Def + undeformed.

Click
OK.
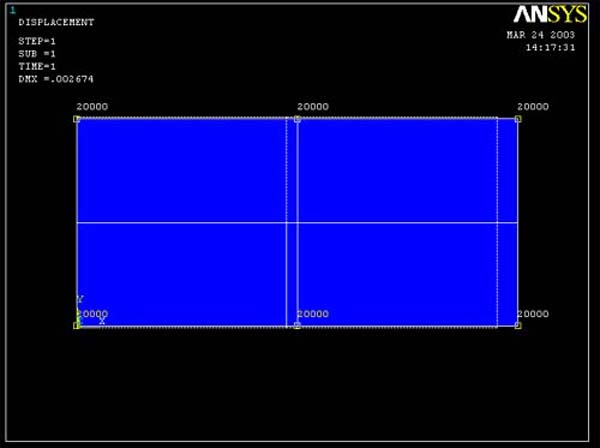
On the ANSYS Graphics window should now appear a blue deformed plate. The dashed
shape represents the undeformed plate.

It is clear that the plate has lengthened uniformly in the x-direction and contracted
uniformly in the y-direction as expected. Also the plate deformations satisfy
the displacement constraints.
You can now query stress, strain and displacement values directly off of your
deformed mesh plot.
MAIN MENU -> General Postproc
GENERAL POSTPROC -> Query Results
QUERY
RESULTS -> Subgrid Solution


QUERY
NODAL SOLUTION DATA -> Click on Stress X-direction

Select any node you want to know its stress in x direction. The stress in x
direction of nodes you selected will appear right next to the nodes (as in the
figure below).
Do the same steps to get the results for strain xx, strain yy, and displacement
in x and y directions. (Go back to the steps where you click on Subgrid Solution.
Then instead of clicking on Stress X-direction, you should click on Strain XX
or Strain YY)
The plots should look something like figures below. (To clear the old values
before querying new values, go to Plot
on the menu bar, then choose Replot)

To
display strain in X-direction.

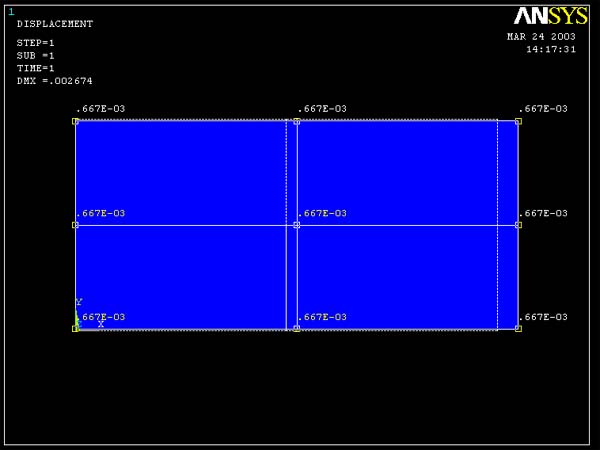 <--------Strainxx
 <--------Strainyy
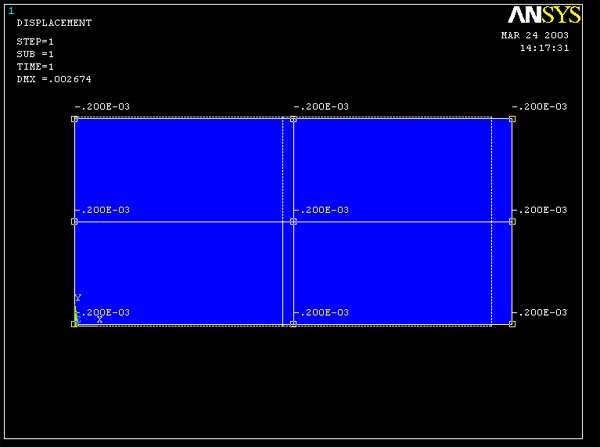
To display Displacement in X-direction.

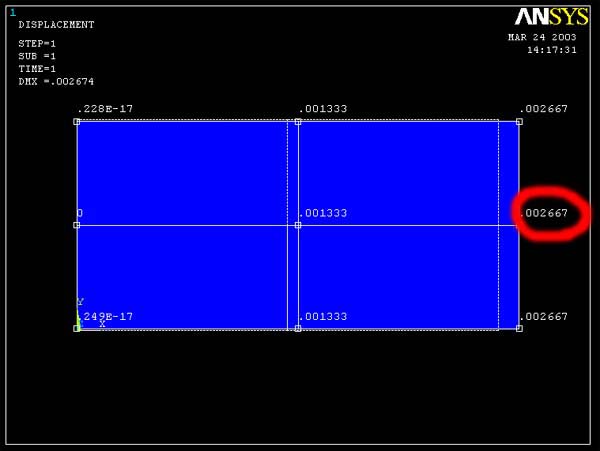 <--------Displacement X-dir
Note: The number in the red circle is the maximum displacement on the far right
edge of the plate.
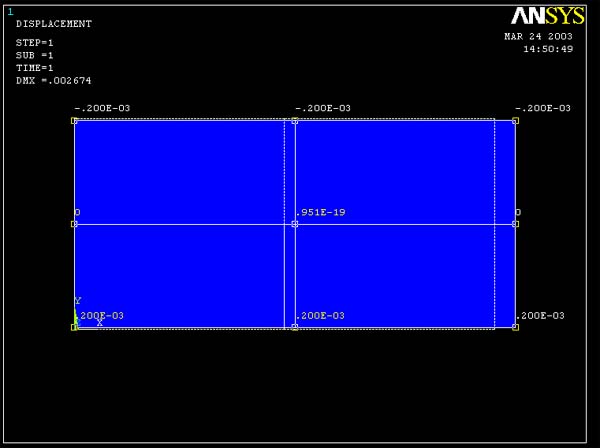 <--------Displacement
Y-dir
<--------Displacement
Y-dir