In this section, you will put the system in positive feedback and examine the resulting instability.
| Turn off power. | |
| Switch the leads from the tach between GND and the controller. | |
| Set the function generator to a DC voltage of zero. | |
| Turn back on the power. Be careful not to touch the motor. | |
| The motor should be still at this point. If not, turn off power, wait until the motor stops, and turn it on again. | |
| Set the oscilloscope to trigger on source 2 in single trigger mode. Set the trigger level to about 1V. | |
| Twist the motor shaft slightly. The motor should spin out of control. | |
| Turn off the power. | |
| You should be able to clearly see the response on the oscilloscope. If not, adjust the vertical position and voltage scales of source 2 and try again. | |
| When you can clearly see the response, print the screen. |
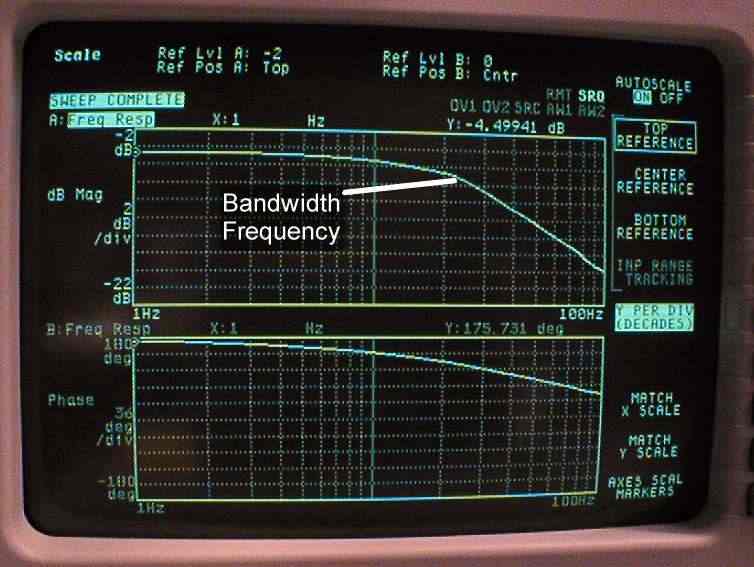
Now, you will generate a set of Bode plots for both open and closed loop using the signal analyzer. Sample plots appear below this section.
| Turn off power supply. | |
| Reverse the tach leads so the system will again be stable. | |
| While leaving everything connected, move the T connector from the function generator output to the signal analyzer source. | |
| Move the cables from inputs 1 and 2 on the oscilloscope to inputs 1 and 2 on the signal analyzer. | |
| Turn off the oscilloscope and turn on the signal analyzer. | |
| Press Inst Mode button and select Swept Sine. | |
| Press Freq button and set the start and stop frequencies to 1Hz and 100Hz. | |
| Select Resolution Setup and set Auto Res. on and Min Res to 101 pts/sweep. | |
| Press Source button and set level to 4Vpk. | |
| Press Scale button and set Autoscale on. | |
| Turn on power supply and hit Start button. | |
| While the motor is spinning, press Disp. Format button and select Bode Diagram. | |
| This is the closed-loop frequency response. Print it out. | |
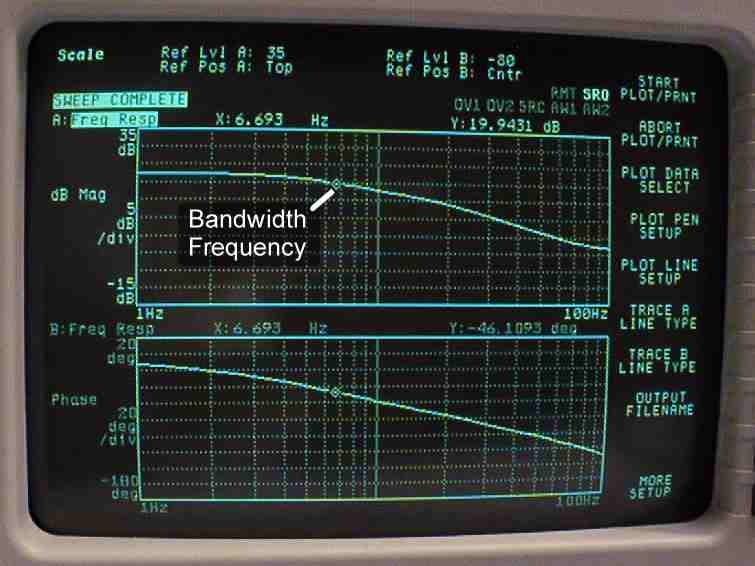
| Put the system in open loop by moving the wire connecting the op-amp to the amplifier from the op-amp output to the row with the function generator output (this bypasses the op-amp circuit entirely). | |
| Press Source button and set level to 200mVpk. (The open-loop has a natural amplification of 20 over the closed-loop.) | |
| Press Start, and while the motor is spinning, press Disp. Format button and select Bode Diagram. | |
| This is the open-loop frequency response. Print it out. |
|
|
| Closed-Loop Frequency Response | Open-Loop Frequency Response |