Carnegie Mellon University
Department of Mechanical Engineering
24-352 Dynamic Systems and Control
Spring 2001
Lab 5 - Motor Speed Control
![]()
Part I. Introduction
In this lab, you will be using proportional feedback control to control the speed of the motor-tach system from Lab 4. A block diagram showing the closed-loop setup is shown below. Note that this diagram does not give the signs of the summer, or any of the content of the blocks.
This setup is identical to that used in Lab 4 except for
the controller closing the feedback loop. This controller is an op-amp circuit
set up as an inverting summer/gain. In this lab, you will design a controller
gain to meet particular design specifications, such as settling time and
steady-state error.
Part II. Measurement
1. Open Loop Response
The open loop TF is of the same for as that in Lab 4, i.e. ![]()
In this lab, treat the Amplifier as part of the motor-tach system. Since the amplifier's gain always multiplies the motor's gain, the product of the two can be treated as the entire system's gain, and there is no need to deal with them separately. Since you may be using a different motor and tachometer, it is necessary to first identify the motor from its open-loop response.
i. Step Response
The motor's gain and time constant can be computed from
the open-loop step response, just as was done in Lab 4.
- Connect Power Supply to Amplifier
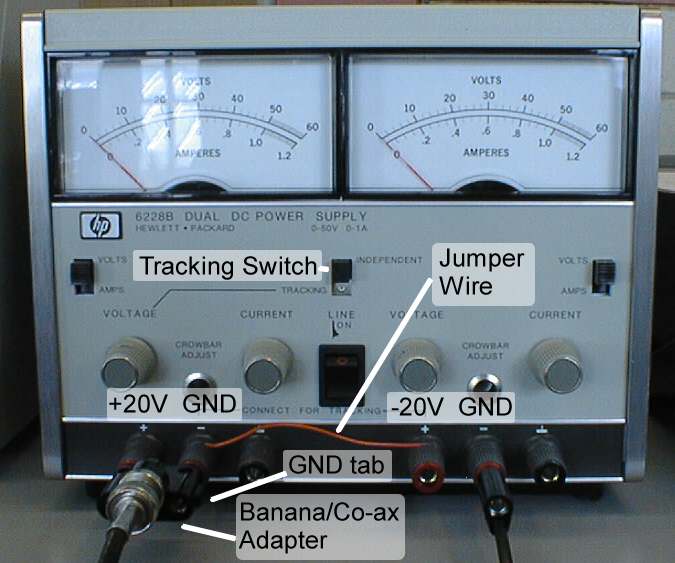
The amplifier is powered with +/-20V from the dual power supply. This requires three connections: +20V, GND, and -20V.- Turn on the power supply.
- Set the power supply tracking switch to Independent, switch both sides to Volts and set each side of the power supply to 20V. Turn the supply off!
- Connect the negative terminal of the left side of the supply to the positive terminal of the right side with a jumper wire (see picture), creating the GND signal from either of the connected terminals.
- Attach a BNC/banana adapter to the left side of the supply, with the GND tab to the right. This gives +20V and GND.
- Attach a banana cable to the negative terminal of the right side. This gives -20V.
- Plug the banana cable from the -20V on the power supply to the -V terminal of the amplifier.
- Attach a BNC/banana adapter to the +V and GND terminals of the amplifier with the GND tab to the right.
- Connect this to the BNC/banana adapter on the power supply with a BNC cable.
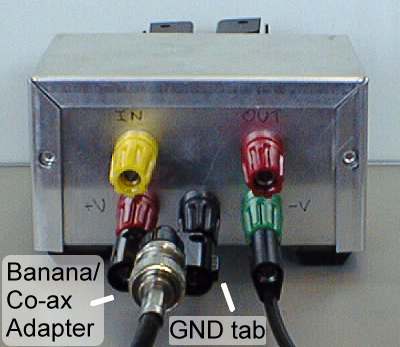
Power Supply Amplifier - Connect Motor and Tach to Amplifier, Oscilloscope and
Function Generator
- Connect jumper wires to IN, OUT and GND terminals of the amplifier.
- Connect black lead from motor and red lead from tach to the GND terminal on amplifier using a clip cable.
- Connect the red lead from motor to the OUT terminal of amplifier using a clip cable.
- Connect a BNC/clip cable to Channel 2 of the oscilloscope. Clip the black lead to the GND wire, and the red lead to the black lead from the tach.
- Attach a BNC T-connector to the output of the function generator.
- Connect one side of T-connecter to Channel 1 of the oscilloscope using a BNC cable.
- Connect a BNC/clip cable to the other side of BNC T-connector. Clip the black lead to the GND wire, and the red lead to the IN terminal of the amplifier.
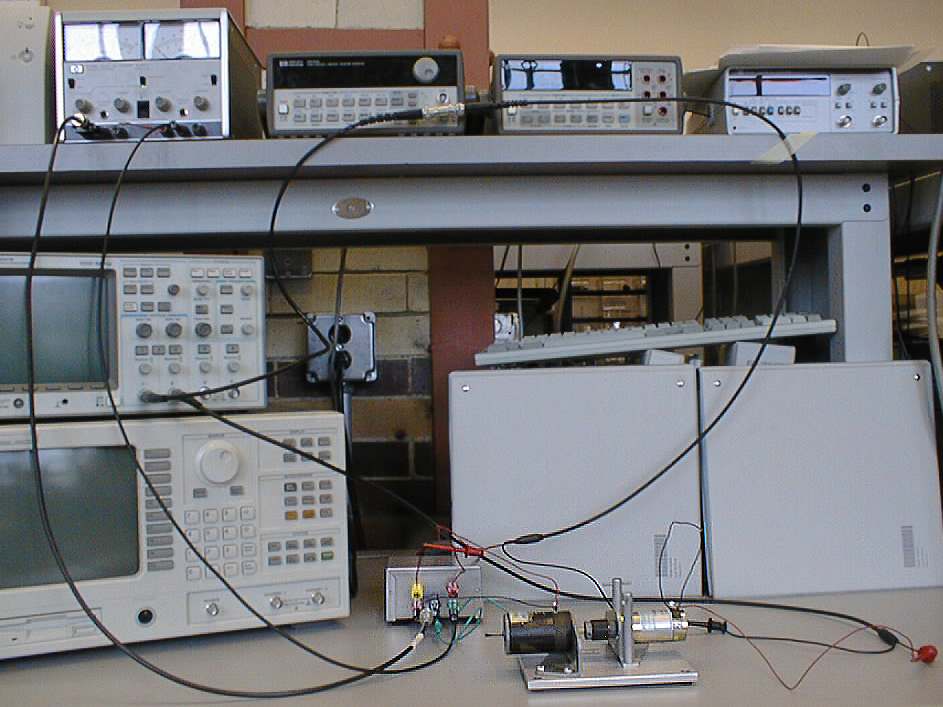
Setup for Open-Loop - Set the function generator and oscilloscope.
- Set function generator to a square wave with amplitude 100mVpp (This is really 200mVpp) and frequency 1Hz.
- Set the function generator offset to 120mV. (This is really a 240mV offset). This offset is to ensure that the motor is always moving. If the motor is allowed to stop, static friction will affect the response. The step response will occur between a low speed and a high speed, rather than from a stop.
- Set oscilloscope voltage scale for channel 1 (the input from the function generator) to 100mV/div.
- Set the time scale to 20ms/div.
- Set the horizontal delay to 80ms (this moves the step to the left of the screen so that the entire step response can be seen.)
- Set the trigger source to Channel 1, the trigger mode to Normal and the trigger level to about 240mV.
- Set the vertical position of channel 1 so the step trace appears on the upper half of the screen.
- Set the voltage scale for channel 2 (the tach output) to 1V/div.
- Set the vertical offset so the origin of channel 2 is near the bottom of the screen.
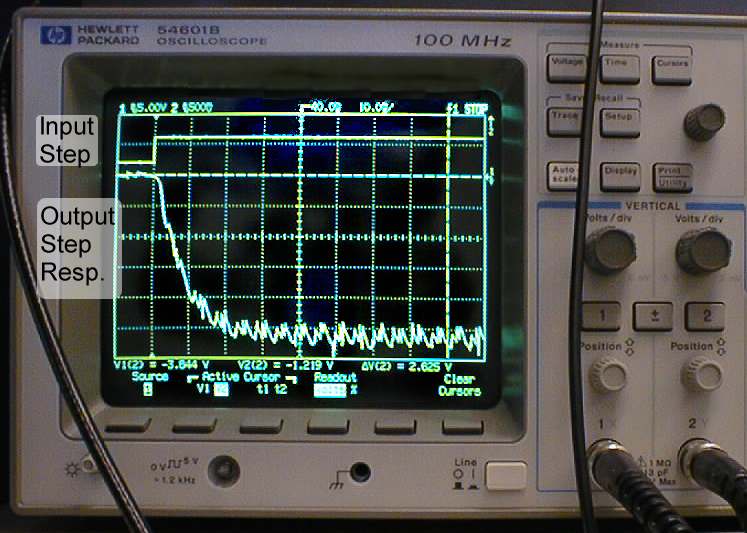
- Measure Step Response
- Turn on power. The motor should spin, and you should get a response similar to that shown below.
- You may switch to Average Display mode to have better picture on oscilloscope screen.
- Use the cursors to measure the difference in voltage levels between the initial and final values of the output step response. Be sure to use the cursors for Source 2. Record this value.
- Print the resulting screen.
- In Lab, calculate the K and
 values from your step response. Use either the settling time or
initial slope method for
. You will use these values later.
values from your step response. Use either the settling time or
initial slope method for
. You will use these values later.
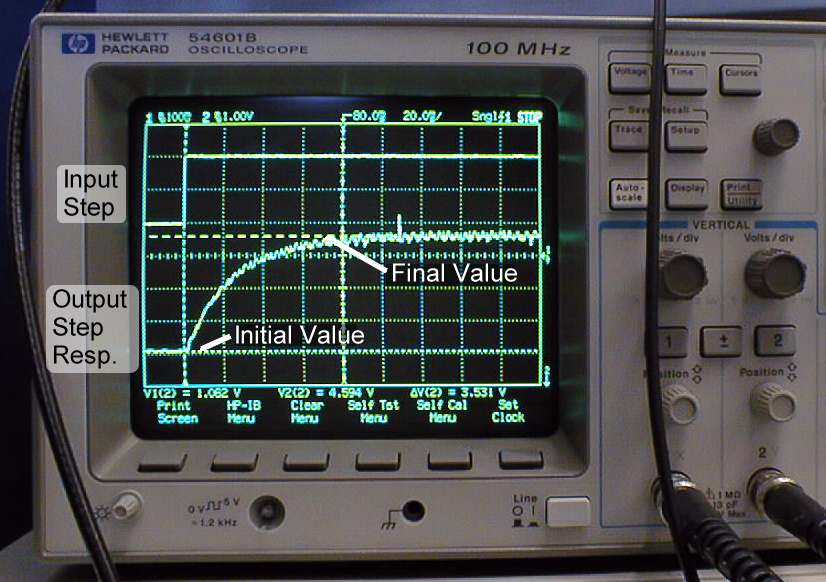
Open-Loop Step Response
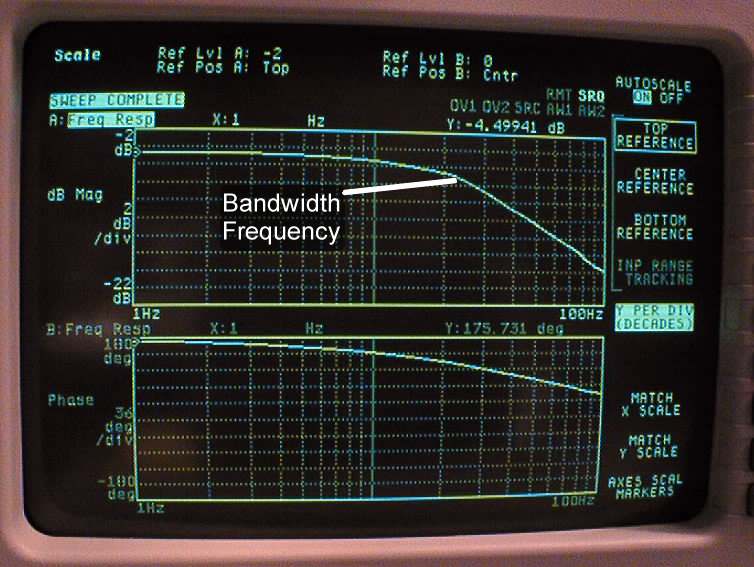
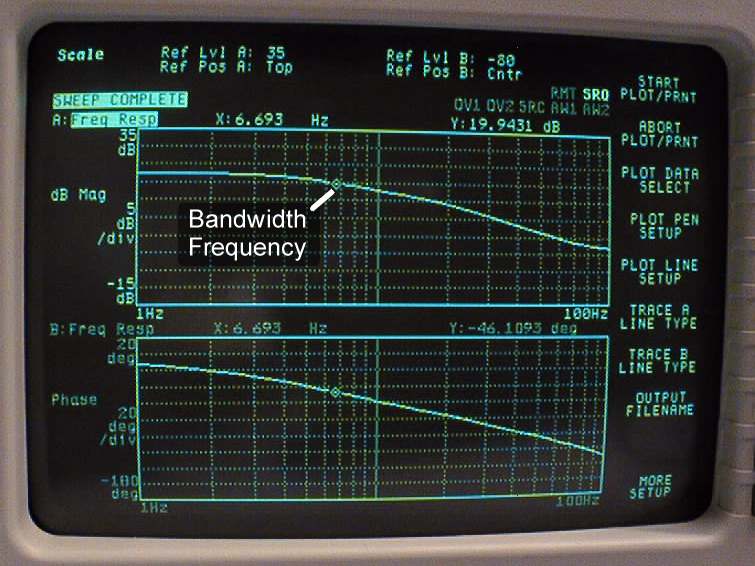
ii. Frequency Response
Rather than plotting the entire frequency response, you will just evaluate the bandwidth. The bandwidth is defined as the frequency above which the output amplitude in response to a sinusoidal input is 3dB below (-3dB is equivalent to multiplying by 0.707) the output amplitude to a low-frequency sinusoid. The bandwidth is a common characteristic for defining the performance of a control system since a system can respond well only to frequencies below its bandwidth.
- First, if you have used Average Display in previous measurement, please switch back to Normal display.
- Set the function generator to a sine wave with frequency 0.5Hz without changing its amplitude and offset.
- Adjust time scale to properly view the sinusoid, 500ms/div should work fine.
- Measure the output amplitude with the cursors. Try to exclude any noise from your measurements. Record this value - this is the low-frequency amplitude. Print this screen.
- Compute the amplitude which is 3dB below the low-frequency amplitude.
- Increase the input frequency until the output amplitude is 3dB below the low-frequency amplitude. Change time scales as necessary in order to exclude noise. Record this amplitude and the bandwidth frequency. Print this screen.
iii. Disturbance Response
The disturbance, in this lab, will simply be a torque applied to the shaft of the motor by hand. Since we cannot measure this, you will only get a qualitative idea of the effect of the disturbance. In order to best see the disturbance response, a command of zero will be sent to the motor (in this case, it means no input to the motor.)
- Set the function generator to a DC voltage by holding any of the function shape buttons for several seconds. Set the level to zero volts.
- Turn the shaft of the motor gently by your hand and get a feel for how much resistance to turning there is.
2. Proportional Control
Controller Circuit
In this section, you will add a control loop around the system to improve the step response, improve steady-state error, increase bandwidth, and improve disturbance rejection. The controller will be an inverting summer/gain op-amp circuit as shown below. The gain will first be selected so as to give one-half the time constant as the open loop response. The relationship for this circuit is 
Calculate Gain and Set Potentiometer
The relation between closed-loop time constantYou will derive this relation in lab question #4. For now, by using this relation;
- Calculate the gain, Kc, which
results in
 .
This will give three times as fast a response as before.
.
This will give three times as fast a response as before.
- Calculate the value of the resistance R2=(KcR1) if R1=560K ohms. This is what you will later set the potentiometer to.
Op-Amp
You will be using a LM324 quad operational-amplifier chip. This chip has four op-amps, you will only use one in this lab. It requires (+) and (-) power, and a GND signal is needed to form the proper circuit. These three power signals will be taken off the terminals from the amplifier. The chip's pin I/O's are shown below. 
i. Closed-Loop Step Response
- Apply Power to Breadboard
The pictures following this and the next items may be helpful in assembling the circuit.- Be sure the power is turned off.
- Connect the GND terminal of the amplifier to the GND post on the breadboard with a banana cable.
- Connect the GND post to the top row of the breadboard with a small jumper wire.
- Connect the top row of the breadboard to the second column in from the right with a small jumper. This is the GND column.
- Connect jumper wires to -V and +V terminals of the amplifier.
- Connect the -V terminal of the amplifier to the rightmost column of the breadboard using a jumper wire and a clip cable. This is the -V column.
- Connect the +V terminal of the amplifier to the first column to the left of the right half section of the breadboard using a jumper wire and a clip cable.
- Insert Op-Amp Chip and apply +/-V
- Insert the chip in the center of the right half of the breadboard so that it straddles the small gap in the middle with the end with the notch facing up (see picture).
- Connect the +Vcc pin of the chip to the +V column with a small jumper.
- Connect the -Vcc pin of the chip to the -V column with a small jumper.
- Connect the + input pin of one of the op-amps (pin 12 in the picture) to the GND column with a small jumper. This sets the zero reference voltage for the summer.
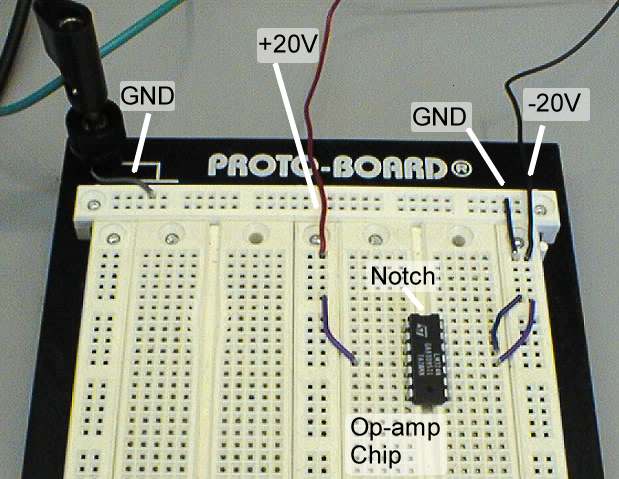
Power Connections for Op-Amp Circuit - Set Potentiometer and Build Controller Circuit
- Use the multimeter to measure the resistance of the potentiometer between the two leads. When measuring resistances, be careful not to touch the multimeter leads.
- Set the resistance of the potentiometer to the value calculated earlier (R2 value).
- Attach the potentiometer between the output (pin 14) and negative input (pin 13) terminals on the op-amp. Be careful not to change the setting.
- Attach two 560K resistors (green-blue-yellow) between the negative input (pin 13) of the op-amp and two different free rows of the breadboard.
- Connect Controller to System
- Detach the red clip from the IN terminal of the amplifier and attach it to the free end of one of the input resistors in the op-amp circuit. This is -r(t), the reference input.
- Detach the red clip from the tachometer signal wire and attach it directly to the corresponding terminal on the tach. This will free up the wire, and attach this wire (which is the tachometer signal wire) to the row of breadboard containing the free end of the remaining input resistor. This is the output signal being fed back.
- Connect the output pin of the op-amp (pin 14) and the IN terminal of the amplifier by using a jumper wire and a clip cable. This is the control signal.
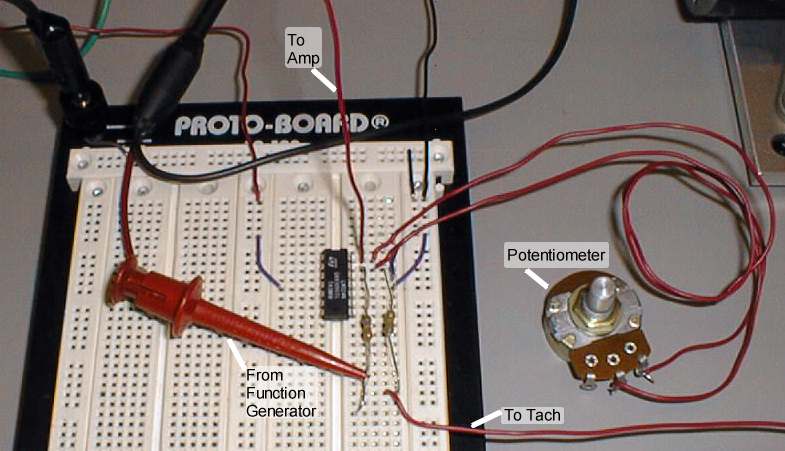
Controller Circuit Layout 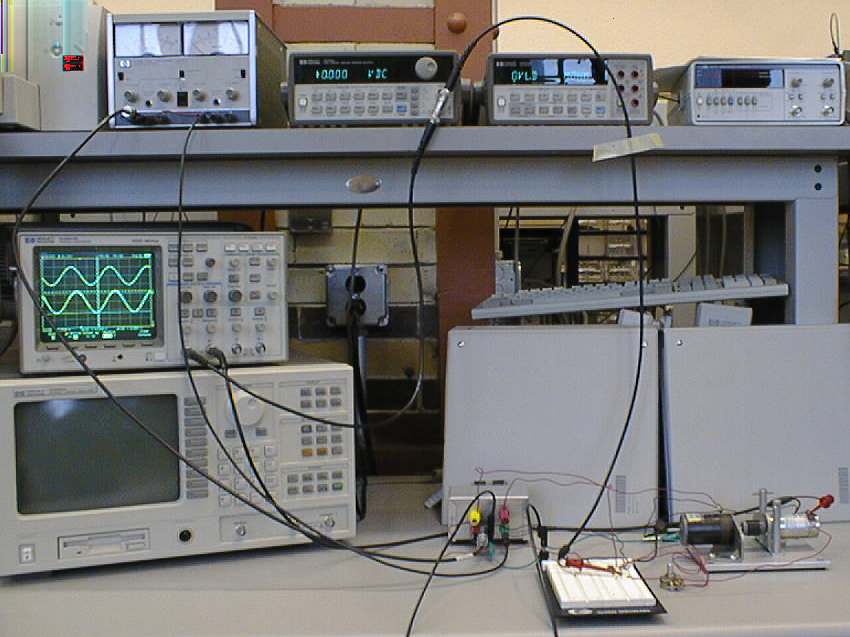
Setup for Closed-Loop - Measure Step Response
- Check your connections. It is particularly important that the power be applied to the op-amp in the right direction, and that none of the pins on the chip are shorted to each other.
- Set the function generator to a square wave input of amplitude 2.5Vpp, offset 2.5V (keep in mind these are 5V in reality), and frequency 1Hz.
- Set Channel 1 voltage scale to 5V/div and Channel 2 voltage scale to 1V/div on the oscilloscope .
- Set the time scale to 20ms/div, and the time delay to 80ms.
- Set the trigger level to 5V.
- Adjust the vertical position of channel 1 so that the input appears in the top half of the screen.
- Turn on the power. If the voltage levels on the power supply do not go up to 20V, then turn it off immediately since something is most likely shorted.
- If the motor spins uncontrollably, you are in positive feedback. If this is the case, interchange the two leads from the tachometer.
- Adjust the vertical position of channel 2 so it appears in the bottom half of the screen. Trace 2 will be negative when trace 1 is positive (see picture for closed loop step response).
- Average display should be useful again.
- Use the cursors to measure the output step response amplitude.
- Print this screen.
- Using step response determine closed loop gain Kcl and time constant.
- Move the red oscilloscope lead from the tach output to the output of the op-amp (pin 14). Here, you may use an extra jumper wire to connect output of the op-amp (pin 14) row on protoboard.
- You are now viewing the control signal to the system. You may set the time scale on the oscilloscope screen to 100ms/div and voltage scale on Channel 2 to 200mV/div.
- Print this screen and re-attach the red oscilloscope clip to the tach output.

Closed-Loop Step Response Closed-Loop Control Signal
ii. Closed-Loop Frequency Response
Follow the same procedure as you did when finding the
open-loop bandwidth to find the closed-loop bandwidth.
iii. Closed-Loop Disturbance Response
Follow the same procedure as you did when examining the open-loop disturbance response to examine the closed-loop disturbance response. The shaft should be more difficult to turn now. To compare this with the open-loop, disconnect the motor from the OUT terminal of the amplifier. After experimenting, connect it back to OUT terminal of the amplifier.
Positive Feedback
In this section, you will put the system in positive feedback and examine the resulting instability.
- Turn off power.
- Switch the leads from the tach between GND and the controller, i.e. connect the red tach lead to the resistor row where black tach lead was connected and connect the black tach lead to the ground wire.
- Also disconnect the red clip from black tach post and connect it to red tach post.
- Set the function generator to a DC voltage by pressing one of the function shapes for several seconds and set the offset level to zero volts.
- Set the voltage scale to 5V/div on Channel 2 and time scale to 50ms/div.
- Set trigger to source 2, trigger mode to Single and trigger level to about -2V/div on the oscilloscope.
- Turn back on the power. Be careful not to touch the motor.
- The motor should be still at this point. If not, turn off power, wait until the motor stops, and turn it on again.
- Twist the motor shaft slightly. The motor should spin out of control.
- Turn off the power.
- You should be able to clearly see the response on the oscilloscope. If not, adjust the vertical position and voltage scales of source 2 and try again.
- When you can clearly see the response, print the screen.
3. Frequency Response Plots
Now, you will generate a set of Bode plots for both open and closed loop using the signal analyzer. Sample plots appear below this section.i. Closed Loop Frequency Response
- Turn off power supply.
- Reverse the tach lead so the system will again be stable, i.e. red tach lead is connected to ground, black tach lead is connected to the resistor. Also be sure to switch back the red scope clip from red-tach post to black-tach post.
- While leaving everything connected, move the T connector from the function generator output to the signal analyzer source.
- Move the cables from channels 1 and 2 on the oscilloscope to input channels 1 and 2 on the spectrum analyzer.
- Turn off the oscilloscope and function generator, and turn on the spectrum analyzer.
- Press INST MODE button on MEASUREMENT menu.
- Select SWEPT SINE by pressing F4.
- Press FREQ button on MEASUREMENT menu.
- Press F3 to select START frequency and set it to 1Hz.
- Press F4 to select STOP frequency and set it to 100Hz.
- Select RESOLUTION SETUP by pressing F10.
- Set AUTO RESOLUTION to ON by pressing F4.
- Select MINIMUM RESOLUTION by pressing F6, then set it to 101 pts/sweep (F1).
- Press SOURCE button on MEASUREMENT menu.
- Press F2 to set LEVEL, then enter 4Vpk (F6).
- Press SCALE button on DISPLAY menu.
- Set AUTOSCALE to ON by pressing F1.
- Turn on power supply.
- Press yellow START button on MEASUREMENT menu. Now, motor should start spinning.
- While the motor is spinning, press DISP FORMAT button on DISPLAY menu and select BODE DIAGRAM by pressing F9.
- This is the closed-loop frequency response. Print it out; press PLOT/PRINT button on SYSTEM menu, then press F10 for MORE SETUP and F2 to select DEVICE IS PRNT, then F10 for RETURN. Finally press F1 to START PLOT/PRNT.
ii. Open-Loop Frequency Response
- Put the system in open loop by moving the wire connecting the op-amp to the amplifier from the op-amp output (pin 14) to the row with the spectrum analyzer's source output. This bypasses the op-amp circuit entirely and puts the system in open loop.
- Press SOURCE button on MEASUREMENT menu, and then press F2 to set LEVEL, then enter 200mVpk (F7). (The open-loop has a natural amplification of 20 over the closed-loop.)
- Press yellow START button on MEASUREMENT menu.
- While the motor is spinning, press DISP FORMAT button on DISPLAY menu.
- Select BODE DIAGRAM by pressing F9.
- This is the open-loop frequency response. Print it out.
| 
|
| Closed-Loop Frequency Response | Open-Loop Frequency Response |
Part III. Lab Report
Note: Please answer all questions by numbering them in the order given here.- Open Loop Step Response
- Given your open loop step response, calculate the
gain and time constant (K and
).
- Write the open loop transfer function of the amp-motor-tach system.
- Given your open loop step response, calculate the
gain and time constant (K and
- Open Loop Frequency Response
- Analytically show that the bandwidth frequency
occurs at
 .
Starting with open loop transfer function, make
.
Starting with open loop transfer function, make  substitution and then find the amplitude expression for transfer
function. Set this to 0.707 times the maximum value(-3dB below) and
solve for
substitution and then find the amplitude expression for transfer
function. Set this to 0.707 times the maximum value(-3dB below) and
solve for  .
.
- Given your transfer function obtained earlier, calculate the expected bandwidth frequency. How does this compare to the frequency obtained experimentally.
- Compare this frequency to the bandwidth obtained from the spectrum analyzer (by finding -3dB). Why might they be different? Why might the amplitude of the spectrum analyzer's output be different than that obtained by hand? (hint - consider friction).
- Analytically show that the bandwidth frequency
occurs at
- Open Loop Disturbance Response
How does the open loop system respond to a disturbance? Why? - Closed Loop Step Response
- Assuming negative feedback, given the open-loop
transfer function obtained earlier, write down the closed-loop
transfer function in terms of the controller gain, Kc,
and the open loop parameters K and .
- Given the new closed-loop transfer function,
solve for the closed loop gain,
 , and time constant,
  ,
in terms of the open loop parameters, K and ,
and the controller gain, Kc.
,
in terms of the open loop parameters, K and ,
and the controller gain, Kc.
- What happens to
and
as Kc is increased?
- What happens to the closed-loop pole as Kc is increased?
- Calculate the value of Kc that
will make
symbolically.
- Plug in the numbers and show your calculations for the resistance value of the potentiometer.
- Calculate the actual
and
from your step response. Compare this to what is expected. Why might
they be different?
- Calculate the transfer function from the input to the control signal (the signal between the controller and the amplifier) given your open-loop transfer function.
- For the step input given to the system, find the control signal as a function of time.
- Compare the observed control signal to the expected control signal. Look at the steady-state value, the shape of the response, and the size of the peaks.
- Why might you want to use a very large gain in this controller? Why can't you use an arbitrarily large gain? Think in terms of the control signal and the capabilities of the amplifier.
- Assuming negative feedback, given the open-loop
transfer function obtained earlier, write down the closed-loop
transfer function in terms of the controller gain, Kc,
and the open loop parameters K and
- Closed Loop Frequency Response
- What bandwidth would you expect in closed loop,
given your theoretical closed loop transfer function? Also calculate
it in terms .
Compare these values to the observed bandwidth. Why might they be
different.
- Compare the bandwidth obtained from the signal analyzer to these values. Explain any differences.
- Why does bandwidth give a good indication of the performance of the control system?
- What bandwidth would you expect in closed loop,
given your theoretical closed loop transfer function? Also calculate
it in terms
- Closed Loop Disturbance Response
- Compare what you observed in closed-loop to what you observed in open-loop.
- Physically, how does the system respond to a disturbance? Explain what the controller does in response to the disturbance.
- For closed loop, assuming the disturbance adds in at the control signal, calculate the transfer function from the disturbance to the output in terms of Kc. What happens to the steady-state response as Kc is increased? What does this say about Kc?
- Positive Feedback
- Calculate the closed-loop transfer function in positive feedback.
- Compute the pole of this transfer function. What does this say about the final value and the stability?
- Compute the response to an impulse input as a function of time. compare this to what you observed and plotted.
- Will all systems be unstable in positive feedback?
- Will any systems be unstable in negative feedback?

About this document ...
This document was generated using the LaTeX2HTML translator Version 96.1 (Feb 5, 1996) Copyright © 1993, 1994, 1995, 1996, Nikos Drakos, Computer Based Learning Unit, University of Leeds.
The translation was initiated by Jonathan E Luntz, last update was made by Kyun Hee Koh