Carnegie Mellon University
Department of Mechanical Engineering
24-352 Dynamic Systems and Control
Spring 2001
Lab 4 - Motor Identification
![]()
Part I. Introduction
In this lab, you will be measuring the speed-dynamics of a DC motor. A schematic of the setup you will use is shown below. You will measure the speed of the motor using a second, identical motor connected to the first. The second motor acts as a generator, and is called a tachometer. The tachometer's output is measured with the oscilloscope. The signal to command the motor is produced by the function generator. Since the function generator is not capable of powering the motor by itself, its signal is first passed through an amplifier to boost the power of the signal.
The lab will consist of three sections:
- Identify Amplifier
- Relate output voltage of the amplifier to the input voltage.
- Motor Step Response
- Look at the motor's step response and identify the time constant and DC gain parameters.
- Motor Frequency Response
- Obtain the motor's response to sinusoidal inputs of varying frequencies. Relate this to the step response.
Vout = Ka * Vin
| K |
|
|
where K is the DC (or steady-state)
Gain of the motor, obtained from the Final Value Theorem, and ![]() is the Time Constant of the motor, obtained from the exponential form
of the step response.
is the Time Constant of the motor, obtained from the exponential form
of the step response.
Part II. Measurement
1. Identify Amplifier
Besides boosting the power of the signal from the function generator, the amplifier multiplies the voltage by a constant. This part of the lab involves identifying the value of this multiplicative constant. A range of voltages will be inputted to the power supply, and the output will be measured.
The amplifiers are not protected from improperly connected power, so be sure that the power cables are connected properly before turning on the power.
- Connect Power supply
The amplifier is powered with +/-20V from the dual power supply. This requires three connections: +20V, GND, and -20V.- Turn on power supply.
- Set the power supply tracking switch to Independent, switch both sides to Volts.
- Set each side of the power supply to 20V by using Voltage knobs.
- Turn the supply off!
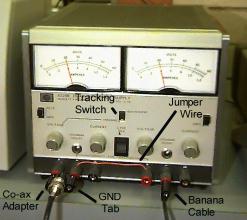
- Connect the negative terminal of the left side of the power supply to the positive terminal of the right side with a jumper wire (see picture), creating the GND signal from either of the connected terminals.
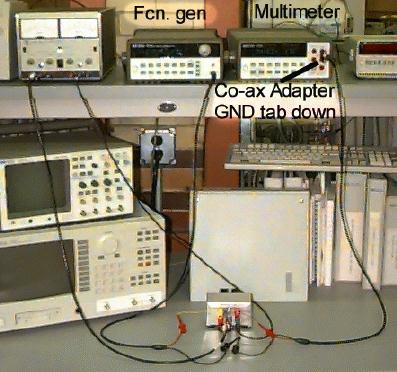
- Attach a BNC/banana adapter to the left side of the supply, with the GND tab to the right. This gives +20V and GND.
- Attach a banana cable to the negative terminal of the right side. This gives -20V.
- Connect Power to Amplifier
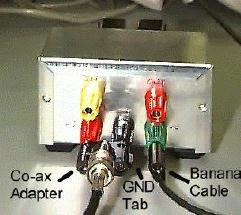
- Attach a BNC/banana adapter to the +V and GND terminals of the amplifier with the GND tab to the right (See next picture).
- Connect this BNC/banana adapter to the BNC/banana adapter on the power supply with a BNC cable.
- Plug the banana cable from the -20V on the power supply to the -V terminal of the amplifier.
- Connect Signal Cables to Amplifier
- Attach a jumper wire to the GND terminal of the amplifier. All devices must be grounded to the same level.
- Attach jumper wires to the IN and OUT terminals of the amplifier.
- Attach the black clip of two BNC/pigtail clips to the ground wire.
- Attach one red clip of the BNC/pigtail clips to each of the jumpers on the IN and OUT terminals.
- Connect Function Generator and Multimeter
- Attach the IN BNC/pigtail-clip cable from the amplifier to the output of the function generator.
- Attach the OUT BNC/pigtail-clip cable from the amplifier to the multimeter using a BNC/banana adapter with the GND tab to the bottom.
- Set The Multimeter and Function Generator
- Turn on the function generator and multimeter.
- Hold any of the function shape buttons on the function generator for several seconds to set it to DC Voltage mode (in order to apply constant voltages to the amplifier). Set the voltage to zero.
- Set the multimeter to measure DC Voltage.
- Verify Power Connections
- Check the +20V, GND, and -20V connections to verify they are correct. Do not turn on the power supply unless these connections are correct, or damage to the amplifier will occur (trust me - it WILL happen, including possible explosions).
- Turn on the power supply.
- Take Data
- Verify the calibration of the function generator by setting the DC voltage to 0.1V. Temporarily disconnect the red multimeter lead clip from the output terminal of the amplifier and attach it to the input terminal. The multimeter will most likely read 0.2V. This is due to mis-calibration of the function generator. The multimeter returns the correct voltage.
- Reconnect the multimeter lead to the amplifier
output. Fill out the following table for input voltages and output
voltages (use the real input voltage, not the function generator's
reading).
Vin Vout Ka 
Vin Vout Ka -1.2V
N/A
+0.2V
-1.0V
N/A
+0.4V
-0.8V
+0.6V
-0.6V
+0.8V
-0.4V
+1.0V
N/A -0.2V
+1.2V
N/A +0.0V
2. Motor Step Response
- Disconnect Multimeter
- Turn off power supply and multimeter.
- Disconnect and remove the BNC/pigtail cable which connects the multimeter to the amplifier.
- Connect source and oscilloscope.
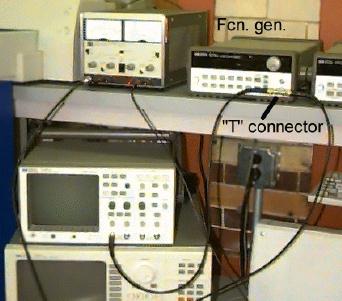
- Disconnect the BNC cable from output of function generator and connect it to a BNC T-connector and then connect this T-connector to the output of function generator.
- Connect the other side of the T-connector to Channel 1 of the oscilloscope using a BNC cable.
- Connect a Co-ax/pigtail cable to Channel 2 of the oscilloscope.
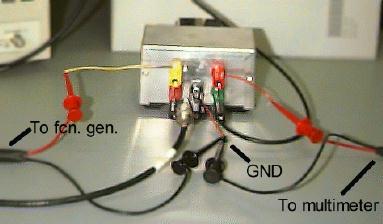
- Connect motor and tach to amplifier and oscilloscope.
- Attach an alligator clip to the GND terminal on the amplifier.
- Attach the other end of the alligator clip to the black lead from the motor and to the red lead from the tach.
- Attach the red lead from the motor to the OUT terminal of the amplifier using a clip cable.
- Clip the black lead from Channel 2 on the
oscilloscope to the ground alligator clip near the motor. Clip the
corresponding red lead to the black lead coming from the tach.
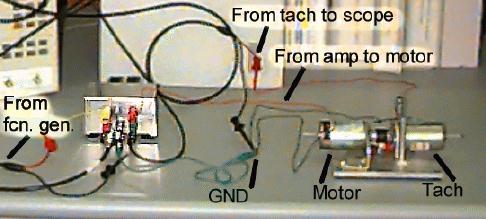
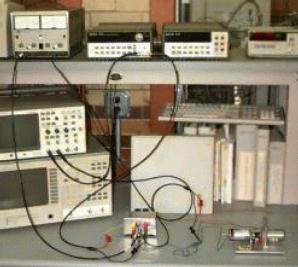
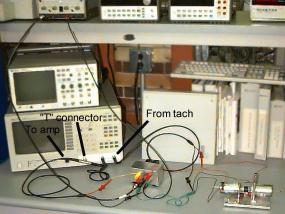
- The entire setup is shown below:
- Set the function generator and oscilloscope.
- Select a square wave with peak-to-peak amplitude 100mV (this is actually 200mV.) and frequency 1Hz.
- Set the offset to 120mV (this is really a 240mV offset). This offset is to ensure that the motor is always moving. If the motor is allowed to stop, static friction will affect the response. The step response will occur between a low speed and a high speed, rather than from a stop.
- Setup oscilloscope.
Note: Do NOT use autoscale. It won't pick up low frequency signals well.- Set the voltage scale for Channel 1 (the input from the fnc. gen.) to 100mV/div.
- Set the time scale to 20ms/div.
- Set the horizontal delay to 80ms (this moves the step to the left of the screen so that the entire step response can be seen.)
- Set trigger by Channel 1, trigger mode to Normal and set the trigger level at ~240mV
- Set the vertical position of trace 1 so the step trace appears on the upper half of the screen.
- Set the voltage scale for Channel 2 (the tach output) to 1V/div.
- Set the vertical offset so the origin of trace 2 is near the bottom of the screen.
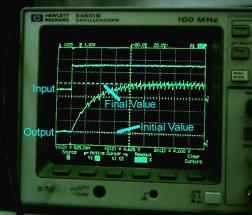
- Turn on power. The motor should spin, and you should get a response similar to that shown below.
- The response will be very noisy, to get better picture you can use Average display option of the scope with 256 Number of averages.
- Use the cursors to measure the difference in voltage levels between the initial and final values of the step response (Channel 2), record this value. Make sure that measurement cursor's source is set to Channel 2.
- Print the resulting screen.
- After printing, switch back to Normal
display rather than Average display.
3. Motor Frequency Response
i. Manual
First, you will apply sinusoidal inputs to the motor, adjusting the frequency manually, and measuring the output amplitude and phase.- Set the function generator and oscilloscope.
- Set the function generator to sinusoidal waveform.
- Set the frequency to 0.2Hz
- Set the time scale on the oscilloscope so that one or two full periods of the sinusoid are on the screen.
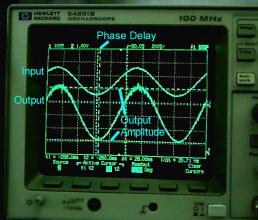
- Use the cursors to measure the output amplitude.
- Use the time cursors to measure the phase shift between a valley of the input sinusoid and the closest valley of the output sinusoid. (Do not forget to set 360 degrees on the oscilloscope for each frequency.)
- Output will appear as shown below and print
this screen.
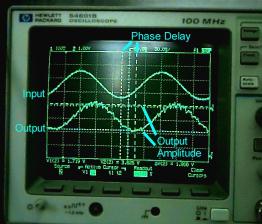
- Take the data to fill out the the following table
(just amplitude and delay), adjusting the input frequency and the time
scale on the oscilloscope as appropriate. Print the responses at 2Hz and
20Hz.
Freq. Output
Amplitude
(Volt)Phase
(degree)
Amplitude out
Amplitude in (dB)
0.2Hz
0.3Hz
0.5Hz
1Hz
2Hz
3Hz
5Hz
10Hz
20Hz
30Hz
50Hz
100Hz
Did you print system responses at 0.2Hz, 2Hz and 20 Hz?
ii. Automated
This time, you will use the spectrum analyzer to automatically apply a range of sinusoidal inputs to the motor. The magnitude and phase will be computed automatically.- Connect the spectrum analyzer.
- Turn off the power supply, oscilloscope, and function generator, and turn on the spectrum analyzer.
- Disconnect the T-connector from output of function generator and connect it directly to the Source of spectrum analyzer.
- Detach the BNC cable from the Channel 1 of the oscilloscope and attach it to Channel 1 of the spectrum analyzer. This allows the spectrum analyzer to read its own output.
- Detach the BNC cable from the Channel 2 of the oscilloscope and attach it to Channel 2 of the spectrum analyzer.
- Run automated frequency analysis.
- Press INST MODE button on MEASUREMENT menu.
- Select SWEPT SINE by pressing F4.
- Press FREQ button on MEASUREMENT menu.
- Press F3 to select START frequency and set it to 0.2Hz.
- Press F4 to select STOP frequency and set it to 100Hz.
- Set SWEEP to LIN (F6), UP (F7) and AUTO (F8).
- Select RESOLUTION SETUP by pressing F10.
- Set AUTO RESOLUTION to ON by pressing F4.
- Select MINIMUM RESOLUTION by pressing F6, then set it to 101 pts/sweep (F1).
- Set MAX % CHANGE to 2.5% (F5).
- Press SOURCE button on MEASUREMENT menu.
- Press F2 to set LEVEL, then enter 200mVpk (F7).
- Press SCALE button on DISPLAY menu.
- Set AUTOSCALE to ON by pressing F1.
- Turn on power supply.
- Press yellow START button on MEASUREMENT
menu.
Motor will begin to oscillate back and forth. The frequency will gradually increase (it spends more time at lower frequencies). The whole process takes several minutes. Wait until the analysis is complete. - Press DISP FORMAT button on DISPLAY menu .
- Select BODE DIAGRAM by pressing F9.
When the analysis is complete, the spectrum analyzer's screen will look like the following picture.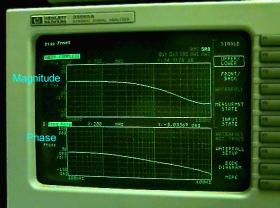
- Print this screen. To print, press PLOT/PRINT button on SYSTEM menu, then press F10 for MORE SETUP and F2 to select DEVICE IS PRNT, then F10 for RETURN. Finally press F1 to START PLOT/PRNT.
- Repeat the analysis between frequencies of 1Hz
and 1000Hz. Without changing any other variable in the spectrum
analyzer's setup,
Press FREQ button on MEASUREMENT menu.
Press F3 to select START frequency and set it to 1Hz.
Press F4 to select STOP frequency and set it to 1000Hz.
Press yellow START button.
Press DISP FORMAT button on DISPLAY menu.
Select BODE DIAGRAM by pressing F9. - Print this screen too.
- Finally, turn off the power supply first and then the spectrum analyzer.
Part III. Lab Report
Your lab write-up should include the following information. Be sure to justify all of your comments. Present your answers in the order of question numbers.- Amplifier Identification
- Plot the output of the amplifier vs. the input. Draw a straight line representing only the linear portion of the graph.
- From both the slope of this line and from an average of the data points, calculate the amplifier's gain Ka.
- Describe and explain the behavior at large positive and negative voltages. How might this affect a control system using this amplifier?
- Motor step response
- For the given transfer function of the motor with a
step input of the magnitude used in lab, calculate the following in terms
of K, Ka and
 .
Remember that the input voltage gets multiplied by the amplifier gain
before it is applied to the motor. (Note: In part a, all of your
answers should be in terms of system constants, no numerical values are
accepted here, you will calculate numerical values in part b)
.
Remember that the input voltage gets multiplied by the amplifier gain
before it is applied to the motor. (Note: In part a, all of your
answers should be in terms of system constants, no numerical values are
accepted here, you will calculate numerical values in part b)
- The final value of the output.
- The time it takes to reach 95% of the final value.
- The initial slope of the graph after the step.
- The location where the initial slope line intersects the final value line.
- Using these results, compute K from the final
value, and from both the
95% settling time and the initial slope/final value intersection. How do
the two estimates of
compare? Which do you think is more accurate, and why?
- Write the transfer function of the
motor-plus-amplifier system substituting in the numbers you obtained. Also
write down its Amplitude and Phase Angle expressions in terms of
 (Recall Lab#2 Calculations).
- Motor frequency response
- Compute the remaining entries of the data table. Magnitude in dB is 20 times the log (base 10) of (output amplitude/input amplitude).
- Generate a pair of Bode plots for this system.
- Using the manual data, plot Magnitude (dB) vs. frequency (Hz), and Phase Angle (degree) vs. frequency (Hz), with frequency on a log scale.
- Also prepare the same plots, that is
Magnitude (dB) vs. frequency (Hz) and Phase Angle (degree) vs.
frequency (Hz) using the transfer function Amplitude and Phase
expressions obtained in the Question 2c. Frequency span should
be from 0.2 Hz to 100Hz and frequency axis should be on a log
scale. Keep in mind,
is in radians/sec and you need to substitute 2*Pi*f
in place of
before plotting where f is frequency in Hz.
- Compare the frequency response plots obtained from numerical plotting of transfer function, from the manual experiment, and from the automated experiment both qualitatively and quantitatively. How closely do they match? Are there any extra features in the experimental plots? If so, explain why there may be extra features.
- Describe what is happening at higher frequencies. How might these high-frequency artifacts effect a control system?
- Estimate the motor's DC gain, K, from the
experimental bode plots (do this for both manual and automatic plots.)
- The magnitude (dB) at low frequencies is equal to 20*log(K*Ka). from this, calculate K.
- Compare this to the step response result.
- Estimate the time constant,
from the experimental bode plots. (Do this for both manual and
automatic plots).
- Fit a -20dB/decade sloped line to the downward-sloping portion of the magnitude plot. Mark a horizontal line at the magnitude where the low frequency magnitude lies. The frequency where these two lines cross is called the break frequency. What is this frequency?
- Compute the time constant as the reciprocal of the break frequency (in rad/s).
- How does this compare to the step response result.