Tkinter Canvas Walkthrough (Part 3)
The sum of it's previous parts!
A canvas widget manages a 2D collection of graphical objects — lines, circles, images, other widgets and more. Tk's canvas is an incredibly powerful and flexible widget, and truly one of Tk's highlights. It is suitable for a wide range of uses, including drawing or diagramming, CAD tools, displaying or monitoring simulations or actual equipment, and for building more complex widgets out of simpler ones.
Canvas
Widgets
Canvas widgets are created using the Canvas function:
canvas = Canvas(parent)
Because canvas widgets have a huge amount of features, we won't be able to cover everything here. What we will do is take a fairly simple example (a freehand sketching tool) and incrementally add new pieces to it, each showing another new feature of canvas widgets. Towards the end of the chapter, we'll then cover some of the other major features not illustrated in the example.
Creating Items
When you create a new canvas widget, it will essentially be a large rectangle with nothing on it; truly a blank canvas in other words. To do anything useful with it, you'll need to add items to it. As mentioned, there are a wide variety of different types of items you can add. Here, we'll look at adding a simple line item to the canvas.
To create a line, the one piece of information you'll need to specify is where the line should be. This is done by using the coordinates of the starting and ending point, expressed as a list of the form x0 y0 x1 y1. The origin (0,0) is at the top left corner of the canvas, with the x value increasing as you move to the right, and the y value increasing as you move down. So to create a line from (10,10) to (200,50), we'd use this code:
canvas.create_line(10, 10, 200, 50)The "create_line" method will return an item id (an integer) that can be used to uniquely refer to this item; every item created will get its own id. Though often we don't need to refer to the item later and will therefore ignore the returned id, we'll see how it can be used shortly.
Let's start our simple sketchpad example. For now, we'll want to be able to draw freehand on the canvas by dragging the mouse on it. We'll create a canvas widget, and then attach event bindings to it to capture mouse clicks and drags. When we first click the mouse, we'll remember that location as our "start" position. Every time the mouse is moved with the mouse button still held down, we'll create a line item going from this "start" position to the current mouse position. The current position will then be the "start" position for the next line segment.
#For Python 2.6
from Tkinter import *

#Globals
lastx, lasty = 0, 0

#Definitions
def xy(event):
    global lastx, lasty
    lastx, lasty = event.x, event.y

def addLine(event):
    global lastx, lasty
    canvas.create_line((lastx, lasty, event.x, event.y))
    lastx, lasty = event.x, event.y

#Root Create + Setup
root = Tk()
root.columnconfigure(0, weight=1)
root.rowconfigure(0, weight=1)

#Canvas Create + Setup
canvas = Canvas(root)
canvas.grid(column=0, row=0, sticky=(N, W, E, S))
canvas.bind("<Button-1>", xy)
canvas.bind("<B1-Motion>", addLine)

#Main Loop
root.mainloop()
Try it out - drag the mouse around the canvas to create your masterpiece.
Item Attributes
When creating items, you can also specify one or more attributes for the item, that will affect how it is displayed. For example, here we'll specify that the line should be red, and three pixels wide.
canvas.create_line(10, 10, 200, 50, fill='red', width=3)The exact set of attributes will vary according to the type of item.
Like with Tk widgets, changing attributes for canvas items after you've already created them can also be done.
id = canvas.create_line(0, 0, 10, 10, -fill red)
...
canvas.itemconfigure(id, fill='blue', width=2)
Bindings
We've already seen that the canvas widget as a whole, like any other Tk widget, can capture events using the "bind" command.
You can also attach bindings to individual items in the canvas (or groups of them, as we'll see in the next section using tags). So if you want to know whether or not a particular item has been clicked on, you don't need to watch for mouse click events for the canvas as a whole, and then figure out if that click happened on your item. Tk will take care of all this for you.
To capture these events, you use a bind command built into the canvas. It works exactly like the regular bind command, taking an event pattern and a callback. The only difference is you specify the canvas item this binding applies to.
canvas.tag_bind(id, '<1>', …)Note the difference between the item-specific "tag_bind" method, and the widgetlevel "bind" method.
Let's add some code to our sketchpad example to allow changing the drawing color. We'll first create a few different rectangle items, each filled with a different color. Creating rectangle items is just like creating line items, where you'll specify the coordinates of two diagonally opposite corners. We'll then attach a binding to each of these so that when they're clicked on, they'll set a global variable to the color to use. Our mouse motion binding will look at that variable when creating the line segments.
#Globals
color = "black"
#Definitions
def setColor(newcolor):
    global color
    color = newcolor

def addLine(event):
    global lastx, lasty
    canvas.create_line((lastx, lasty, event.x, event.y), fill=color)
    lastx, lasty = event.x, event.y

#Canvas Setup
id = canvas.create_rectangle((10, 10, 30, 30), fill="red")
canvas.tag_bind(id, "<Button-1>", lambda x: setColor("red"))
id = canvas.create_rectangle((10, 35, 30, 55), fill="blue")
canvas.tag_bind(id, "<Button-1>", lambda x: setColor("blue"))
id = canvas.create_rectangle((10, 60, 30, 80), fill="black")
canvas.tag_bind(id, "<Button-1>", lambda x: setColor("black"))
Tags
We've seen that every canvas item has a unique id number, but there is another very useful and powerful way to refer to items on a canvas, and that is using tags.
A tag is just an identifier of your creation, something meaningful to your program. You can attach tags to canvas items; each item can have any number of tags. Unlike item id numbers, which are unique for each item, many items can have the same tag.
What can you do with tags? We saw that you can use the item id to modify a canvas item (and we'll see soon there are other things you can do to items, like move them around, delete them, etc.). Any time you can use an item id, you can use a tag. So for example, you can change the color of all items having a specific tag.
Tags are a good way to identify certain types of items in your canvas (items that are part of a drawn line, items that are part of the pallette, etc.). You can use tags to correlate canvas items to particular objects in your application (so for example, tag all canvas items that are part of the robot with id #37 with the tag "robot37"). With tags, you don't have to keep track of the ids of canvas items to refer to groups of items later; tags let Tk do that for you.
You can assign tags when creating an item using the "tags" item configuration option. You can add tags later with the "addtag" method, or remove them with the "dtags" method. You can get the list of tags for an item with the "gettags" method, or return a list of item id numbers having the given tag with the "find" command.
For example:
>>> c = Canvas(root)
>>> c.create_line(10, 10, 20, 20, tags=('firstline', 'drawing'))
1
>>> c.create_rectangle(30, 30, 40, 40, tags=('drawing'))
2
>>> c.addtag('rectangle', 'withtag', 2)
>>> c.addtag('polygon', 'withtag', 'rectangle')
>>> c.gettags(2)
('drawing', 'rectangle', 'polygon')
>>> c.dtag(2, 'polygon')
>>> c.gettags(2)
('drawing', 'rectangle')
>>> c.find_withtag('drawing')
(1, 2)
As you can see, things like "withtag" will take either an individual item or a tag; in the latter case, they will apply to all items having that tag (which could be none). The "addtag" and "find" have many other options, allowing you to specify items near a point, overlapping a particular area, and more.
Let's use tags first to put a border around whichever item in our color palette is currently selected.
def setColor(newcolor):
    global color
    color = newcolor
    canvas.dtag('all', 'paletteSelected')
    canvas.itemconfigure('palette', outline='white')
    canvas.addtag('paletteSelected', 'withtag', 'palette%s' % color)
    canvas.itemconfigure('paletteSelected', outline='#999999')

id = canvas.create_rectangle((10, 10, 30, 30), fill="red", tags=('palette', 'palettered'))
id = canvas.create_rectangle((10, 35, 30, 55), fill="blue", tags=('palette', 'paletteblue'))
id = canvas.create_rectangle((10, 60, 30, 80), fill="black", tags=('palette', 'paletteblack', 'paletteSelected'))

setColor('black')
canvas.itemconfigure('palette', width=5)
Let's also use tags to make the current stroke we're drawing appear more visible; when we release the mouse we'll put it back to normal.
def addLine(event):
    global lastx, lasty
    canvas.create_line((lastx, lasty, event.x, event.y), fill=color, width=5, tags='currentline')
    lastx, lasty = event.x, event.y

def doneStroke(event):
    canvas.itemconfigure('currentline', width=1)

canvas.bind("", doneStroke)
Modifying Items
You've seen how you can modify the configuration options on an item — its color, width and so on. There are a number of other things you can do items.
To delete items, use the "delete" method. To change an item's size and position, you can use the "coords" method; this allows you to provide new coordinates for the item, specified the same way as when you first created the item. Calling this method without a new set of coordinates will return the current coordinates of the item. To move one or more items by a particular horizontal or vertical amount from their current location, you can use the "move" method.
All items are ordered from top to bottom in what's called the stacking order. If an item later in the stacking order overlaps the coordinates of an item below it, the item on top will be drawn on top of the lower item. The "raise" and "lower" methods allow you to adjust an item's position in the stacking order.
There are several more operations described in the reference manual page, both to modify items and to retrieve additional information about them.
Scrolling
In many applications, you'll want the canvas to be larger than what appears on the screen. You can attach horizontal and vertical scrollbars to the canvas in the usual way, via the "xview" and "yview" methods.
As far as the size of the canvas, you can specify both how large you'd like it to be on screen, as well as what the full size of the canvas is, which would require scrolling to see. The "width" and "height" configuration options for the canvas widget will request the given amount of space from the geometry manager. The "scrollregion" configuration option (e.g. "0 0 1000 1000") tells Tk how large the canvas surface is.
You should be able to modify the sketchpad program to add scrolling, given what you already know. Give it a try.
Once you've done that, scroll the canvas down just a little bit, and then try drawing. You'll see that the line you're drawing appears above where the mouse is pointing! Surprised?
What's going on is that the global "bind" command doesn't know that the canvas is scrolled (it doesn't know the details of any particular widget). So if you've scrolled the canvas down by 50 pixels, and you click on the top left corner, bind will report that you've clicked at (0,0). But we know that because of the scrolling, that position should really be (0,50).
The "canvasx" and "canvasy" methods will translate the position onscreen (which bind is reporting) into the actual point on the canvas, taking into account scrolling. If you're adding these directly to the event bindings (as opposed to procedures called from the event bindings), be careful about quoting and substitutions, to make sure that the conversions are done when the event fires.
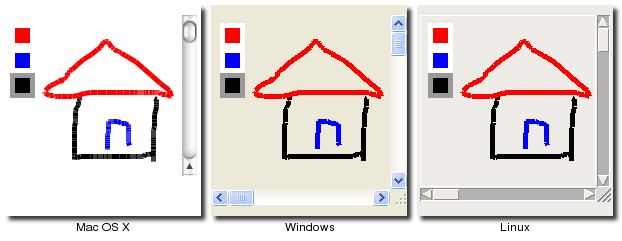
Here then is our complete example. We probably don't want the palette to be scrolled away when the canvas is scrolled, but we'll leave that for another day.
from tkinter import *

root = Tk()

h = Scrollbar(root, orient=HORIZONTAL)
v = Scrollbar(root, orient=VERTICAL)
canvas = Canvas(root, scrollregion=(0, 0, 1000, 1000), yscrollcommand=v.set, xscrollcommand=h.set)
h['command'] = canvas.xview
v['command'] = canvas.yview
#ttk.Sizegrip(root).grid(column=1, row=1, sticky=(S,E))#This line Does not work ^_^ -AR

canvas.grid(column=0, row=0, sticky=(N,W,E,S))
h.grid(column=0, row=1, sticky=(W,E))
v.grid(column=1, row=0, sticky=(N,S))
root.grid_columnconfigure(0, weight=1)
root.grid_rowconfigure(0, weight=1)

lastx, lasty = 0, 0

def xy(event):
    global lastx, lasty
    lastx, lasty = canvas.canvasx(event.x), canvas.canvasy(event.y)

def setColor(newcolor):
    global color
    color = newcolor
    canvas.dtag('all', 'paletteSelected')
    canvas.itemconfigure('palette', outline='white')
    canvas.addtag('paletteSelected', 'withtag', 'palette%s' % color)
    canvas.itemconfigure('paletteSelected', outline='#999999')

def addLine(event):
    global lastx, lasty
    x, y = canvas.canvasx(event.x), canvas.canvasy(event.y)
    canvas.create_line((lastx, lasty, x, y), fill=color, width=5, tags='currentline')
    lastx, lasty = x, y

def doneStroke(event):
    canvas.itemconfigure('currentline', width=5) # What happens if you set this to another number?

canvas.bind("<Button-1>", xy)
canvas.bind("<B1-Motion>", addLine)
canvas.bind("<B1-ButtonRelease>", doneStroke)

id = canvas.create_rectangle((10, 10, 30, 30), fill="red", tags=('palette', 'palettered'))
canvas.tag_bind(id, "<Button-1>", lambda x: setColor("red"))
id = canvas.create_rectangle((10, 35, 30, 55), fill="blue", tags=('palette', 'paletteblue'))
canvas.tag_bind(id, "<Button-1>", lambda x: setColor("blue"))
id = canvas.create_rectangle((10, 60, 30, 80), fill="black", tags=('palette', 'paletteblack', 'paletteSelected'))
canvas.tag_bind(id, "<Button-1>", lambda x: setColor("black"))

setColor('black')
canvas.itemconfigure('palette', width=5)
root.mainloop()
Other Item Types
Besides lines and rectangles, there are a number of different types of items that canvas widgets support. Remember that each one has its own set of item configuration options, detailed in the reference manual.
Items of type "line" can actually be a bit fancier than what we've seen. A line item can actually be a series of line segments, not just one; in our example, we could have chosen to use a single line item for each complete stroke. The line can also be drawn directly point-to-point, or smoothed out into a curved line.
Items of type "rectangle" we've seen. Items of type "oval" work the same but draw as an oval. Items of type "arc" allow you to draw just a piece of an oval. Items of type "polygon" allow you to draw a closed polygon with any number of sides.
Pictures can be added to canvas widgets, using items of type "bitmap" (for black and white), or type "image" (for full color).
You can add text to a canvas using items of type "text". You have complete control of the font, size, color and more, as well as the actual text that is displayed.
Perhaps most interestingly, you can embed other widgets (which would include a frame which itself contains other widgets) into a canvas using an item of type "window". When we do this, the canvas in effect acts as a geometry manager for those other widgets. This capability raises all kinds of possibilities for your application.
There is a lot more to canvas widgets than we've described here; Be sure to tell your CA that you've made it this far!
This document
abridged and edited from
http://www.tkdocs.com/tutorial/canvas.html.
Mark Roseman, © 2007-2011 Mark Roseman
![]()