pH Titration: A JavaScript Slideshow

Start the simulation (1 frame/sec).
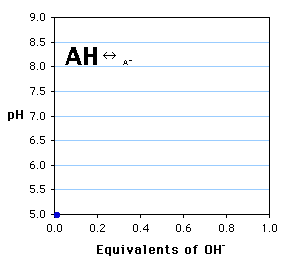
This simulation shows the stepwise titration of a weak acid (AH) with a strong base to produce the anion (A-). The pH recorded is plotted vs. the equivalents of OH- added. The sizes of the symbols corresponds to the relative concentrations of AH and A-.
- Questions (you should be able to answer):
- What is the pKa of the weak acid in this titration?
- If the starting solution were 100 ml of 0.05 M AH, what volume of 1.0 M NaOH was added at each point shown above?
- At a ratio of AH : A- = 3 : 1, what was the measured pH?
- If this simulation corresponded to the titration of a phosphate salt, write the chemical structures that correspond to AH and A- . What are the other chemical species that participate in the reaction?
![]() Back to Lecture 3: Acid-Base Equilibria & Buffers.
Back to Lecture 3: Acid-Base Equilibria & Buffers.